Gulfport, MS Investment Properties for Sale
Browse homes for sale and investment properties in Gulfport, MS. Refine your search by price, property type, or more.
Best cash flowing properties in Gulfport, MS
Active
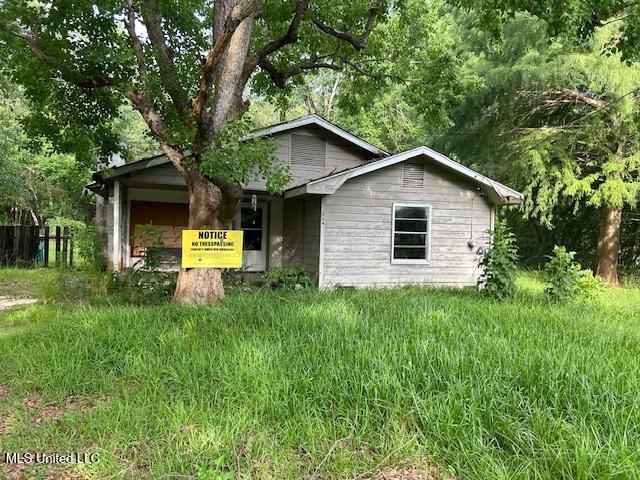
$49,500
2
bds
|
1
ba
|
0
sqft
|
built
1953
12104 Three Rivers Rd, Gulfport, MS 39503
$900
Cash flow
21.2%
Cash-on-Cash Return
21.8%
Cap rate
2.8%
Rent to Value Ratio
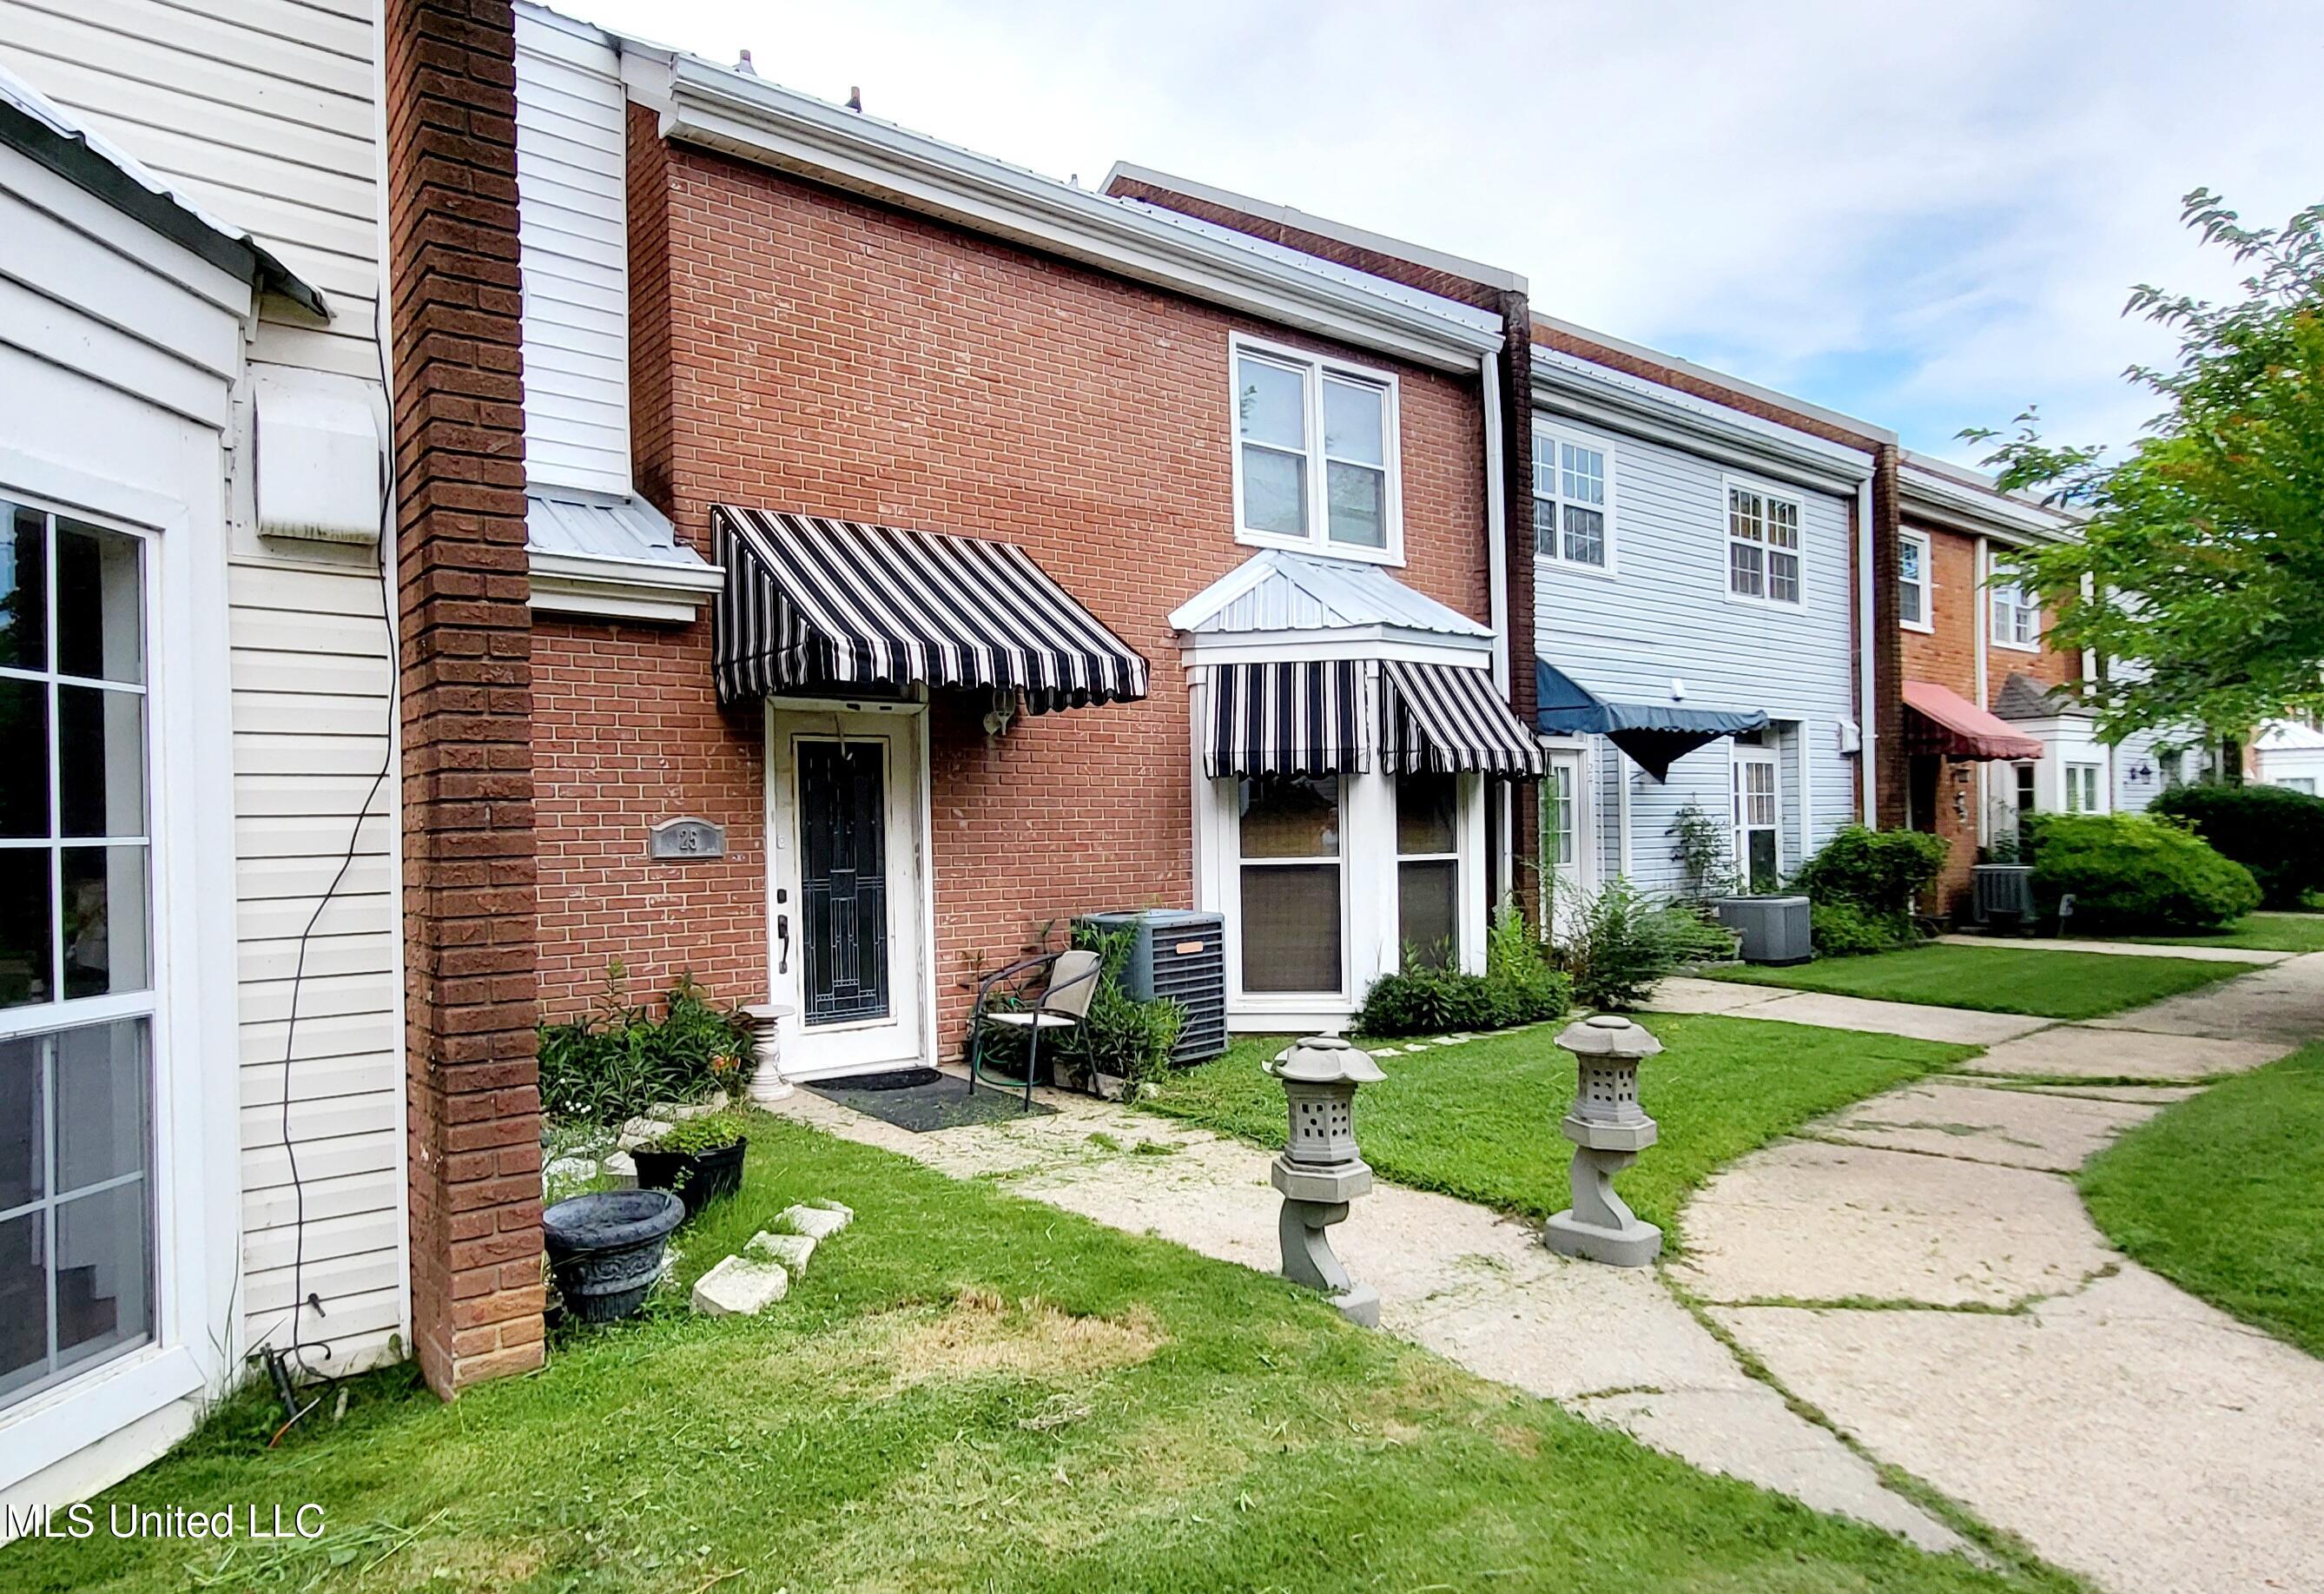
Active
$295,000
3
bds
|
2
ba
|
0
sqft
|
built
1942
1728 21st St, Gulfport, MS 39501
$789
Cash flow
14.0%
Cash-on-Cash Return
8.9%
Cap rate
1.1%
Rent to Value Ratio
298 out of 325 properties for sale in Gulfport, MS
Limited Results Shown
Create a free account, or log in to reveal all property listings and enjoy the complete experience.
Active
$130,000
3
bds
|
3
ba
|
0
sqft
|
built
1973
928 Courthouse Rd, Gulfport, MS 39507
$-114
Cash flow
-4.6%
Cash-on-Cash Return
4.6%
Cap rate
1.2%
Rent to Value Ratio
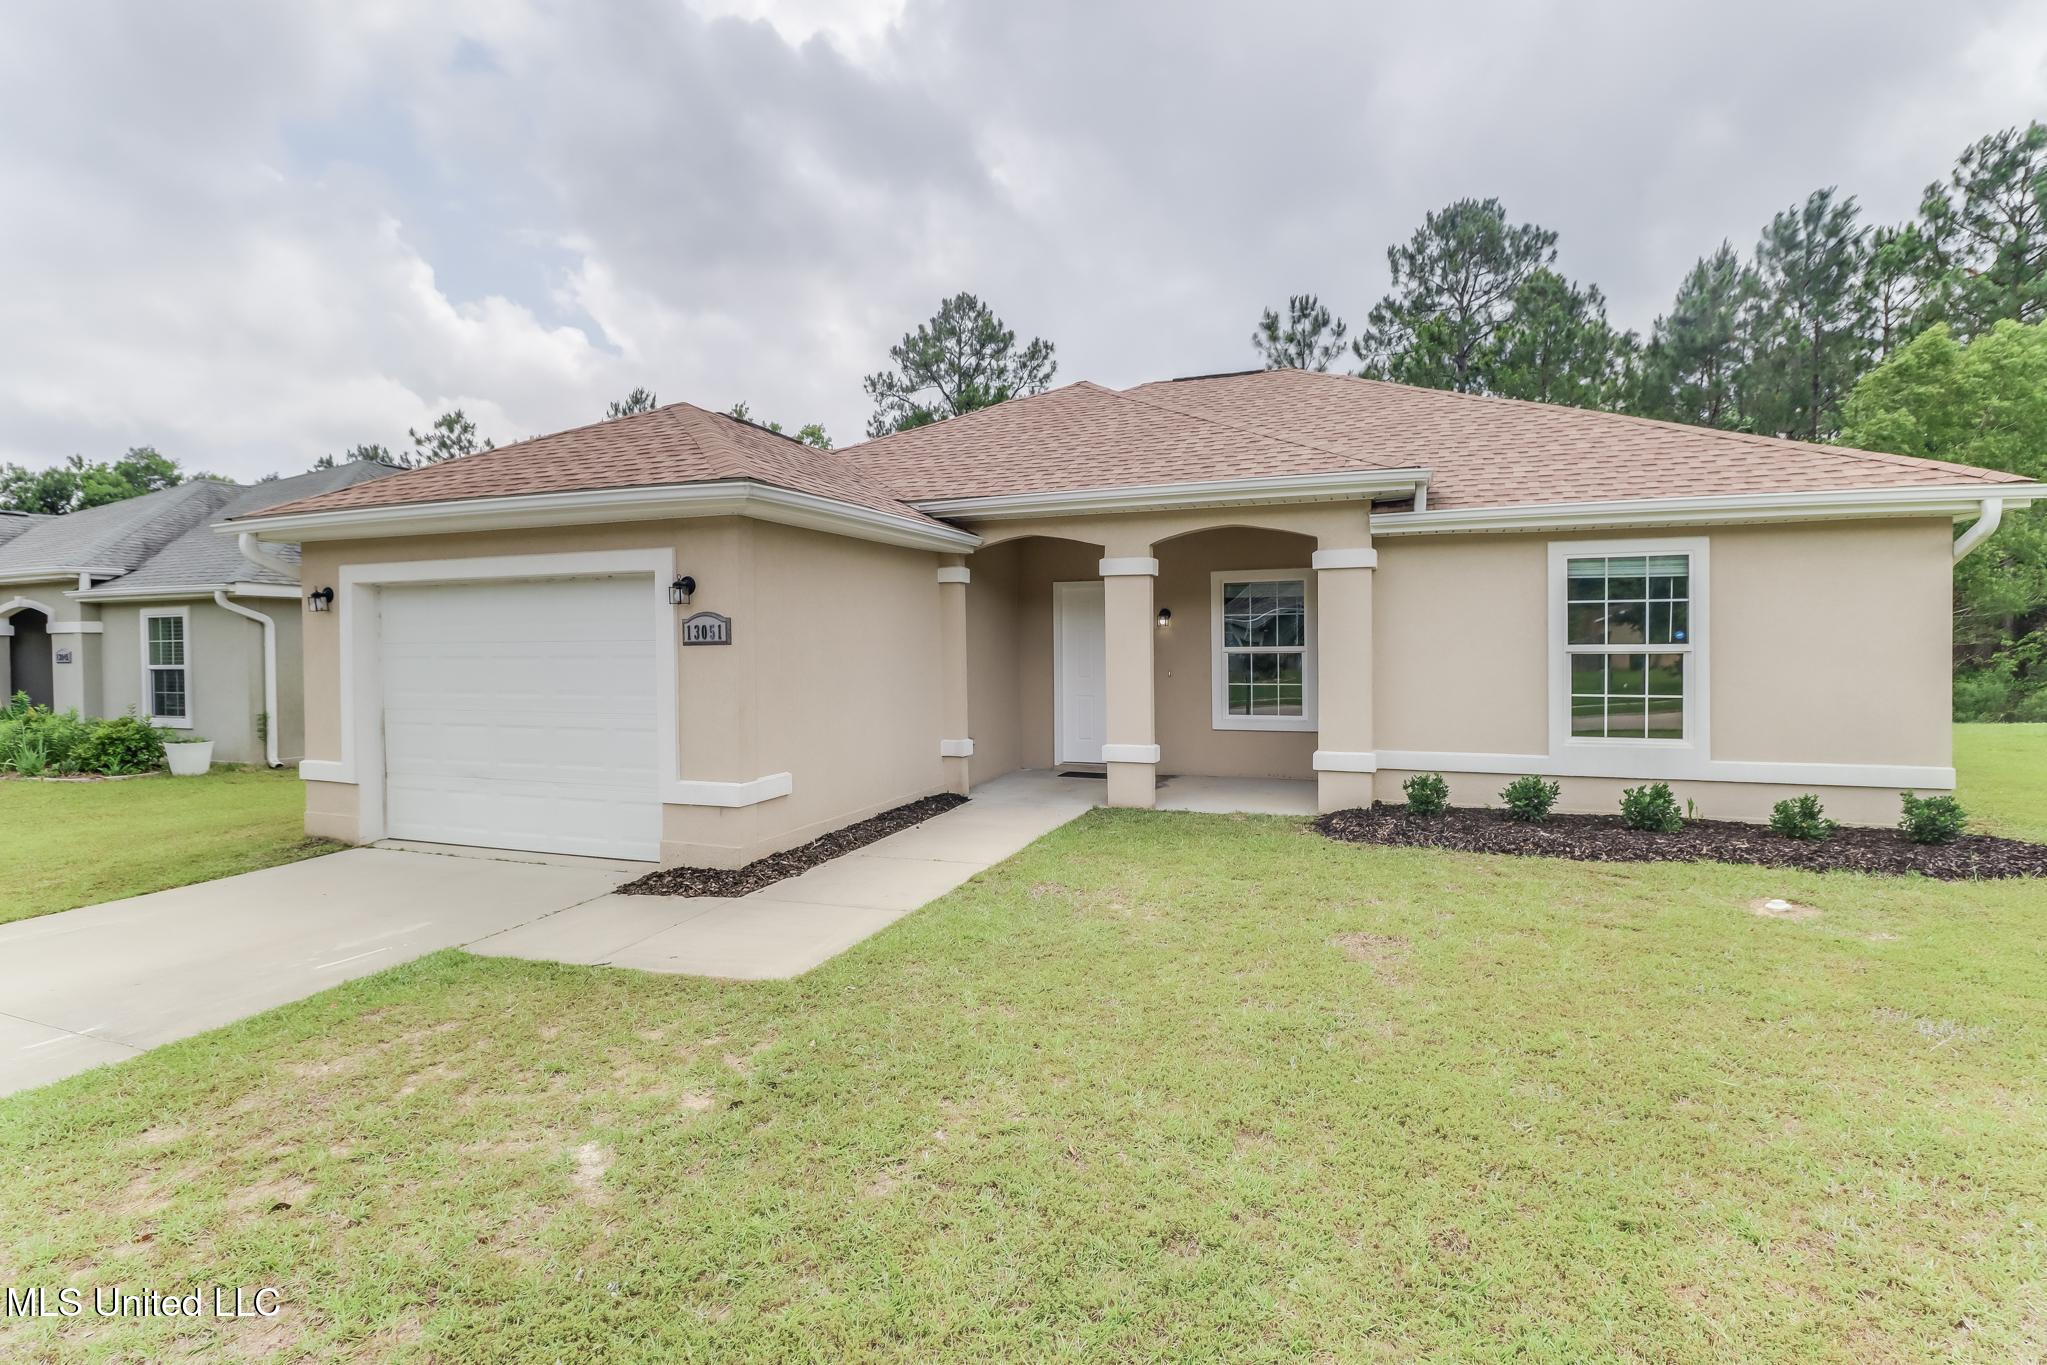
Pending
$198,281
3
bds
|
2
ba
|
0
sqft
|
built
2018
13051 Turtle Creek Pkwy, Gulfport, MS 39503
$184
Cash flow
4.8%
Cash-on-Cash Return
6.8%
Cap rate
0.9%
Rent to Value Ratio

Pending
$154,500
4
bds
|
2
ba
|
0
sqft
|
built
1965
2101 20th St, Gulfport, MS 39501
$399
Cash flow
13.5%
Cash-on-Cash Return
8.8%
Cap rate
1.2%
Rent to Value Ratio
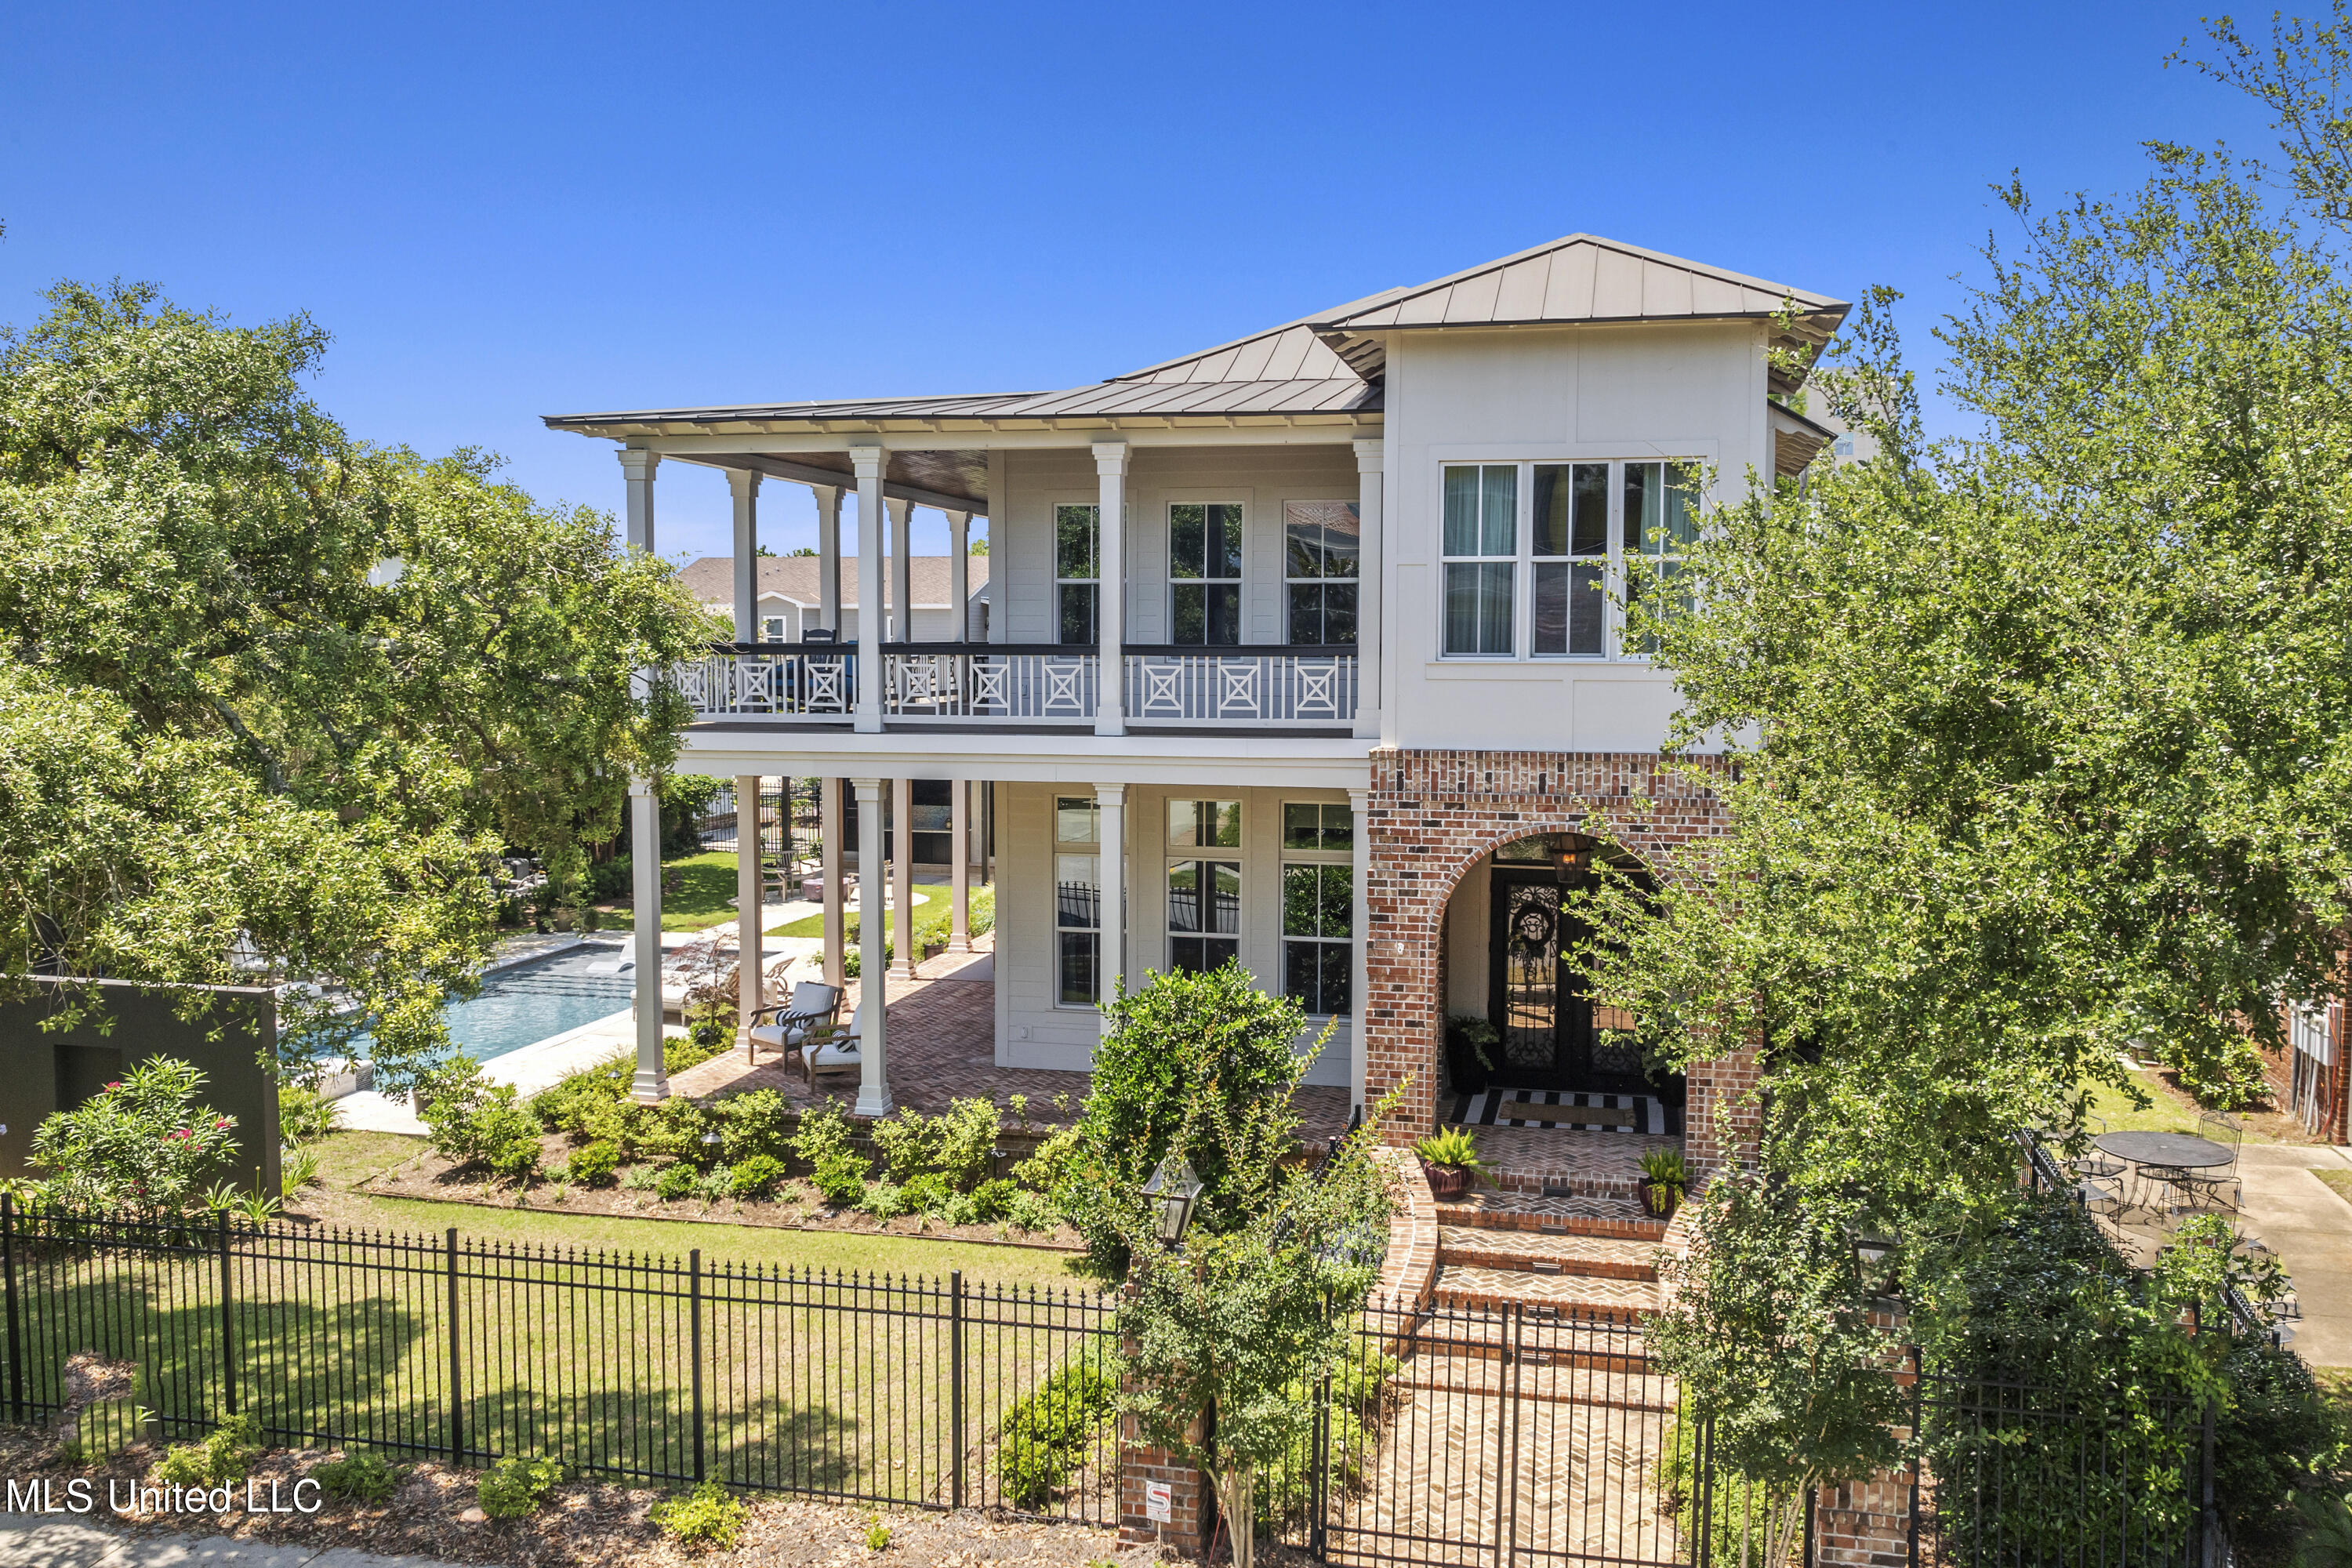
Pending
$1,200,000
5
bds
|
5
ba
|
0
sqft
|
built
2014
1511 18th Ave, Gulfport, MS 39501
$-4,431
Cash flow
-19.3%
Cash-on-Cash Return
1.2%
Cap rate
0.2%
Rent to Value Ratio

Active
$214,900
3
bds
|
2
ba
|
0
sqft
|
built
1950
1264 28th St, Gulfport, MS 39501
$254
Cash flow
6.2%
Cash-on-Cash Return
7.1%
Cap rate
0.9%
Rent to Value Ratio

Active
$270,000
4
bds
|
2
ba
|
0
sqft
|
built
2013
13703 Windwood Dr, Gulfport, MS 39503
$238
Cash flow
4.6%
Cash-on-Cash Return
6.7%
Cap rate
0.9%
Rent to Value Ratio
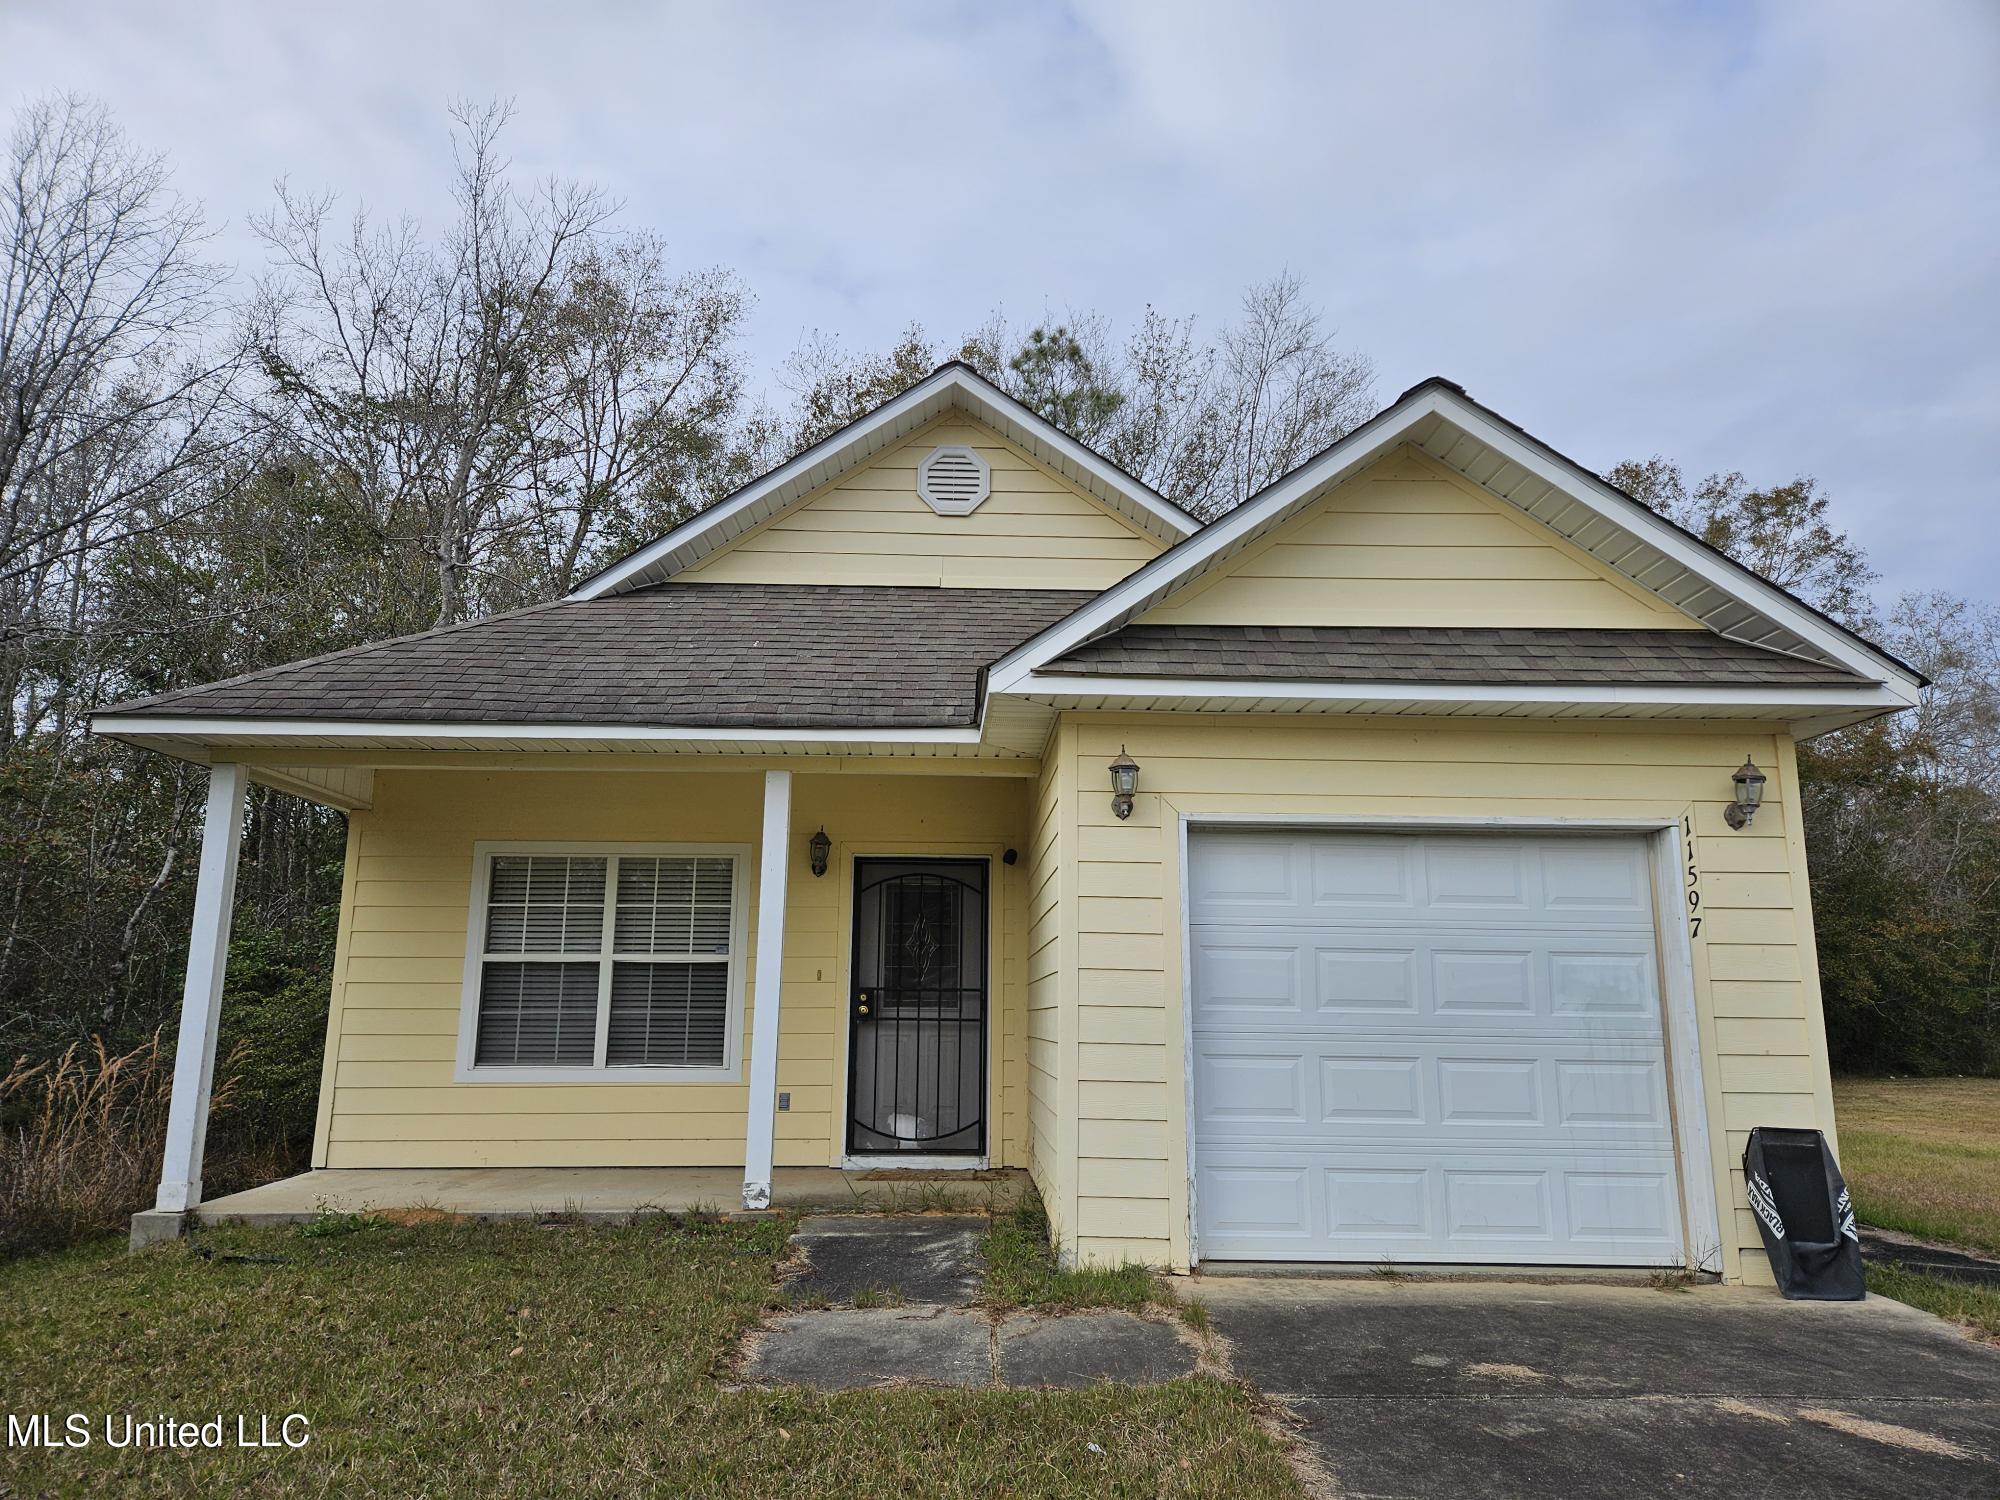
Active
$145,000
3
bds
|
2
ba
|
0
sqft
|
built
2006
11597 Oaklane Dr, Gulfport, MS 39503
$252
Cash flow
9.1%
Cash-on-Cash Return
7.8%
Cap rate
1.0%
Rent to Value Ratio
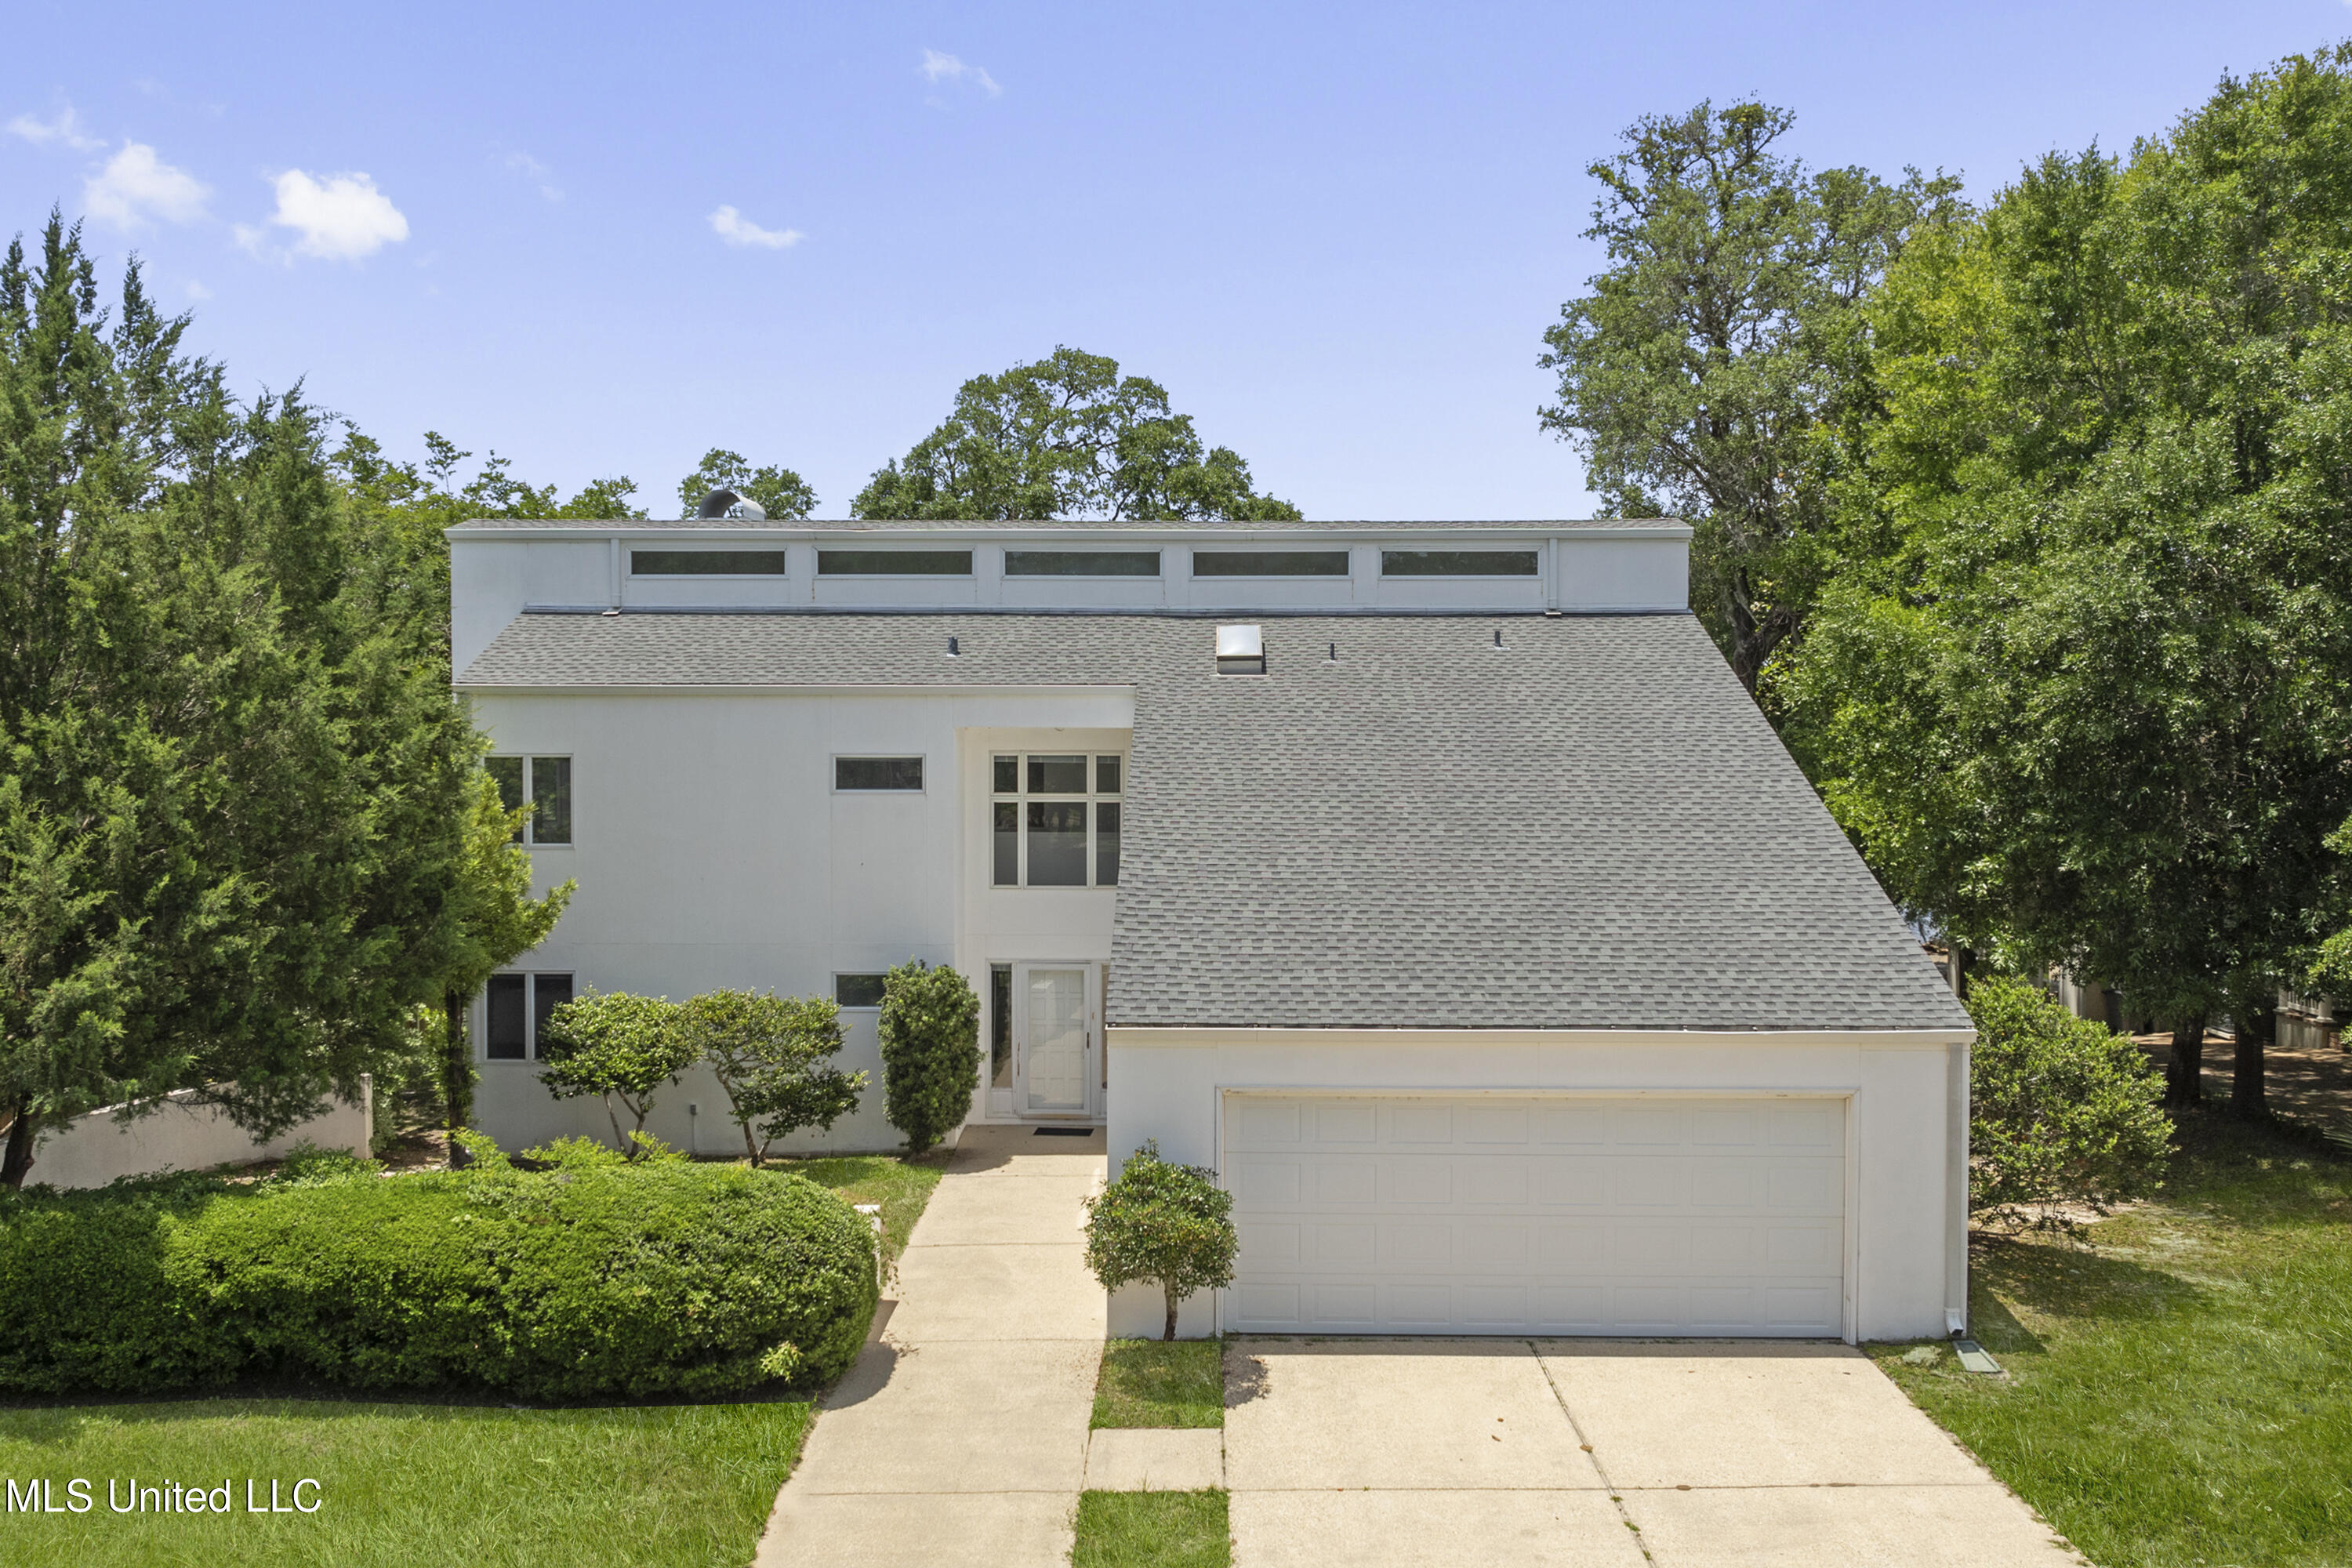
Active
$975,000
4
bds
|
4
ba
|
0
sqft
|
built
1986
11 Bayou Pl, Gulfport, MS 39503
$-2,875
Cash flow
-15.4%
Cash-on-Cash Return
2.1%
Cap rate
0.4%
Rent to Value Ratio
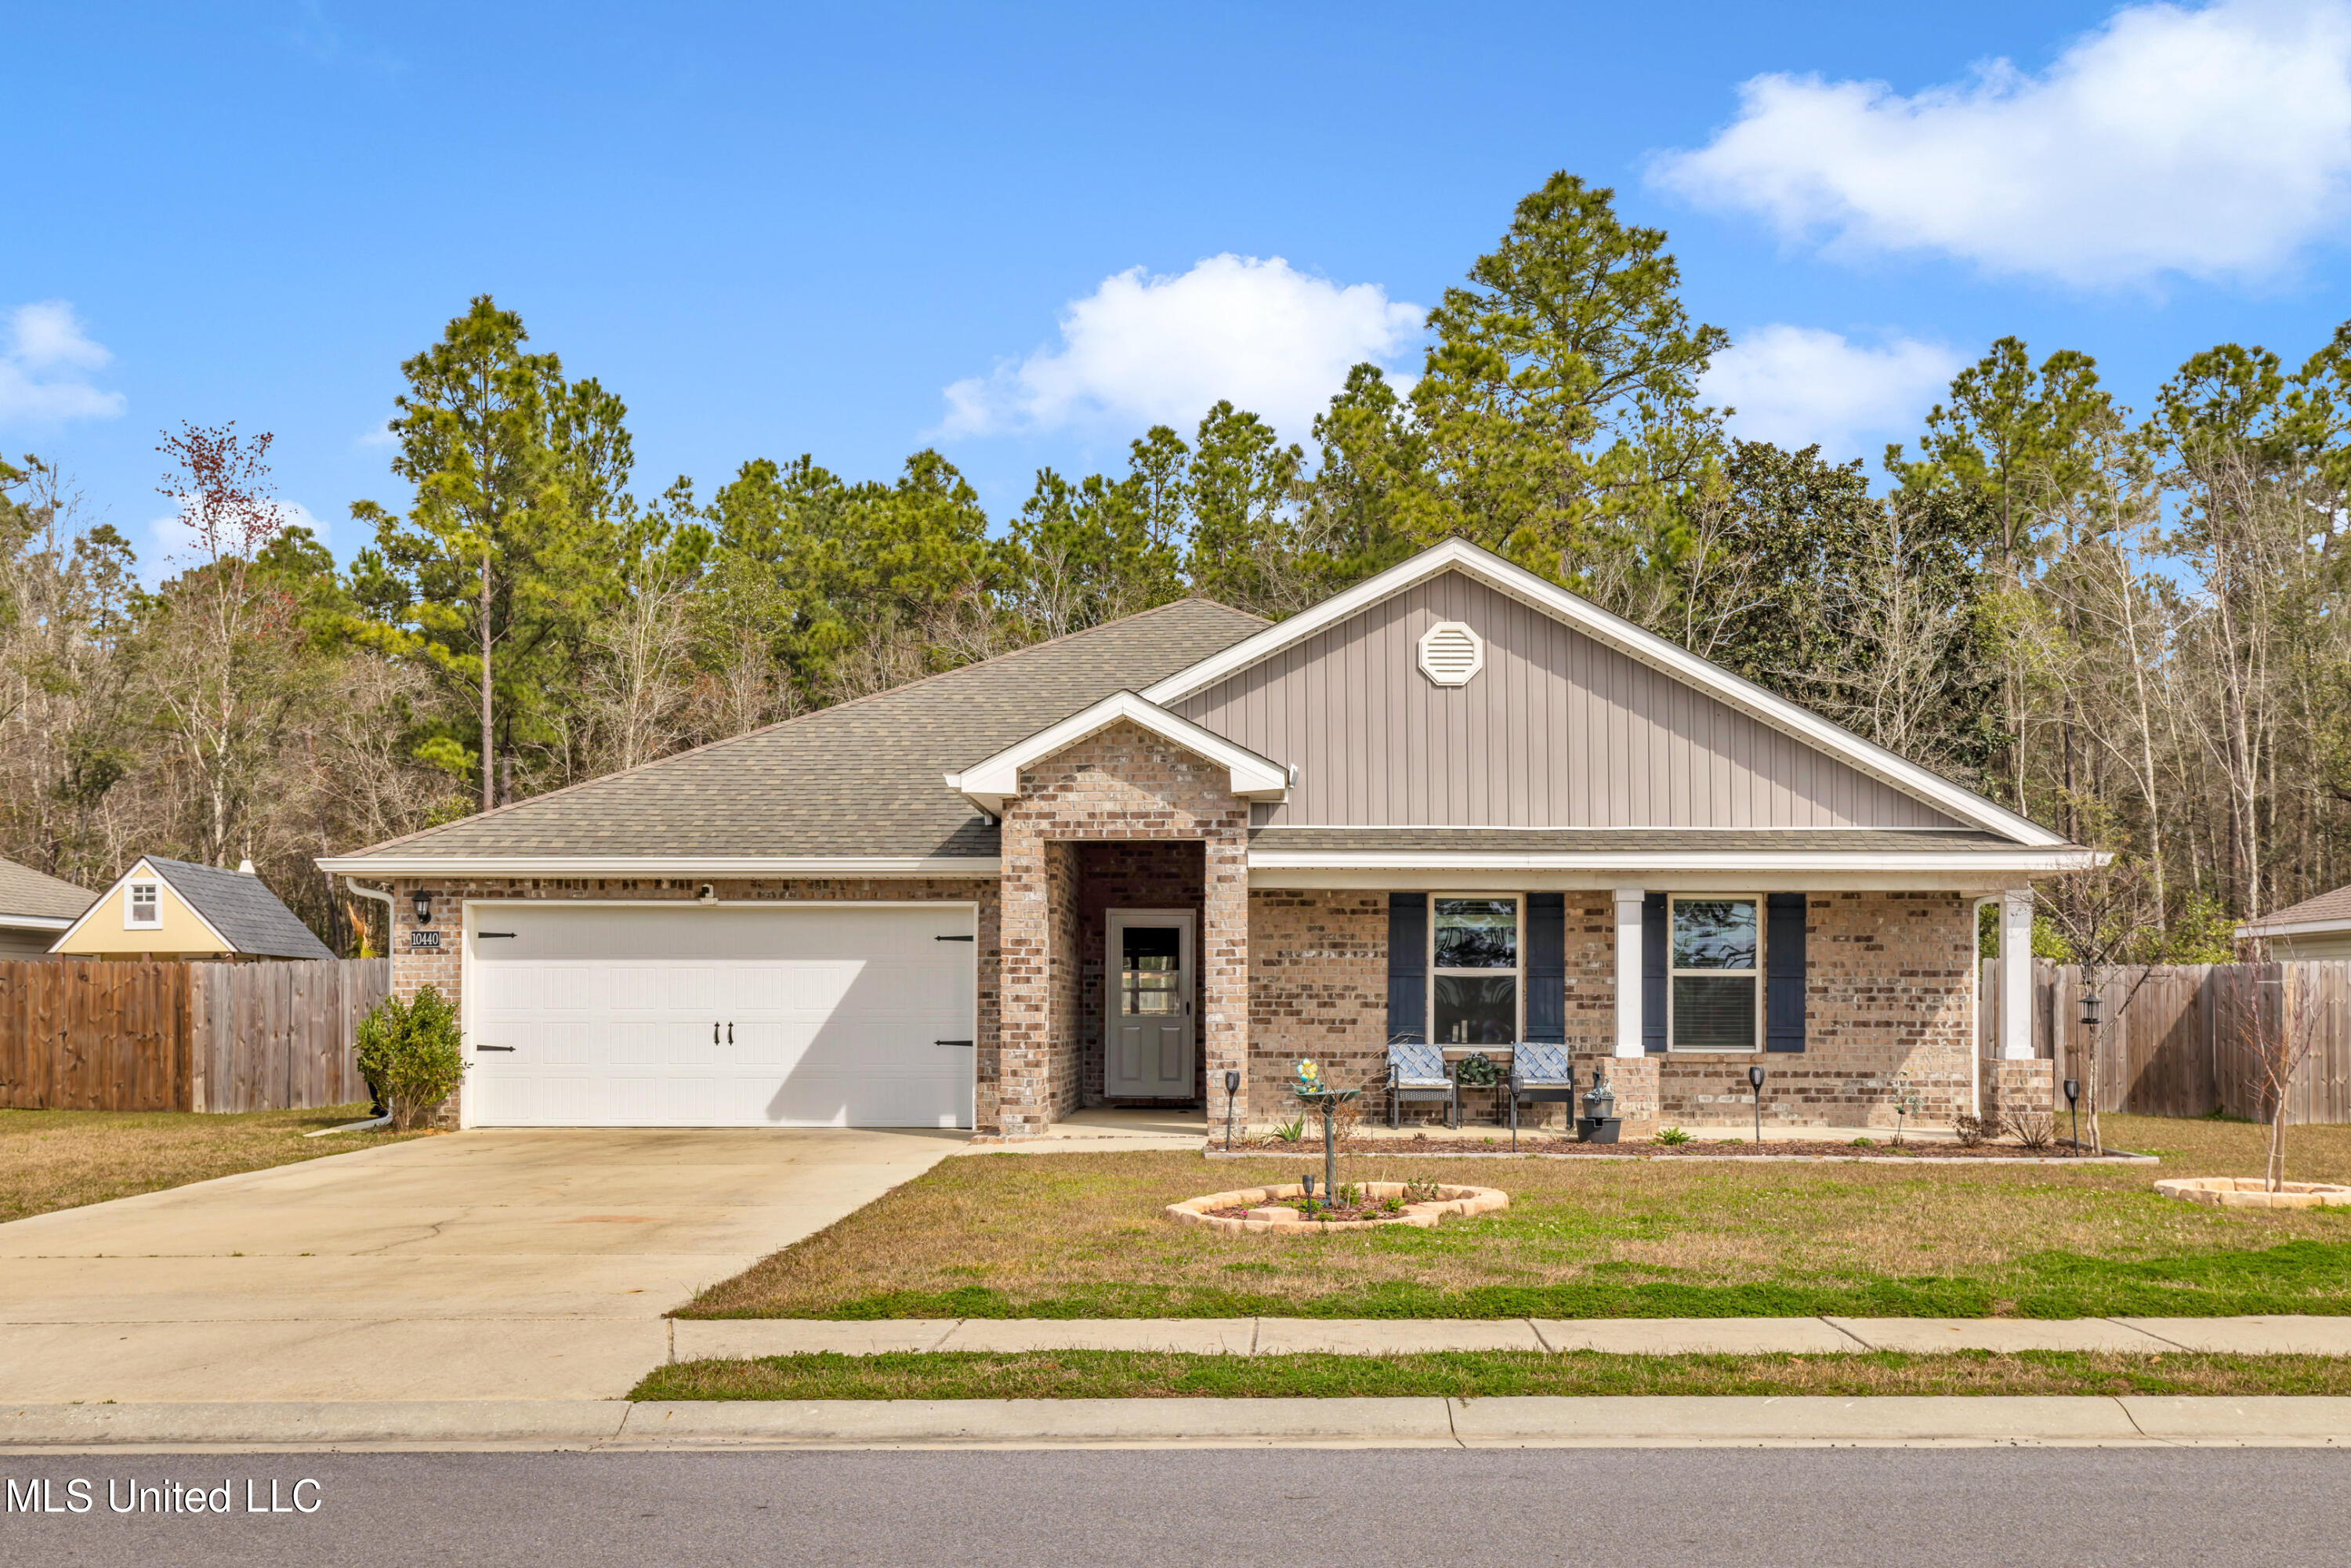
Active
$304,900
4
bds
|
2
ba
|
0
sqft
|
built
2021
10440 Willow Leaf Dr, Gulfport, MS 39503
$87
Cash flow
1.5%
Cash-on-Cash Return
6.0%
Cap rate
0.8%
Rent to Value Ratio
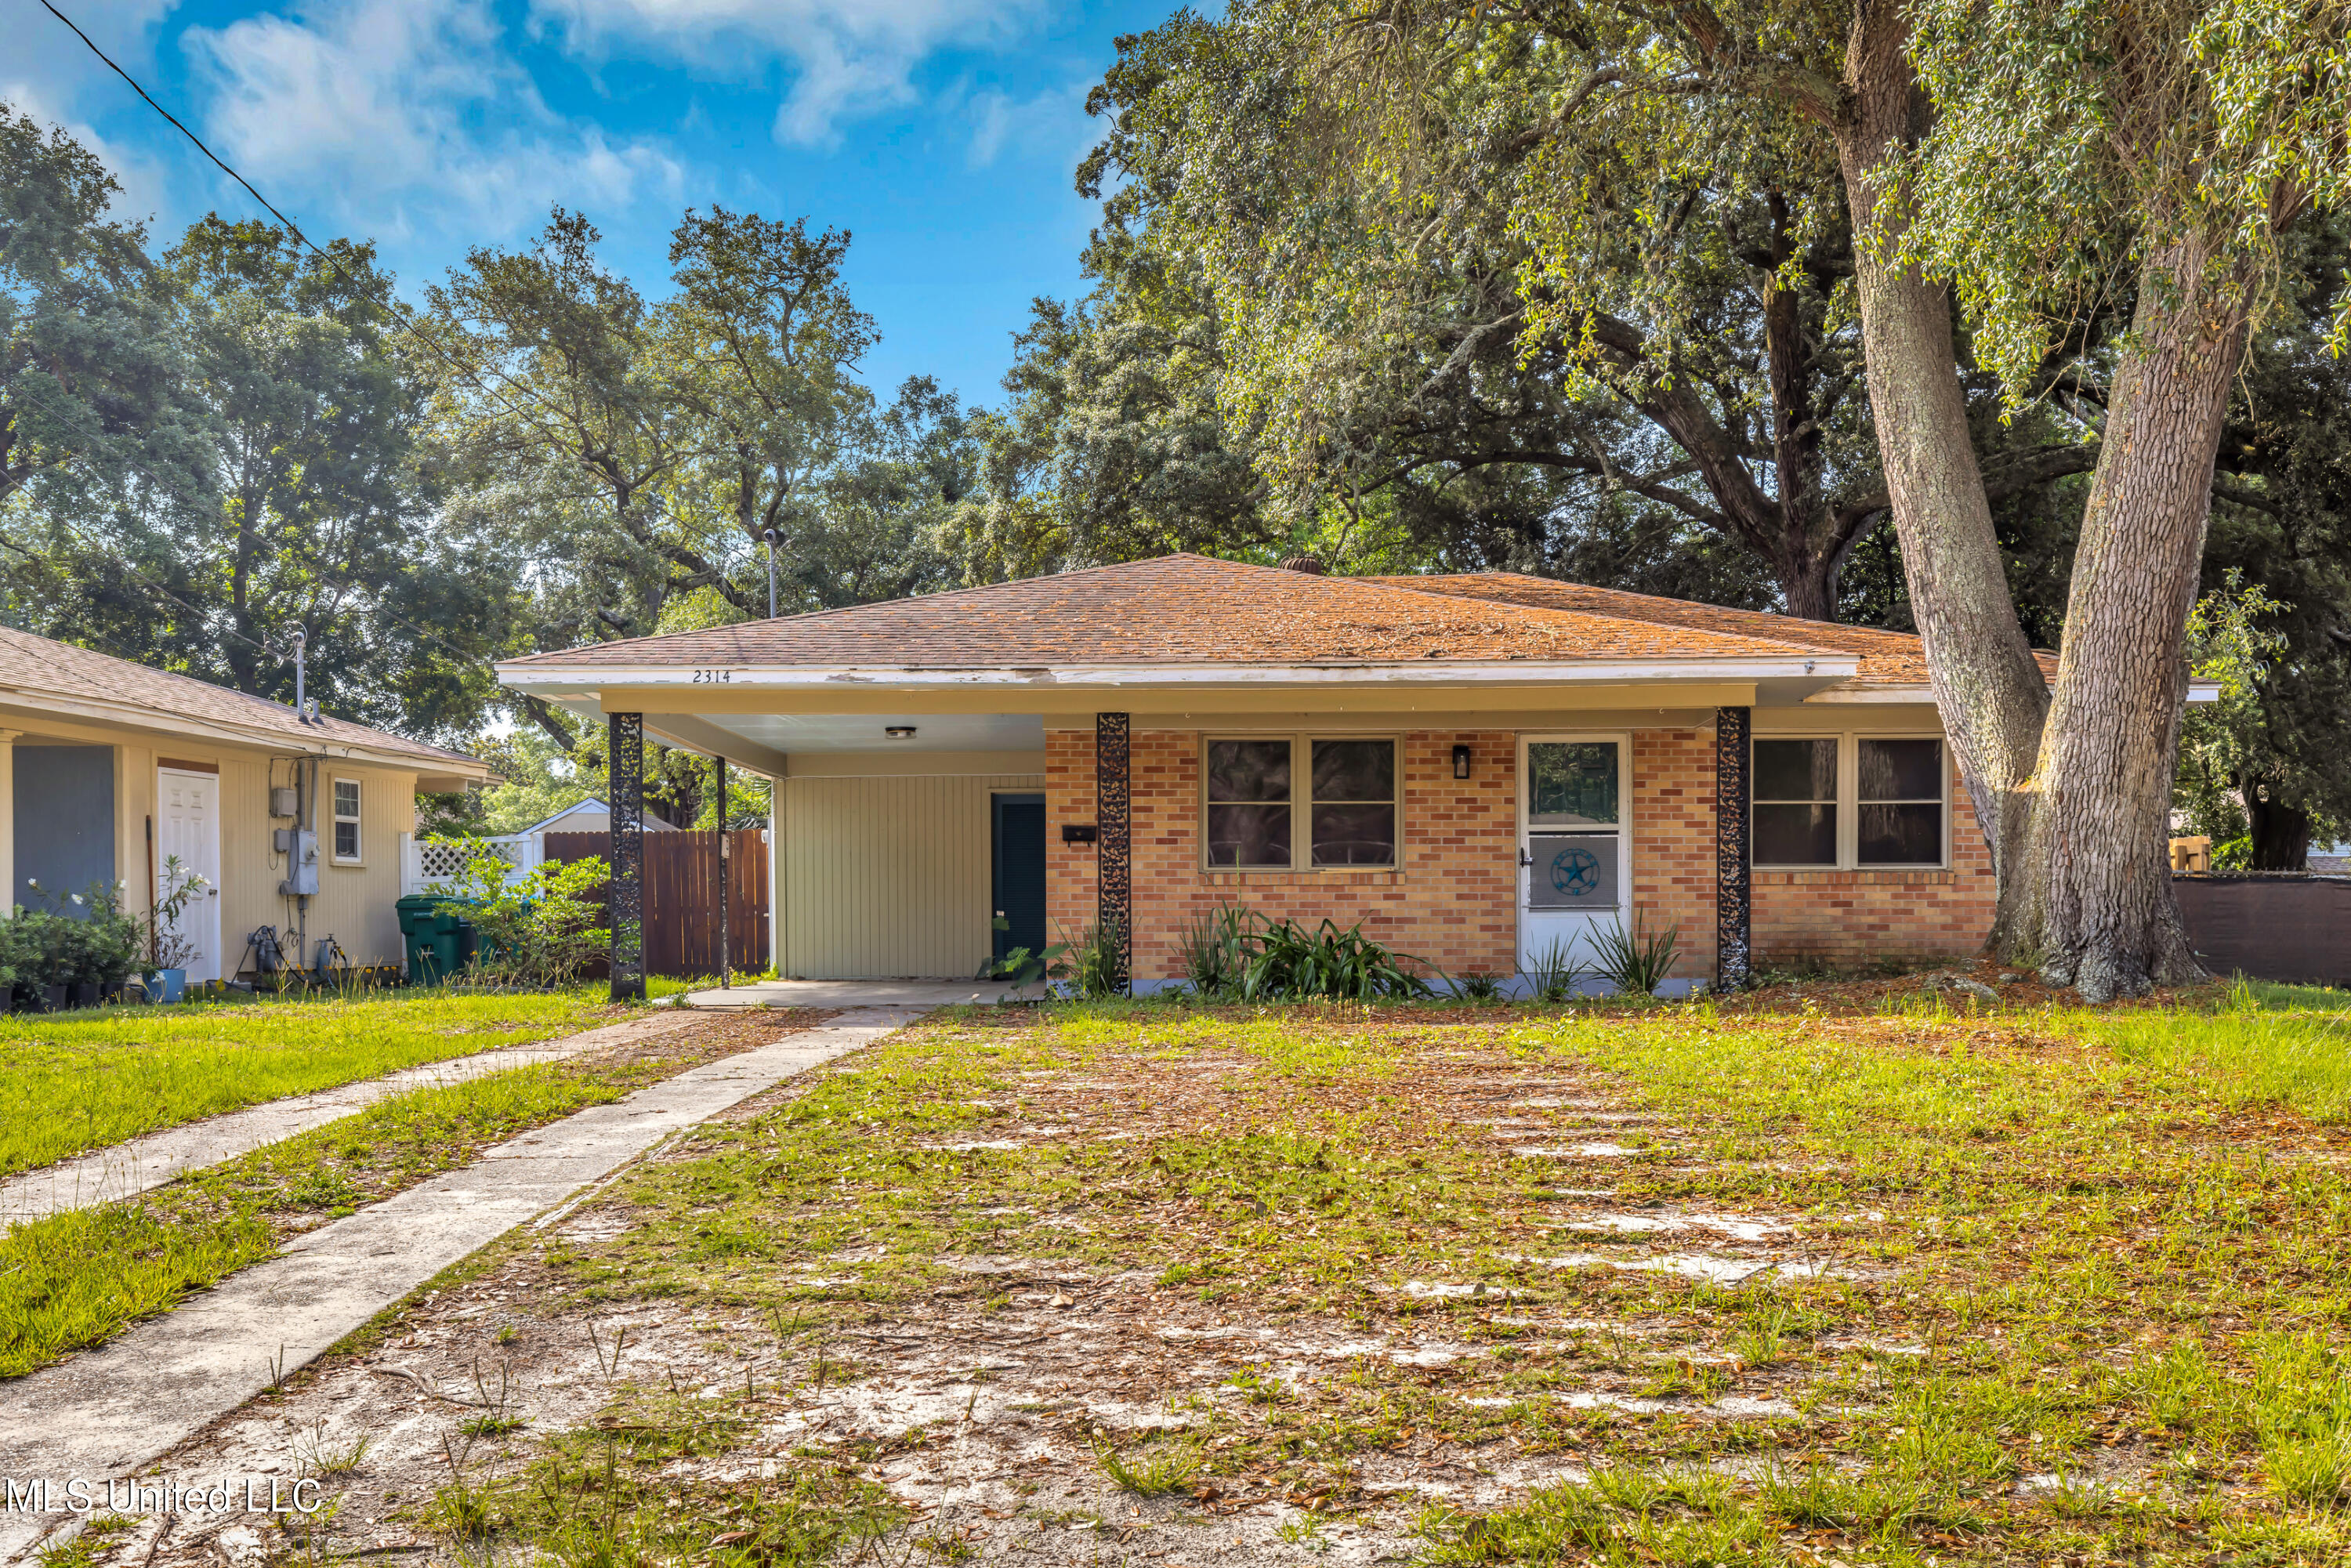
Active
$149,900
3
bds
|
1
ba
|
0
sqft
|
built
1957
2314 Curcor Dr, Gulfport, MS 39507
$412
Cash flow
14.3%
Cash-on-Cash Return
9.0%
Cap rate
1.1%
Rent to Value Ratio
Active
$159,000
3
bds
|
1
ba
|
0
sqft
|
built
1960
101 30th St, Gulfport, MS 39507
$181
Cash flow
5.9%
Cash-on-Cash Return
7.0%
Cap rate
0.9%
Rent to Value Ratio
Active
$199,900
3
bds
|
2
ba
|
0
sqft
|
built
1952
635 Oakleigh Ave, Gulfport, MS 39507
$-140
Cash flow
-3.7%
Cash-on-Cash Return
4.8%
Cap rate
0.7%
Rent to Value Ratio

Active
$199,500
2
bds
|
1
ba
|
0
sqft
|
built
1988
1101 John Evans Dr, Gulfport, MS 39507
$284
Cash flow
7.4%
Cash-on-Cash Return
7.4%
Cap rate
1.0%
Rent to Value Ratio
Active
$244,900
3
bds
|
3
ba
|
0
sqft
|
built
1980
8 Katherine Pl, Gulfport, MS 39503
$-103
Cash flow
-2.2%
Cash-on-Cash Return
5.2%
Cap rate
0.7%
Rent to Value Ratio
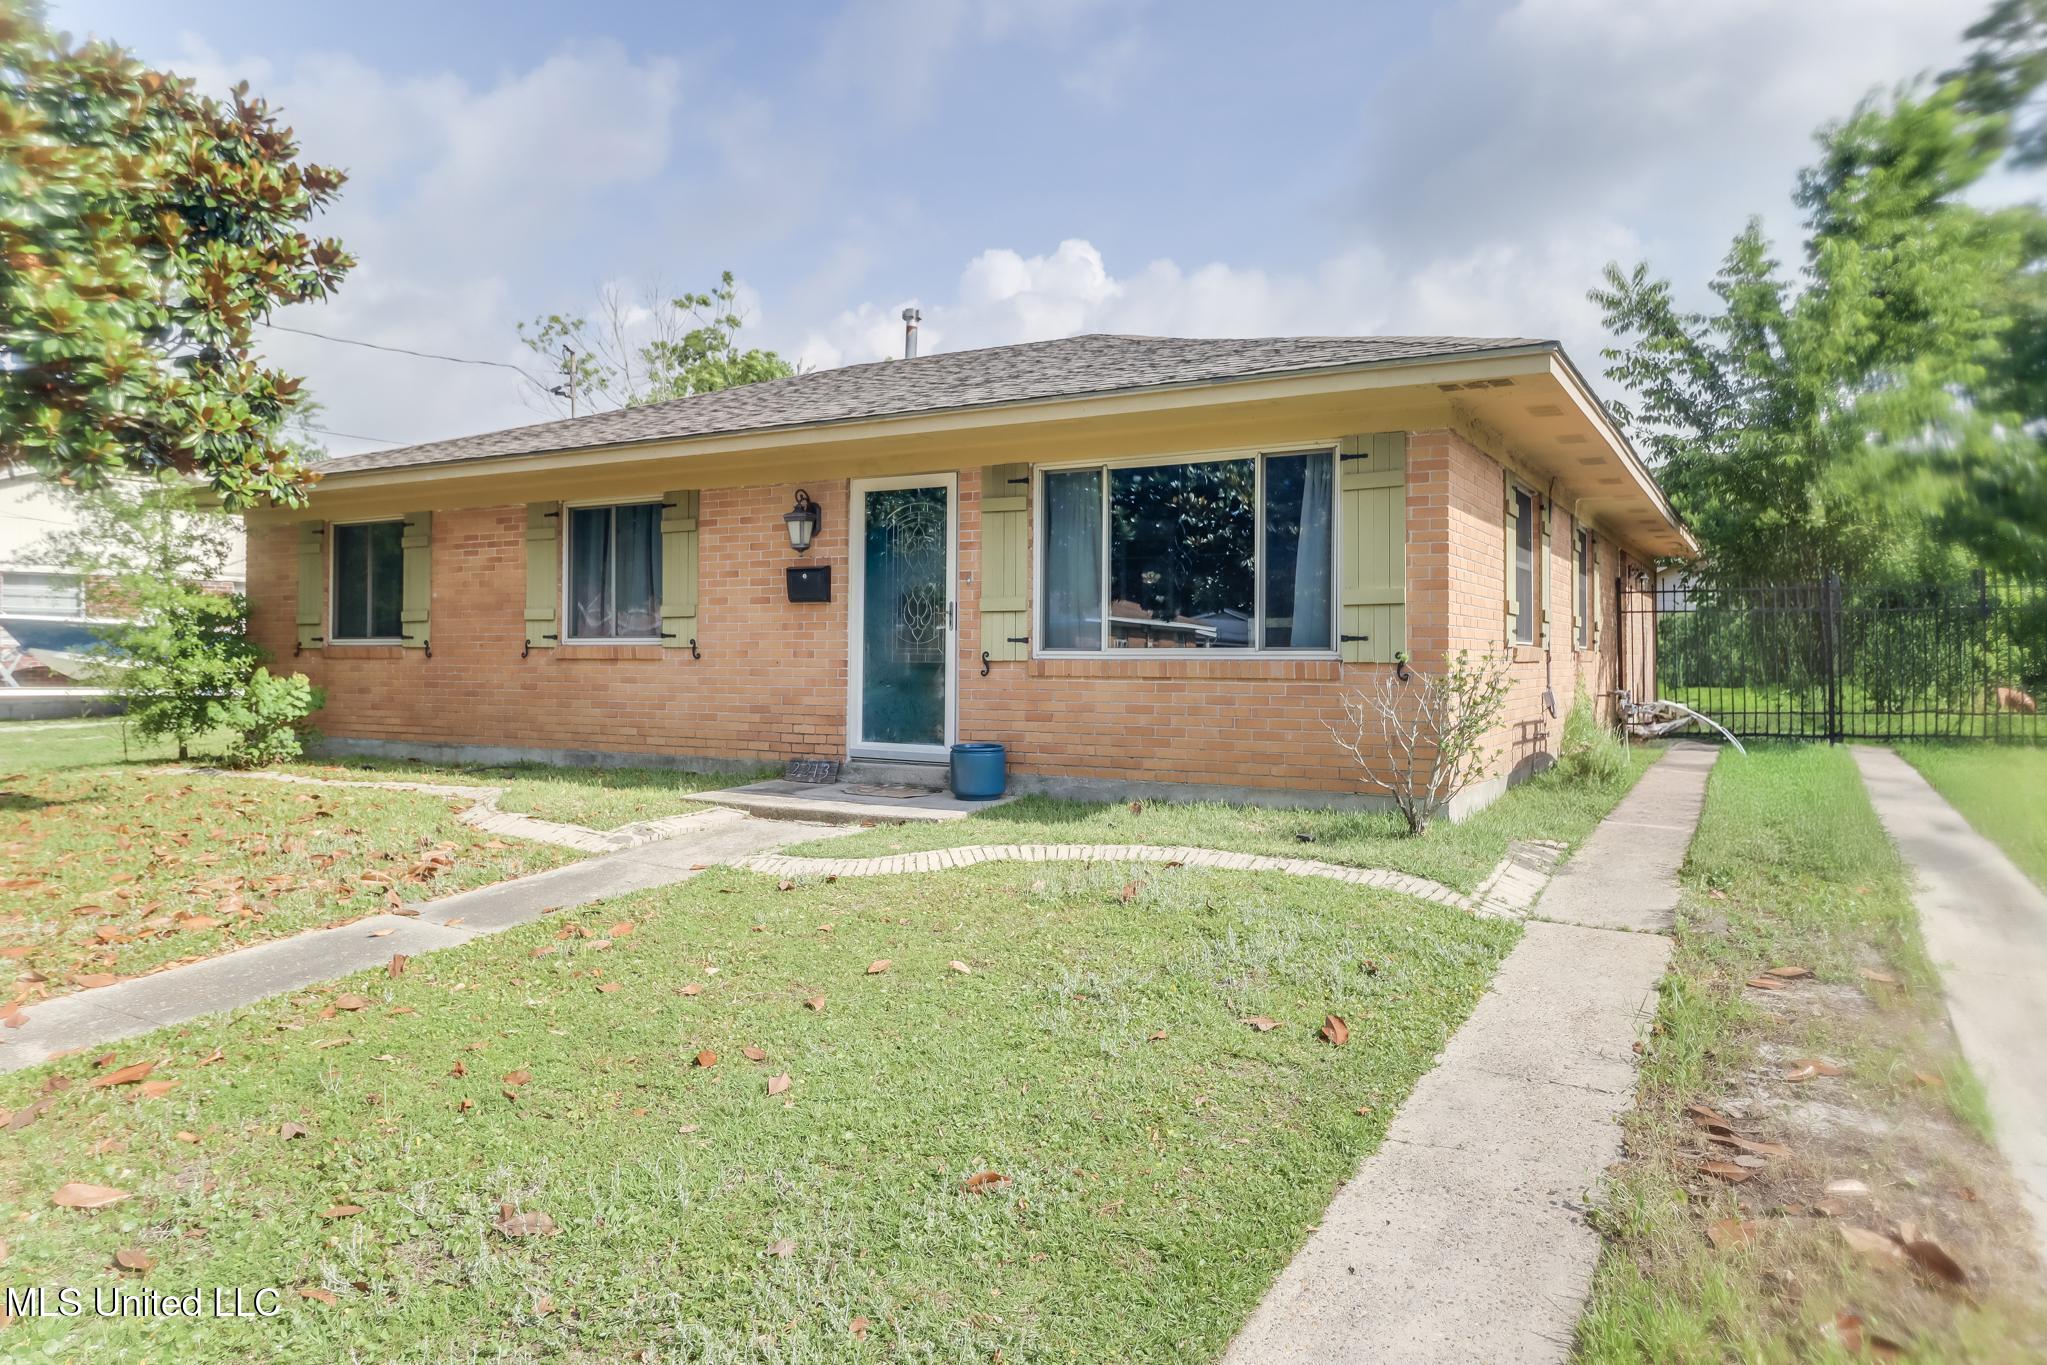
Active
$250,000
3
bds
|
2
ba
|
0
sqft
|
built
1959
2213 North St, Gulfport, MS 39507
$-73
Cash flow
-1.5%
Cash-on-Cash Return
5.3%
Cap rate
0.7%
Rent to Value Ratio
Active
$174,900
3
bds
|
2
ba
|
0
sqft
|
built
1995
13007 Walnut Ct, Gulfport, MS 39503
$147
Cash flow
4.4%
Cash-on-Cash Return
6.7%
Cap rate
0.9%
Rent to Value Ratio

Active
$419,000
4
bds
|
3
ba
|
0
sqft
|
built
1967
78 Bayou Cir, Gulfport, MS 39507
$-210
Cash flow
-2.6%
Cash-on-Cash Return
5.1%
Cap rate
0.7%
Rent to Value Ratio
Pending
$262,500
4
bds
|
3
ba
|
0
sqft
|
built
1973
6028 S Vista Dr, Gulfport, MS 39507
$296
Cash flow
5.9%
Cash-on-Cash Return
7.0%
Cap rate
1.0%
Rent to Value Ratio
Active
$199,000
2
bds
|
2
ba
|
0
sqft
|
built
1995
19432 Northridge Dr, Gulfport, MS 39503
$162
Cash flow
4.2%
Cash-on-Cash Return
6.7%
Cap rate
0.8%
Rent to Value Ratio
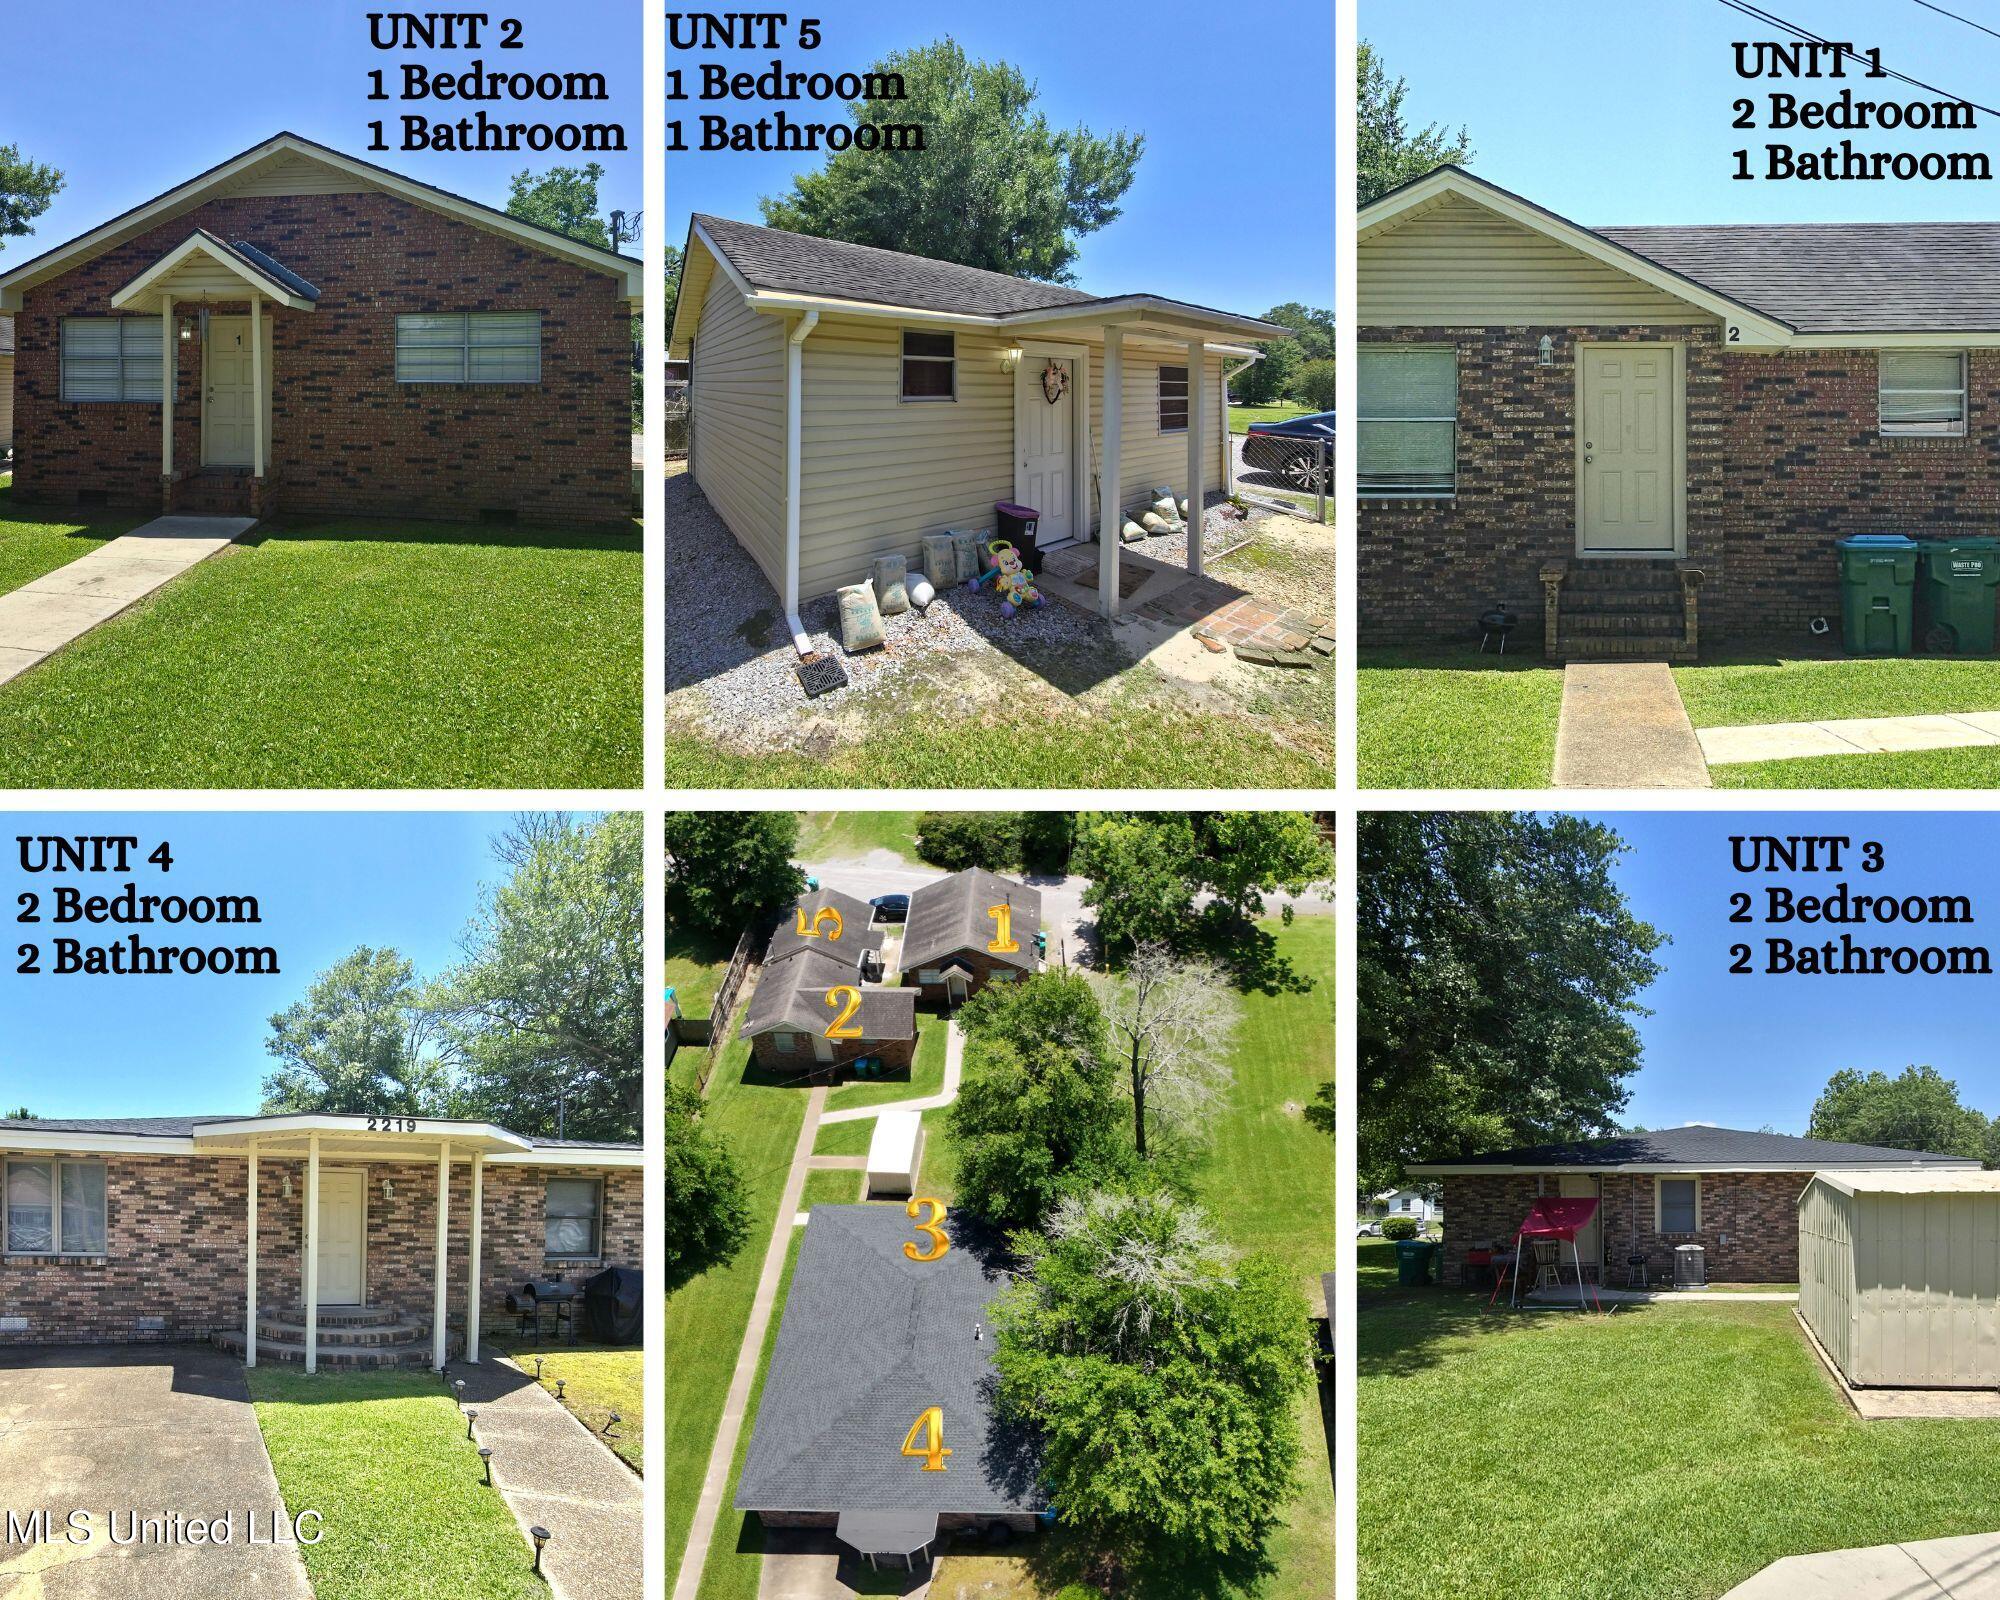
Active
$445,000
8
bds
|
7
ba
|
0
sqft
|
built
1965
2219 31st St, Gulfport, MS 39501
$-1,829
Cash flow
-21.4%
Cash-on-Cash Return
0.7%
Cap rate
0.2%
Rent to Value Ratio
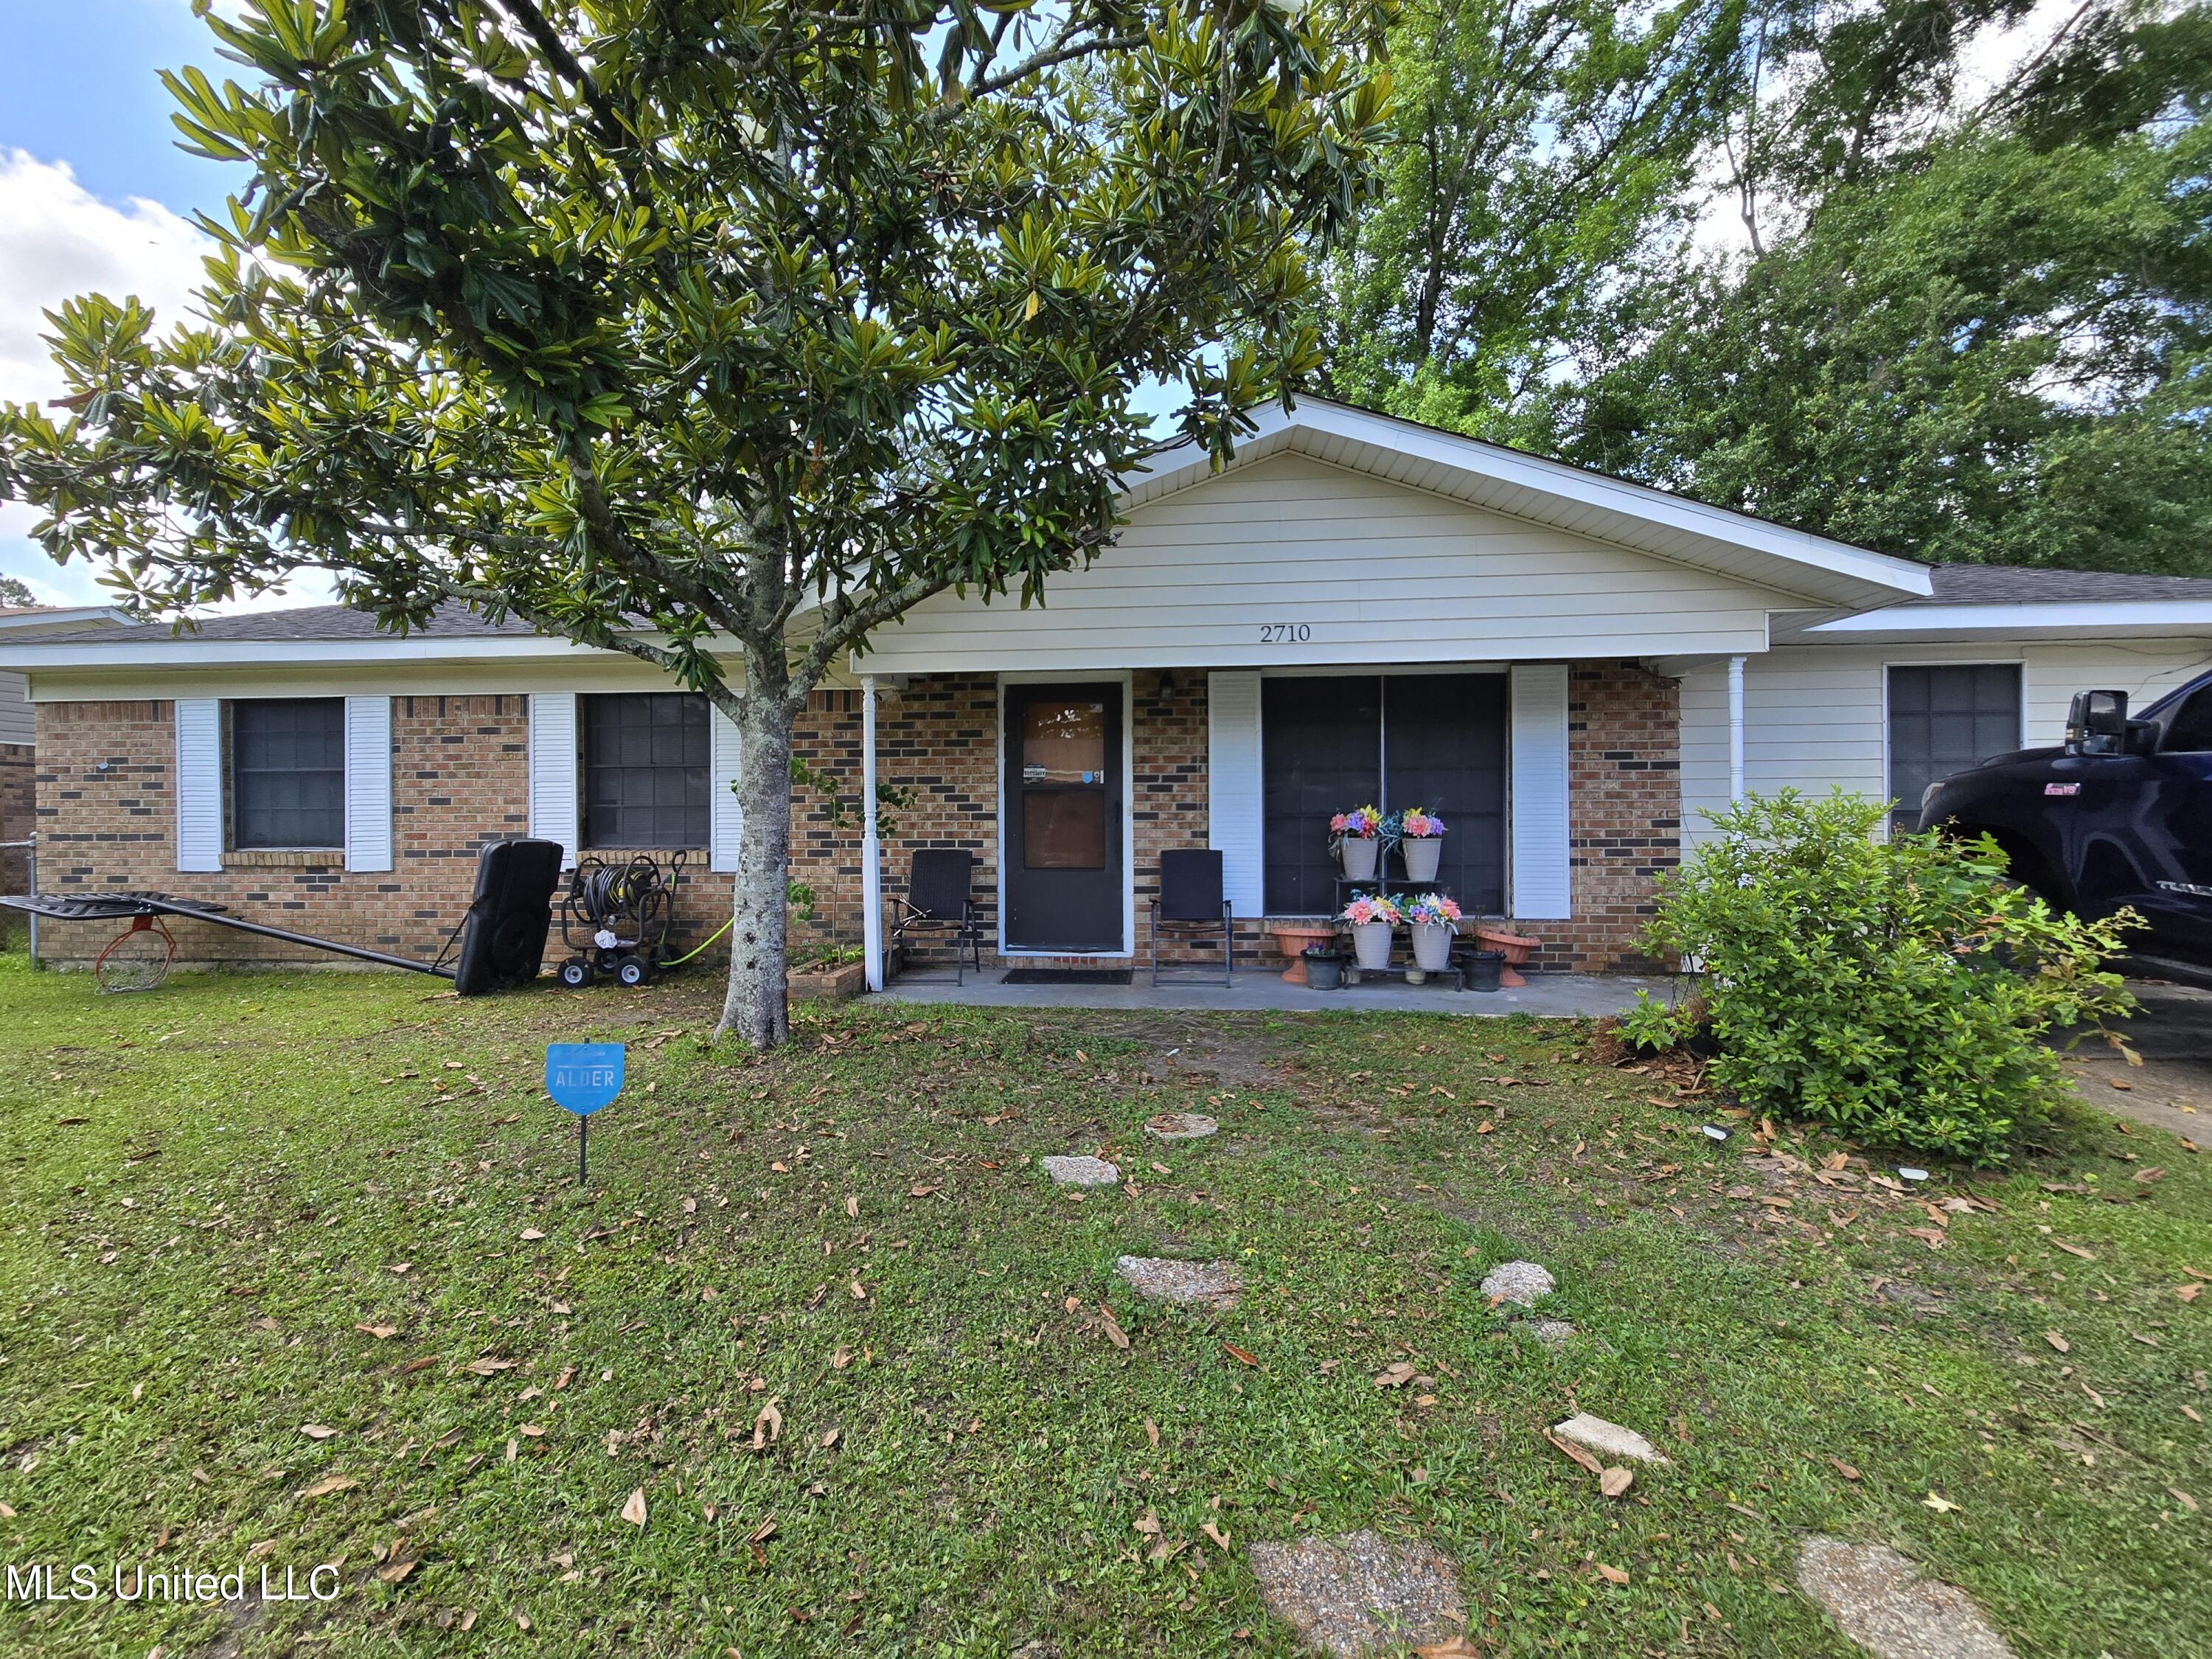
Active
$147,000
3
bds
|
2
ba
|
0
sqft
|
built
1972
2710 E Angela Cir, Gulfport, MS 39503
$460
Cash flow
16.3%
Cash-on-Cash Return
9.4%
Cap rate
1.2%
Rent to Value Ratio
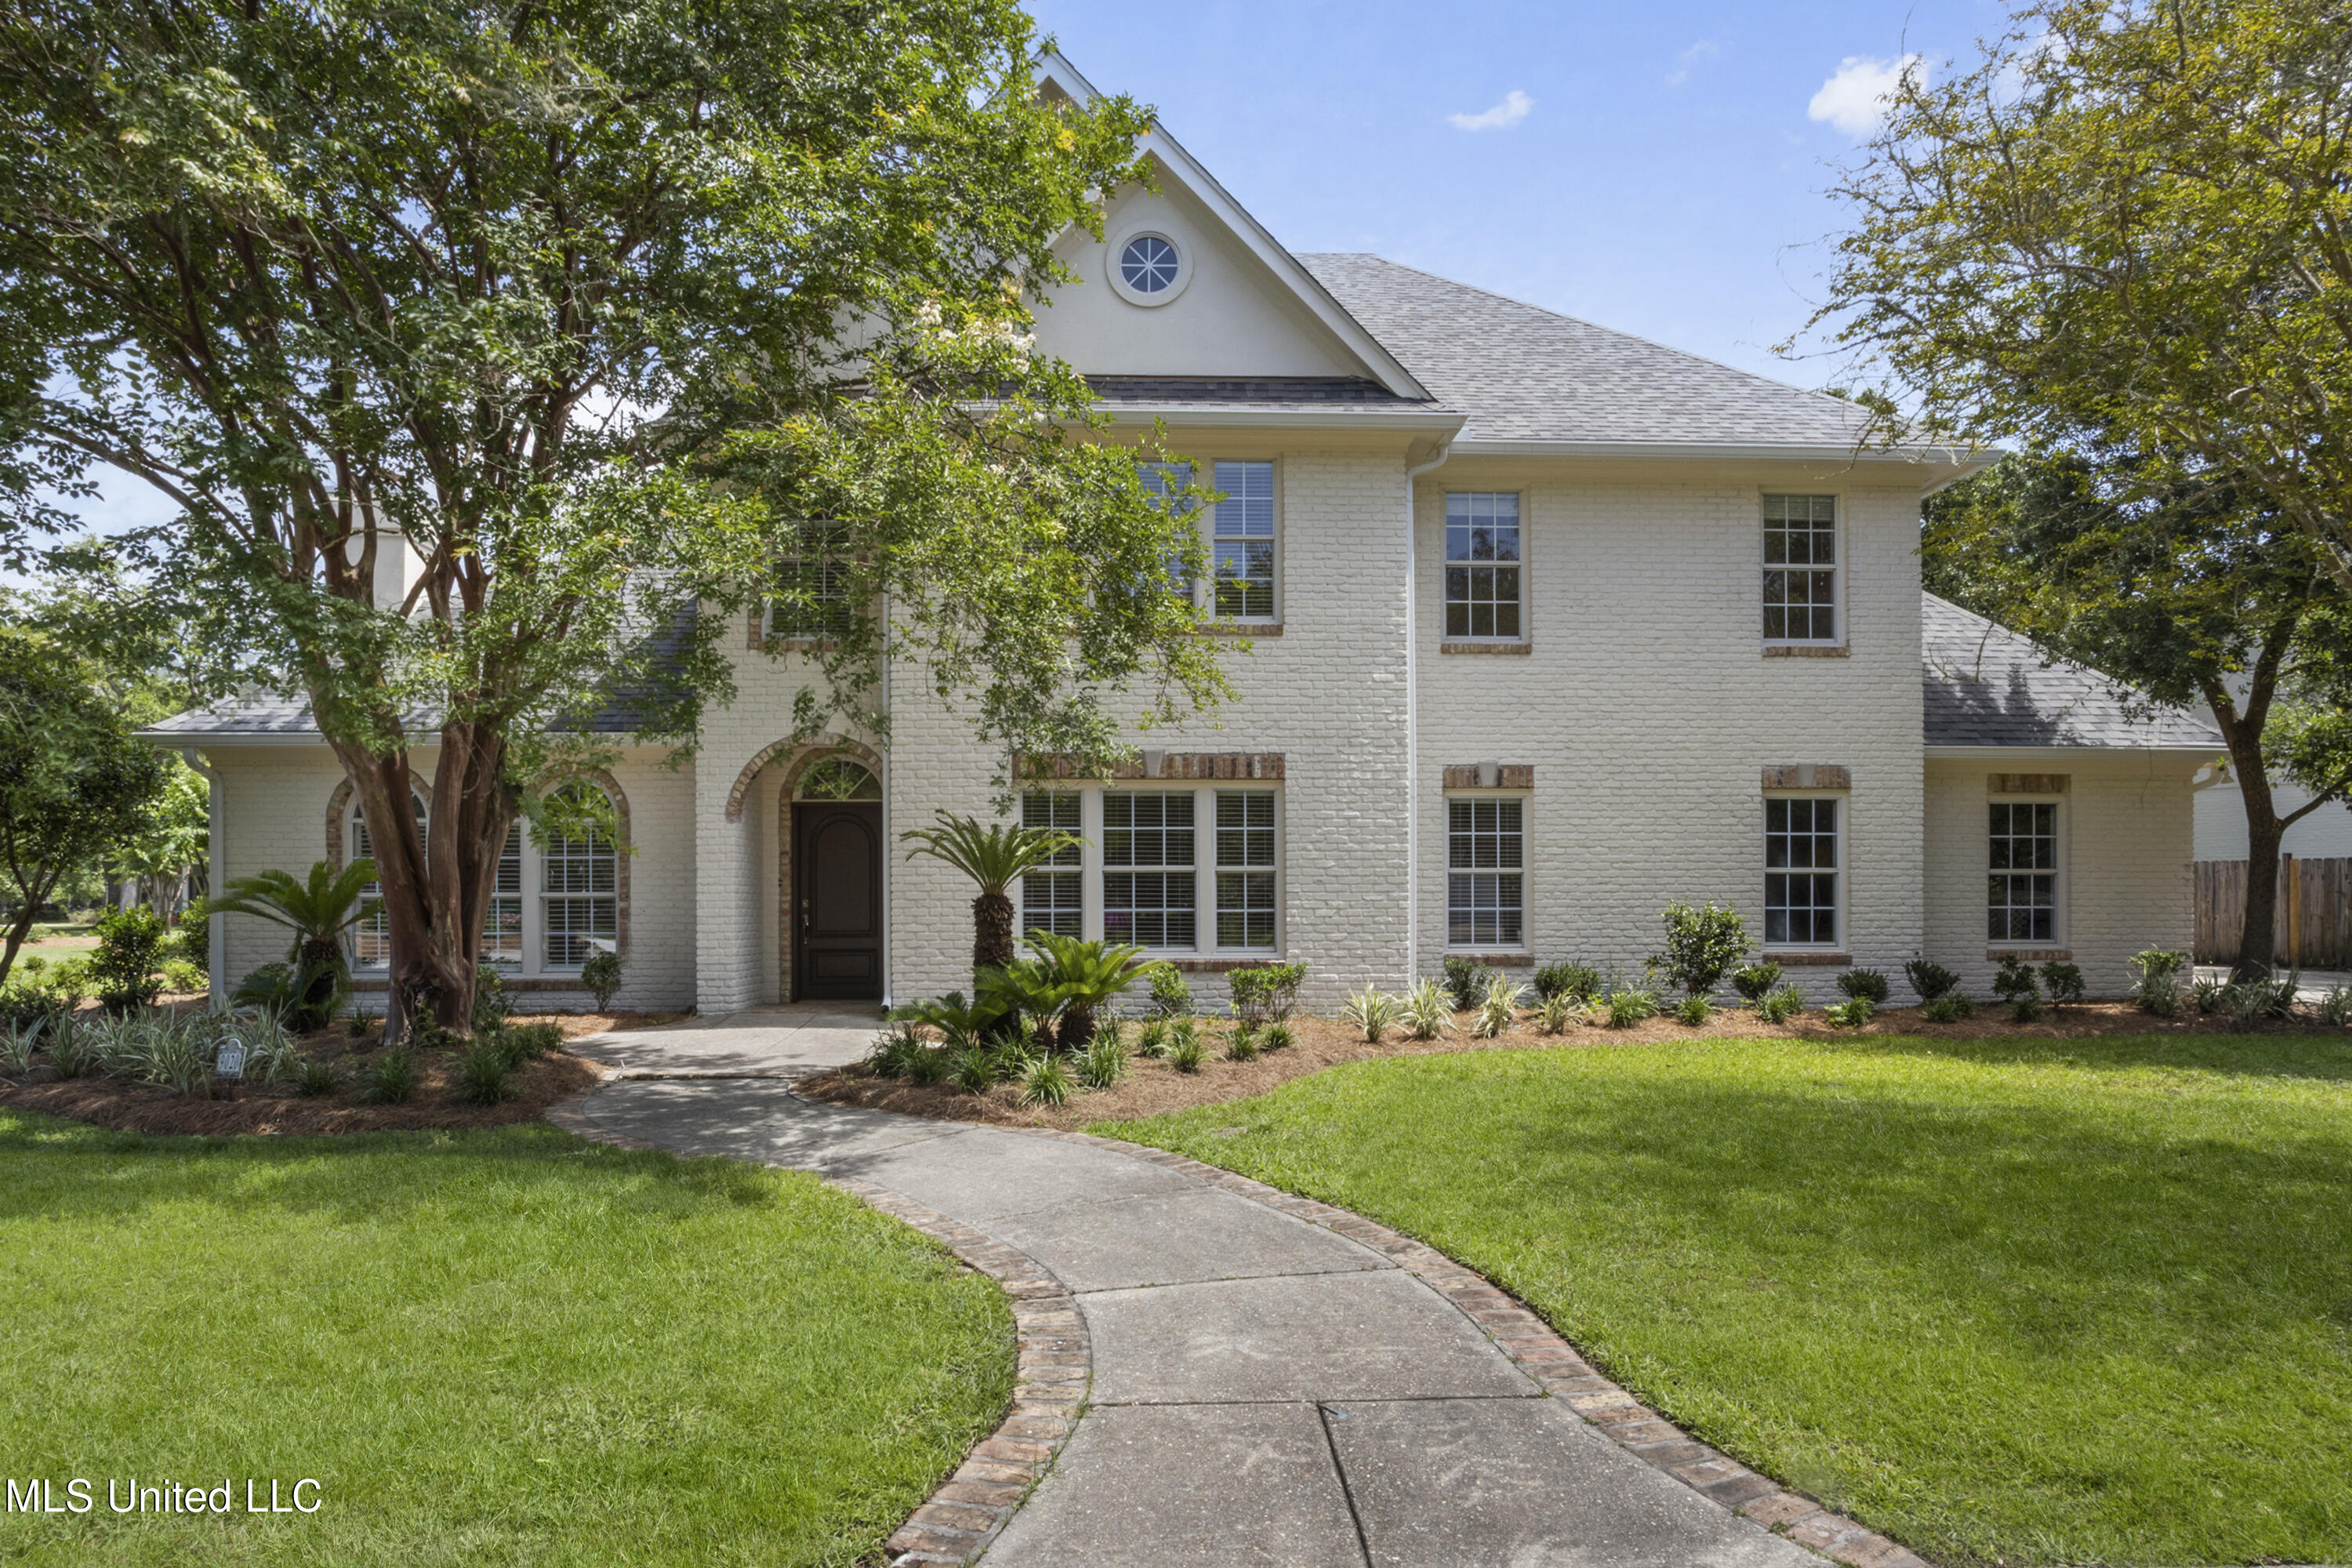
Active
$685,000
4
bds
|
4
ba
|
0
sqft
|
built
1996
9020 Victoria Cir, Gulfport, MS 39503
$-1,838
Cash flow
-14.0%
Cash-on-Cash Return
2.5%
Cap rate
0.5%
Rent to Value Ratio
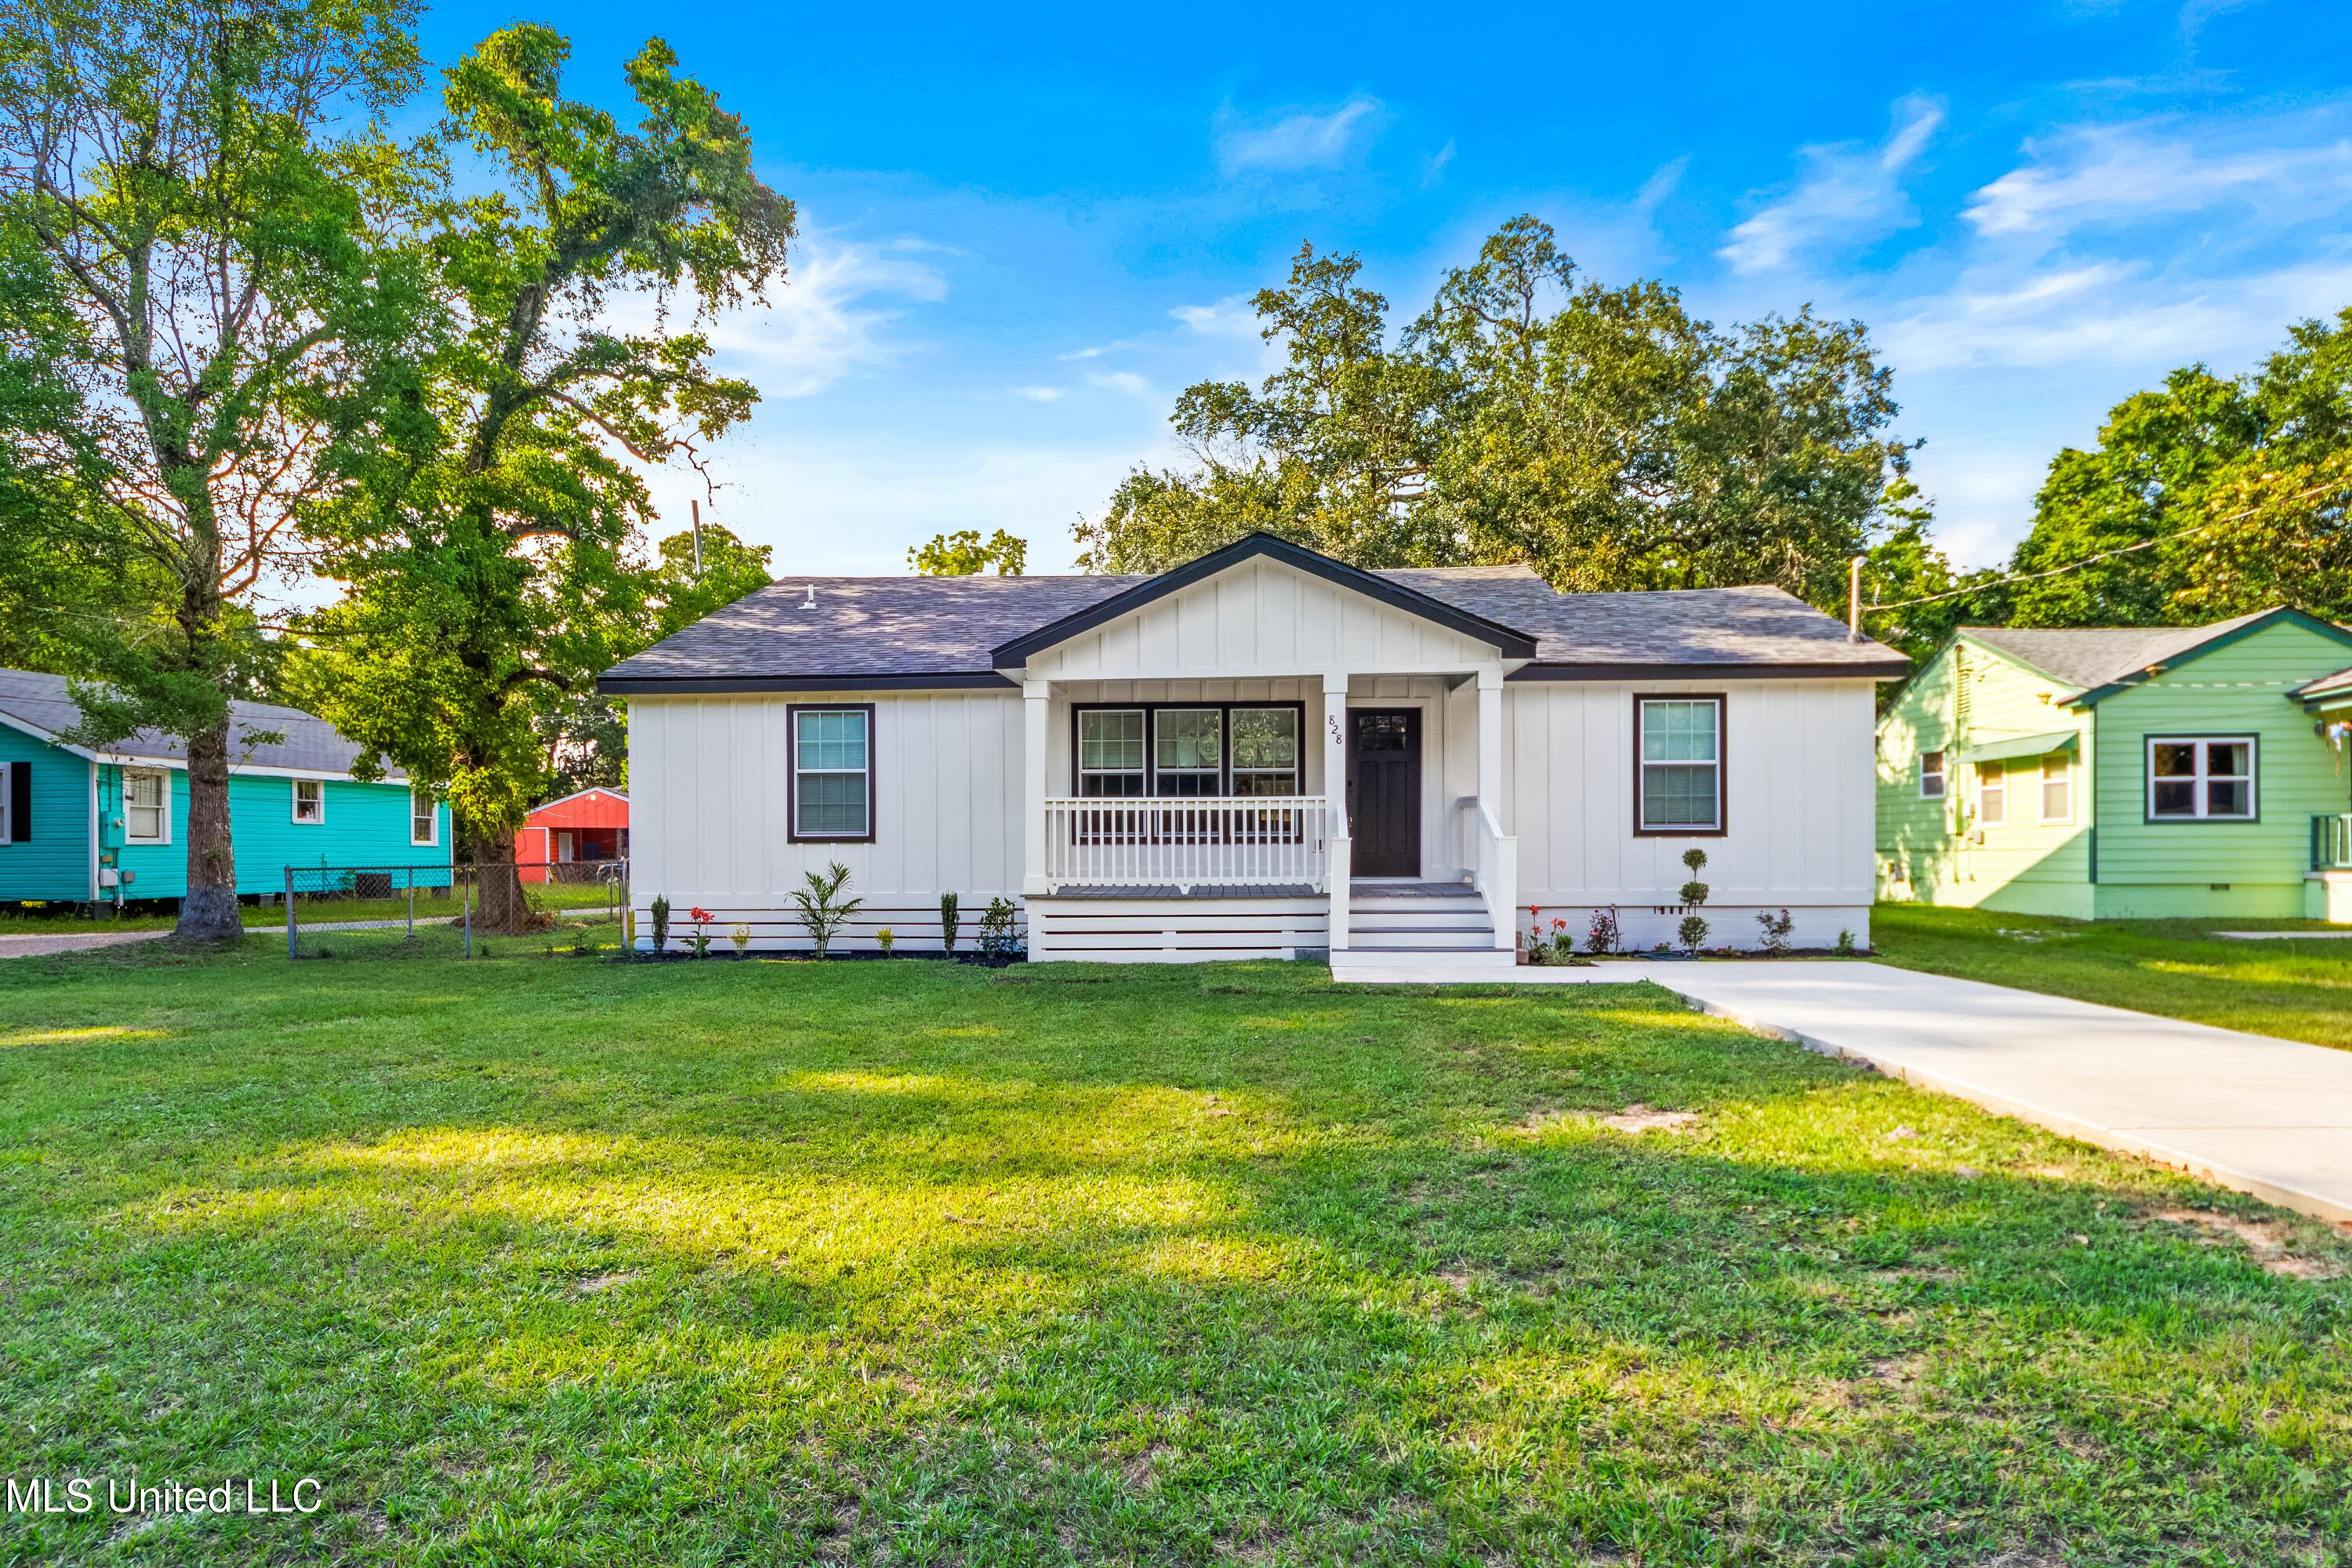
Active
$259,900
4
bds
|
3
ba
|
0
sqft
|
built
1945
828 24th St, Gulfport, MS 39501
$-179
Cash flow
-3.6%
Cash-on-Cash Return
4.9%
Cap rate
0.6%
Rent to Value Ratio
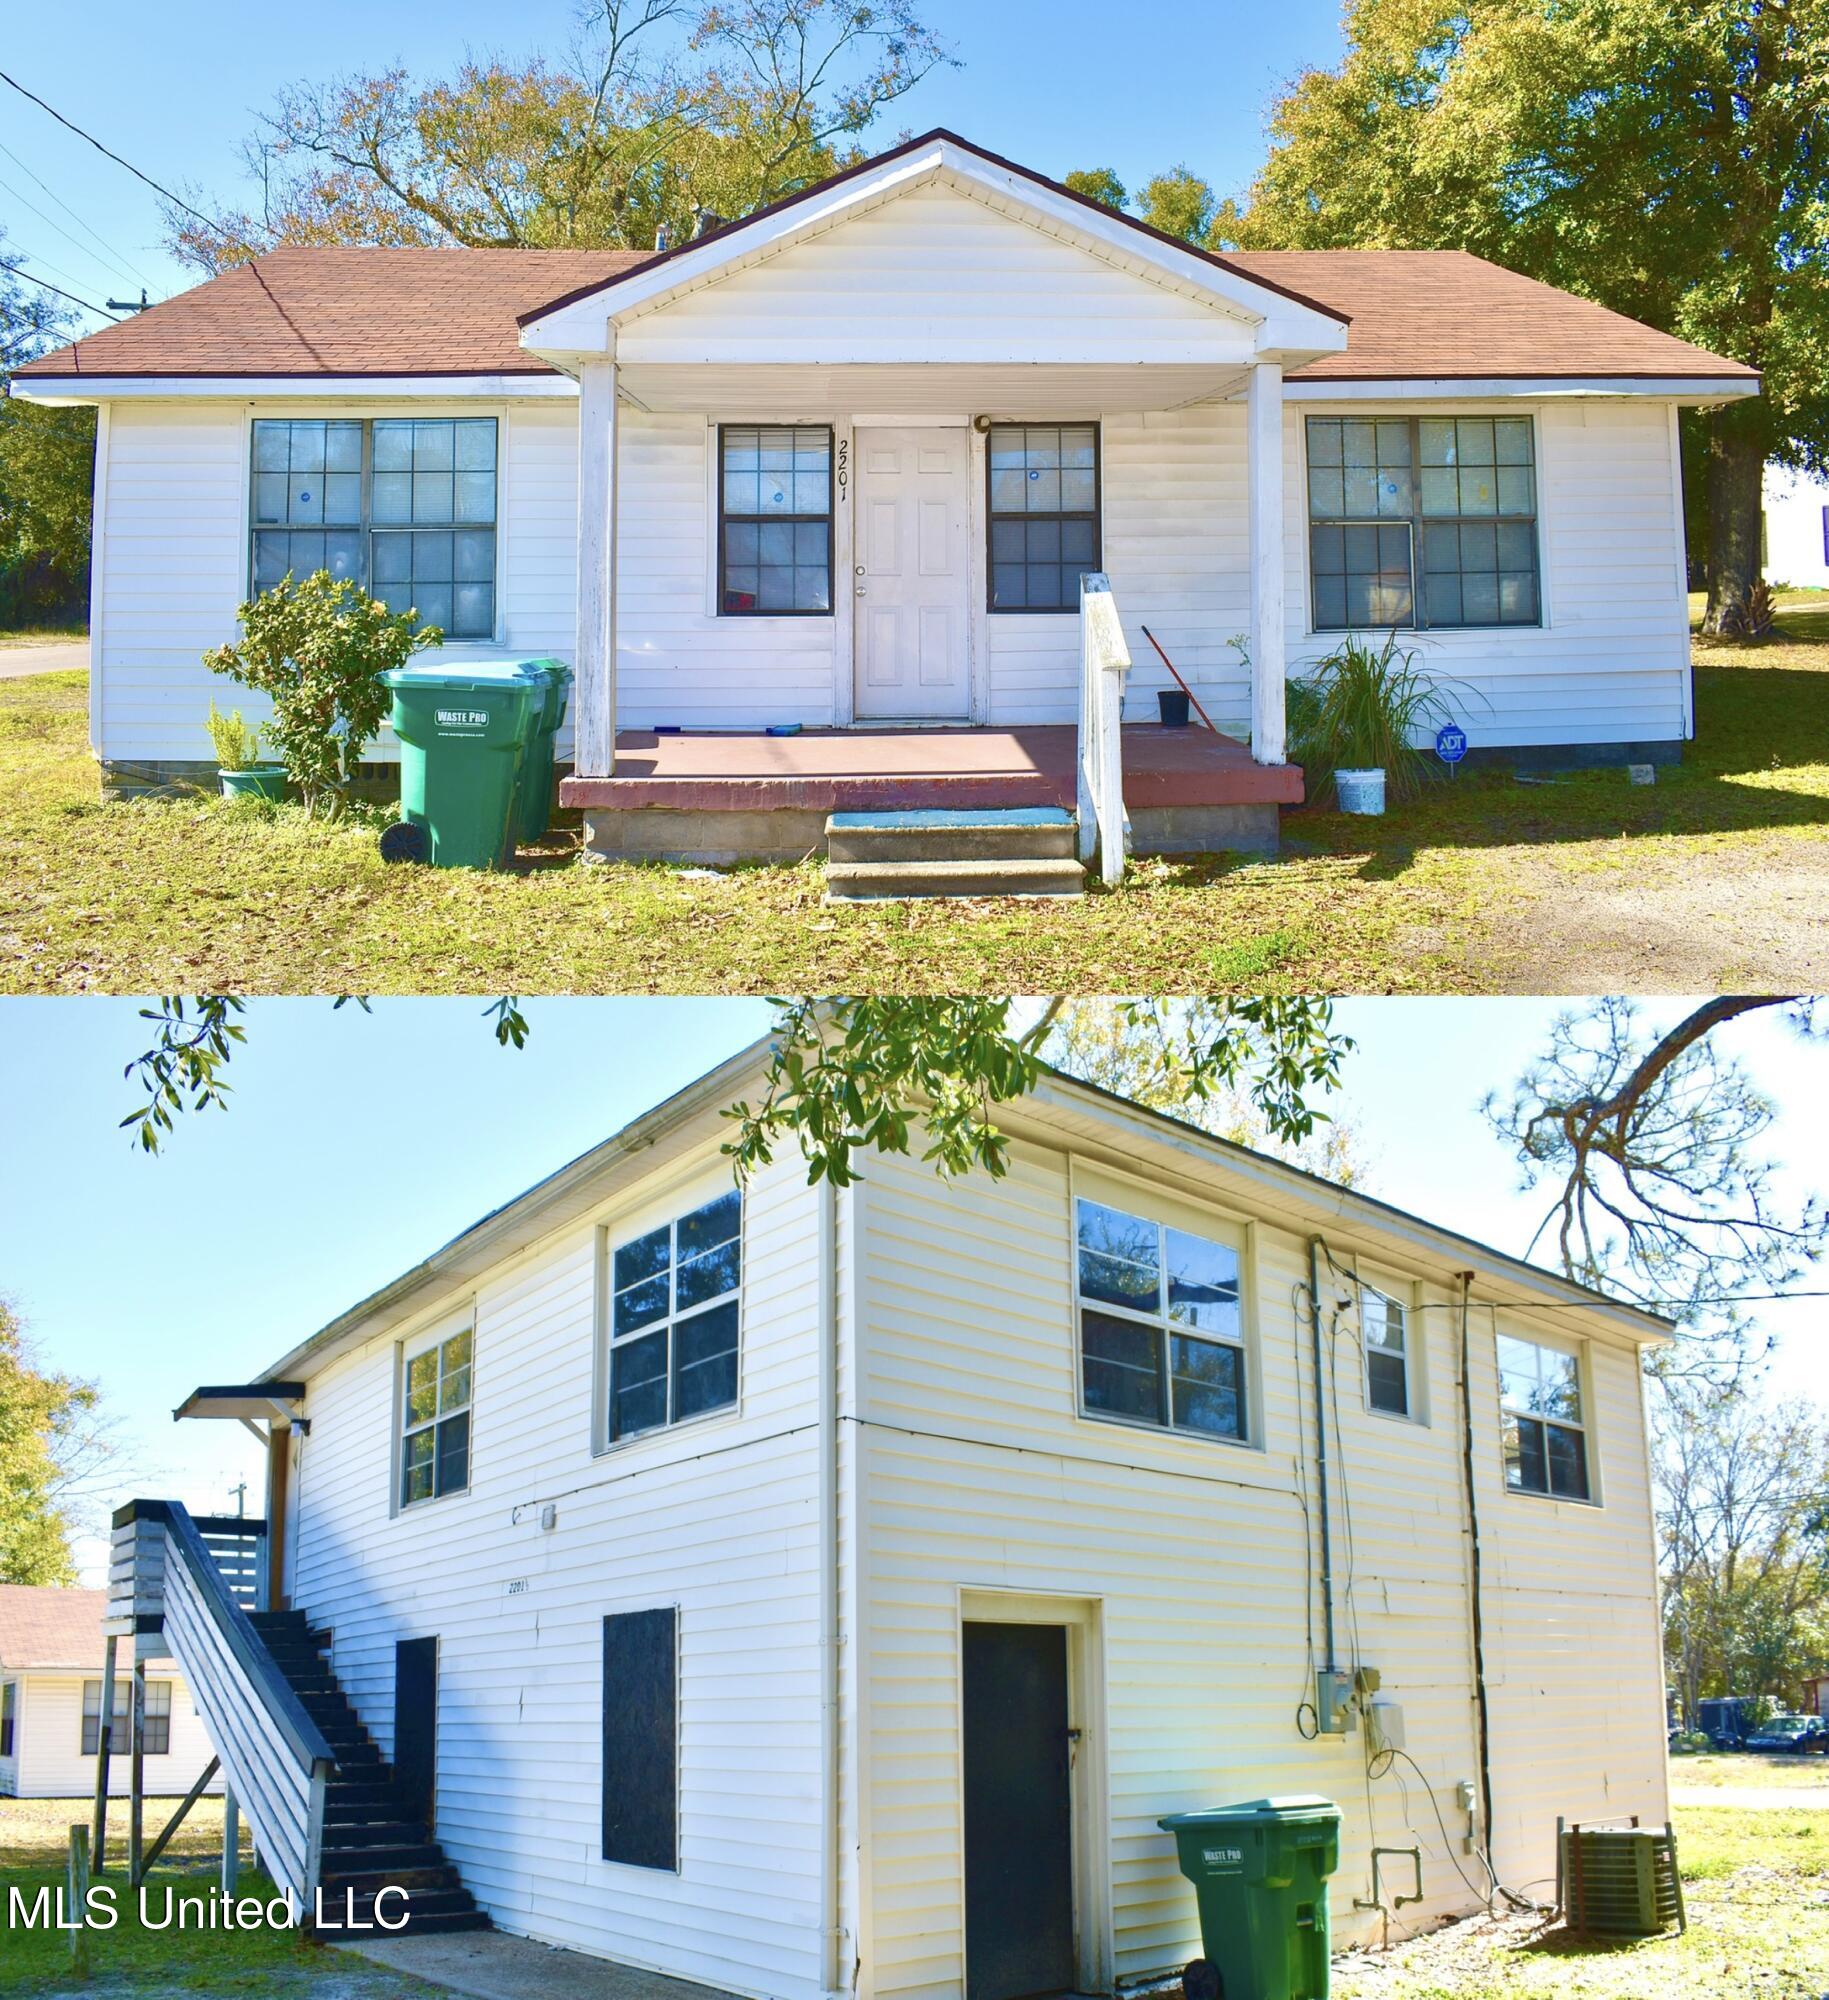
Active
$200,000
3
bds
|
1
ba
|
0
sqft
|
built
1940
2201 15th Ave, Gulfport, MS 39501
$-21
Cash flow
-0.5%
Cash-on-Cash Return
5.6%
Cap rate
0.8%
Rent to Value Ratio
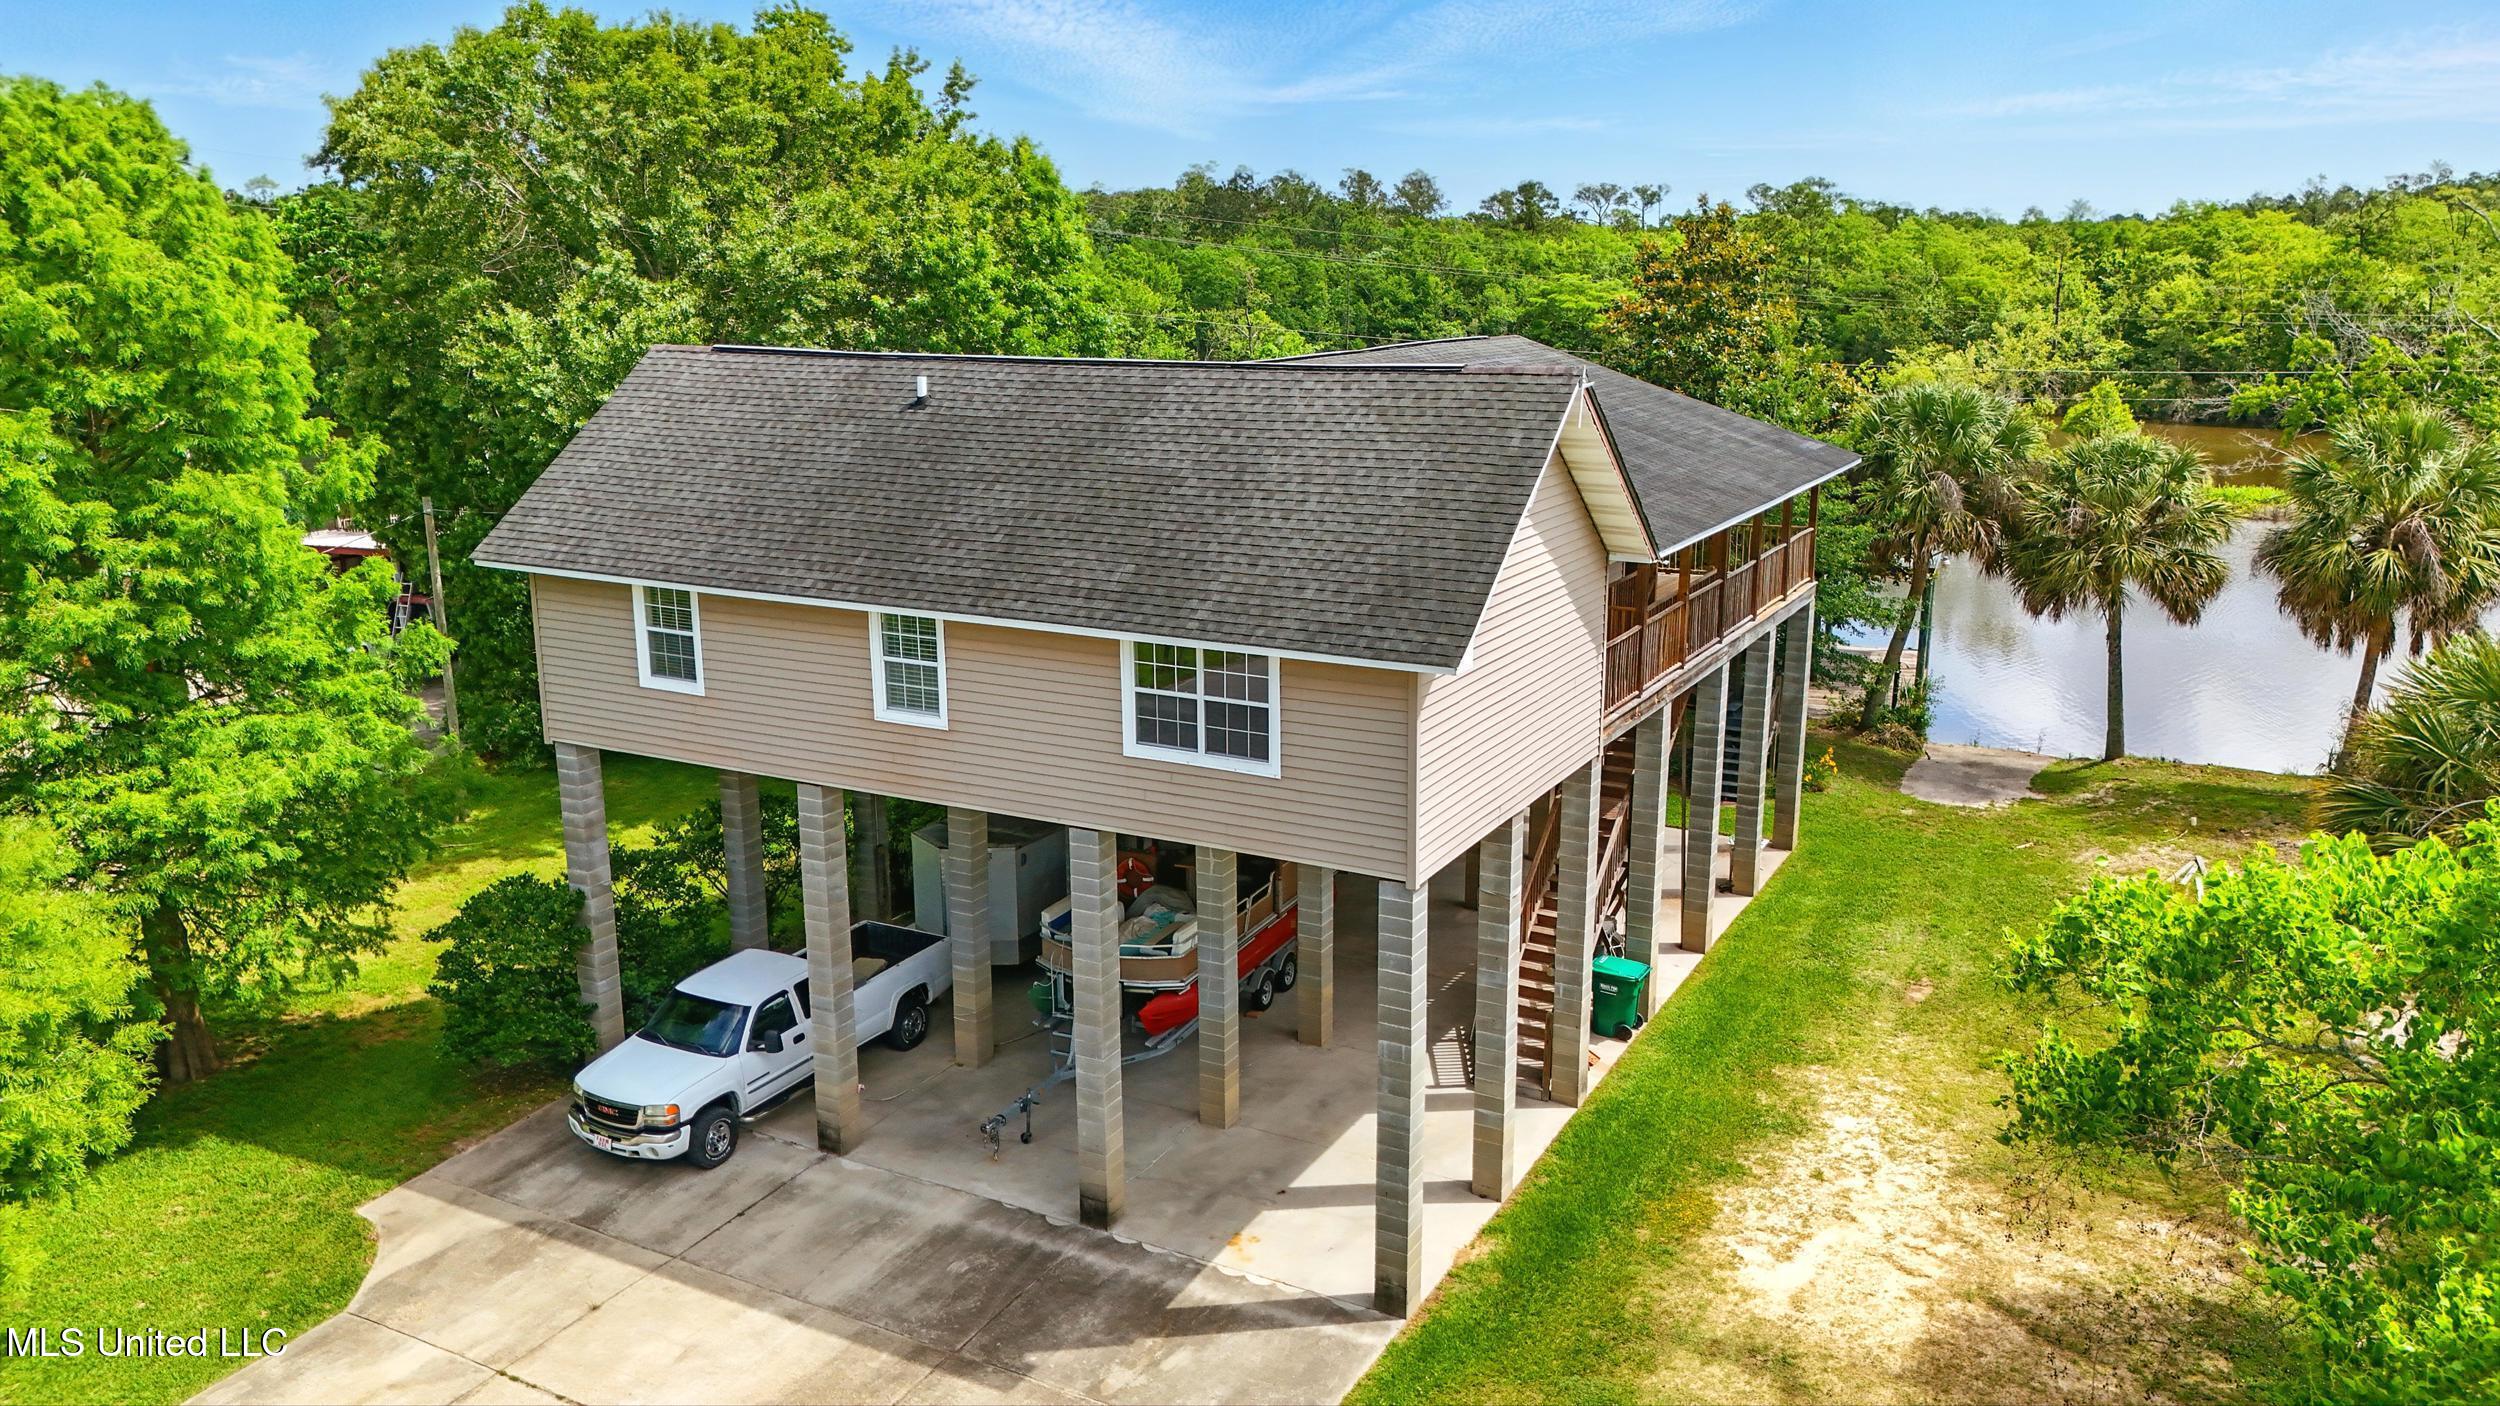
Active
$435,000
3
bds
|
2
ba
|
0
sqft
|
built
2005
10264 Riverroad Dr, Gulfport, MS 39503
$-638
Cash flow
-7.7%
Cash-on-Cash Return
3.9%
Cap rate
0.5%
Rent to Value Ratio
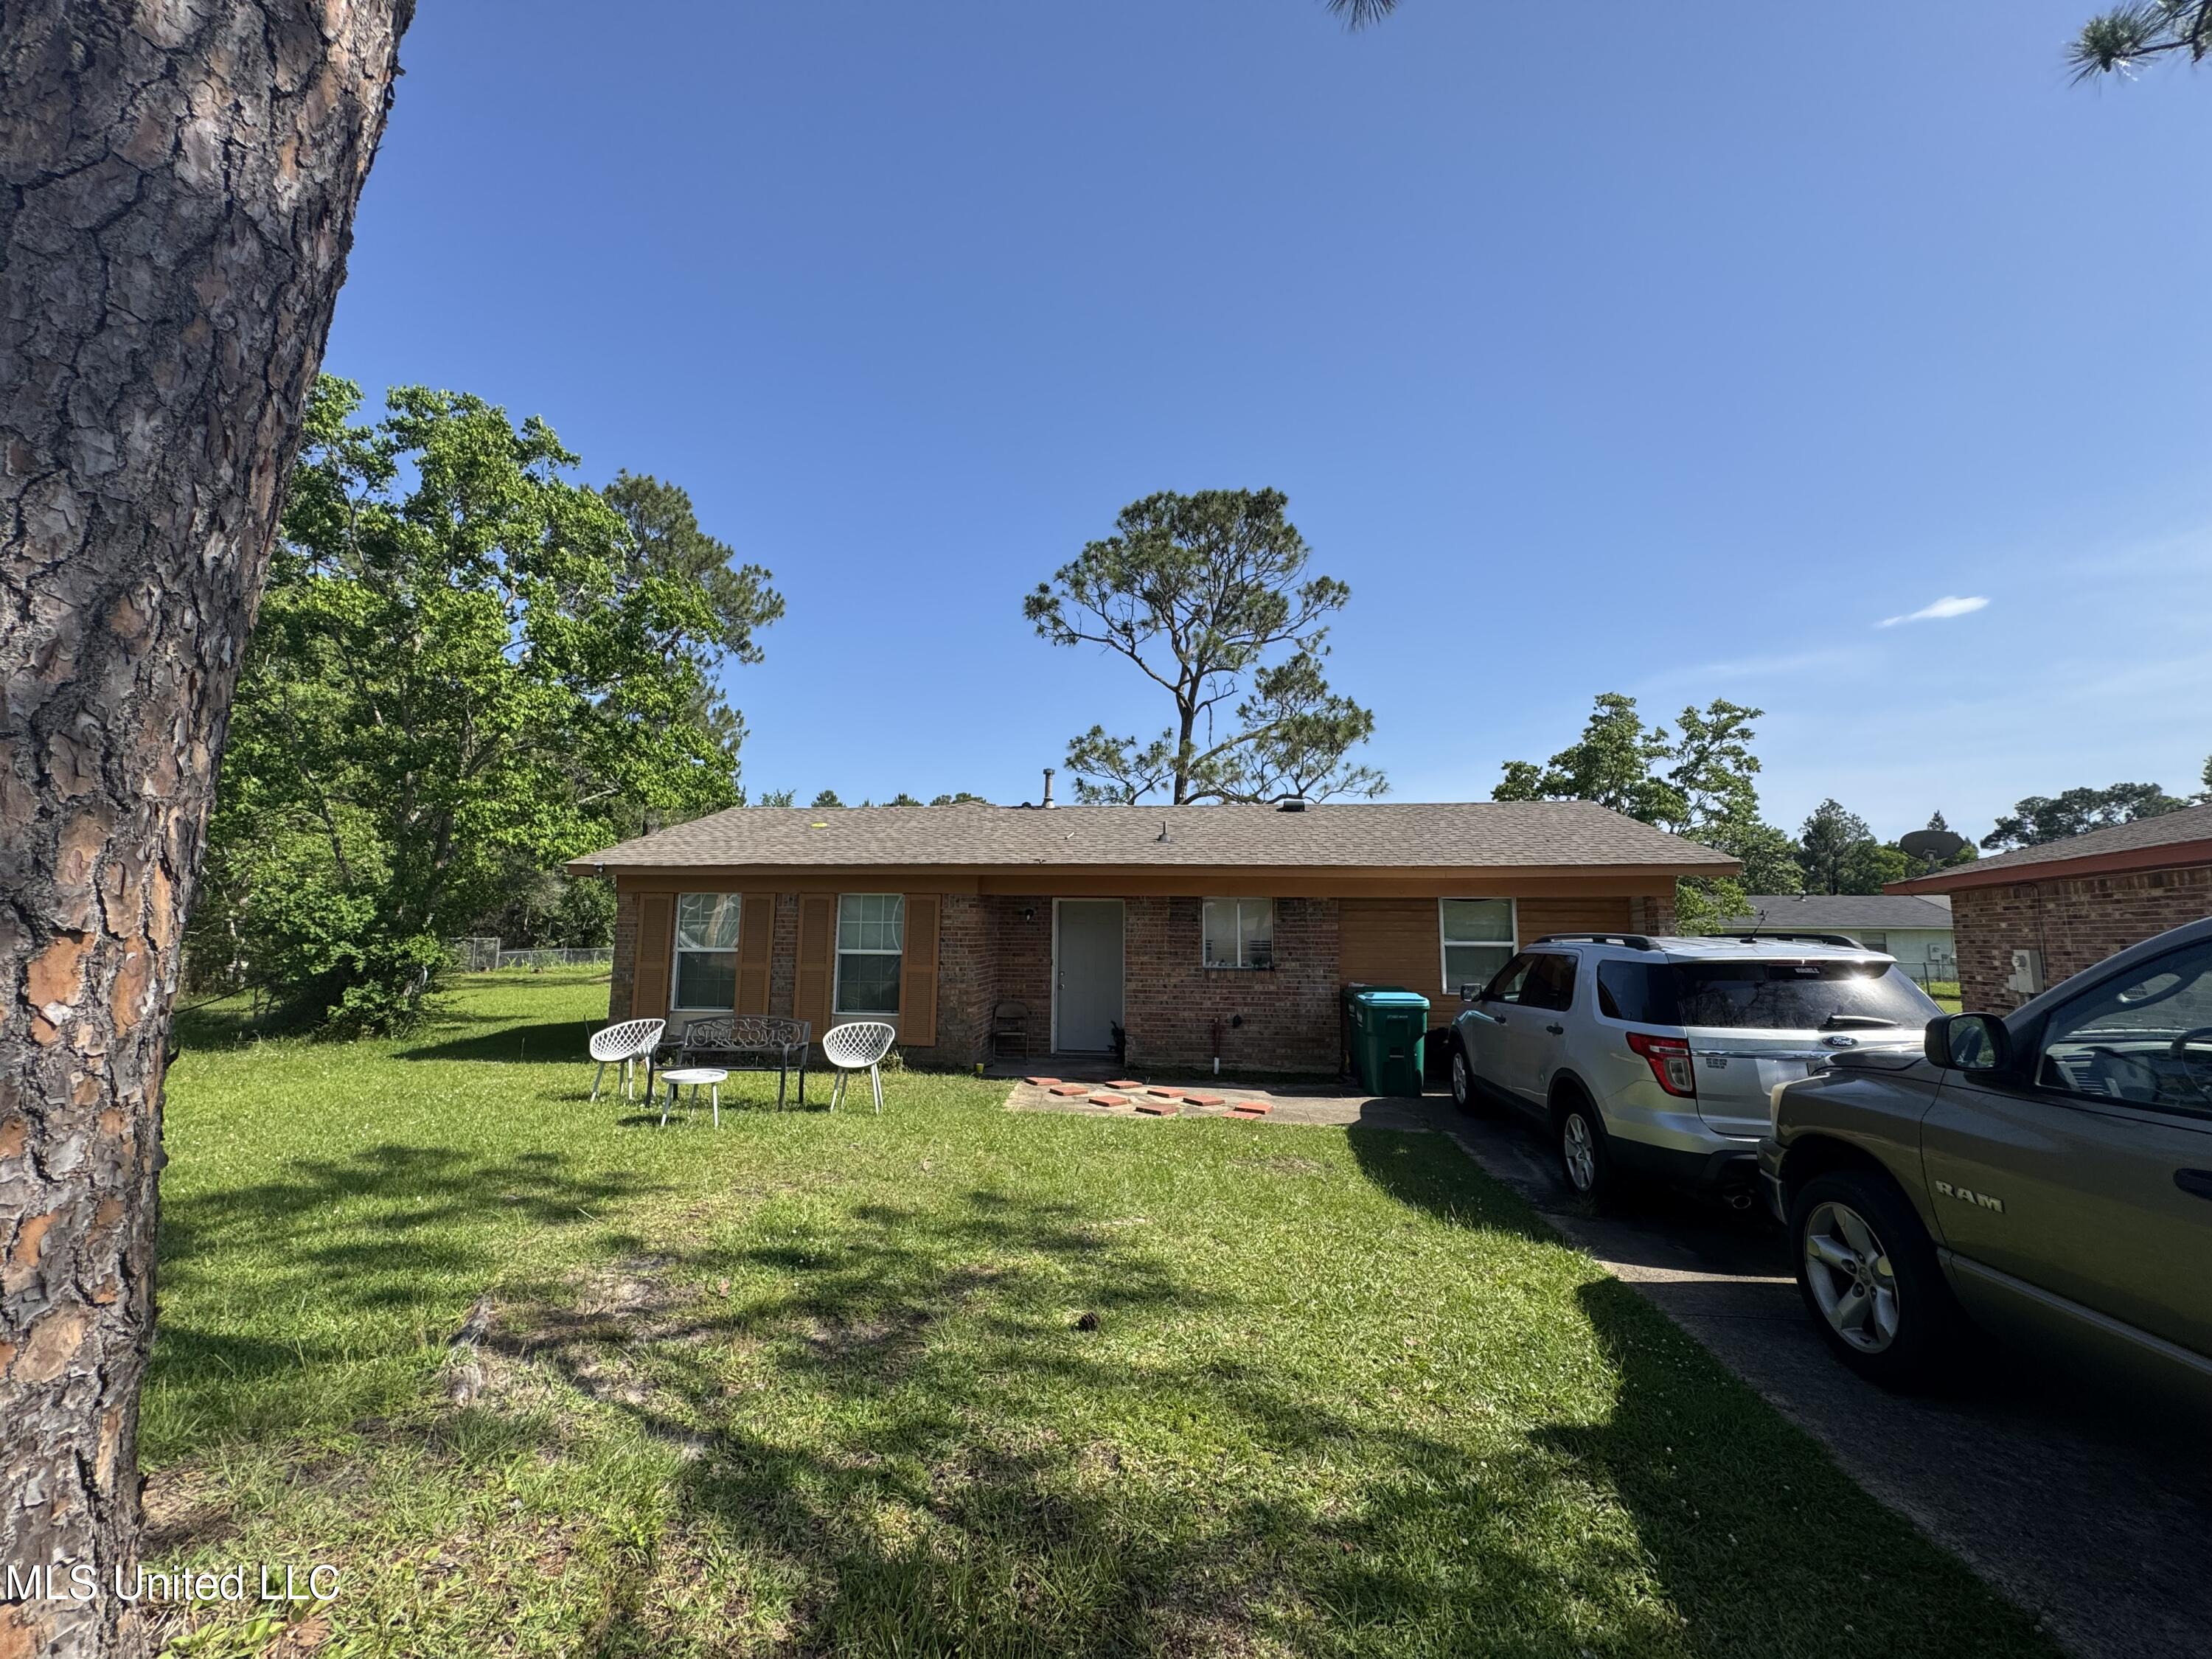
Active
$160,000
3
bds
|
2
ba
|
0
sqft
|
built
1974
2730 E Angela Cir, Gulfport, MS 39503
$278
Cash flow
9.1%
Cash-on-Cash Return
7.8%
Cap rate
0.9%
Rent to Value Ratio
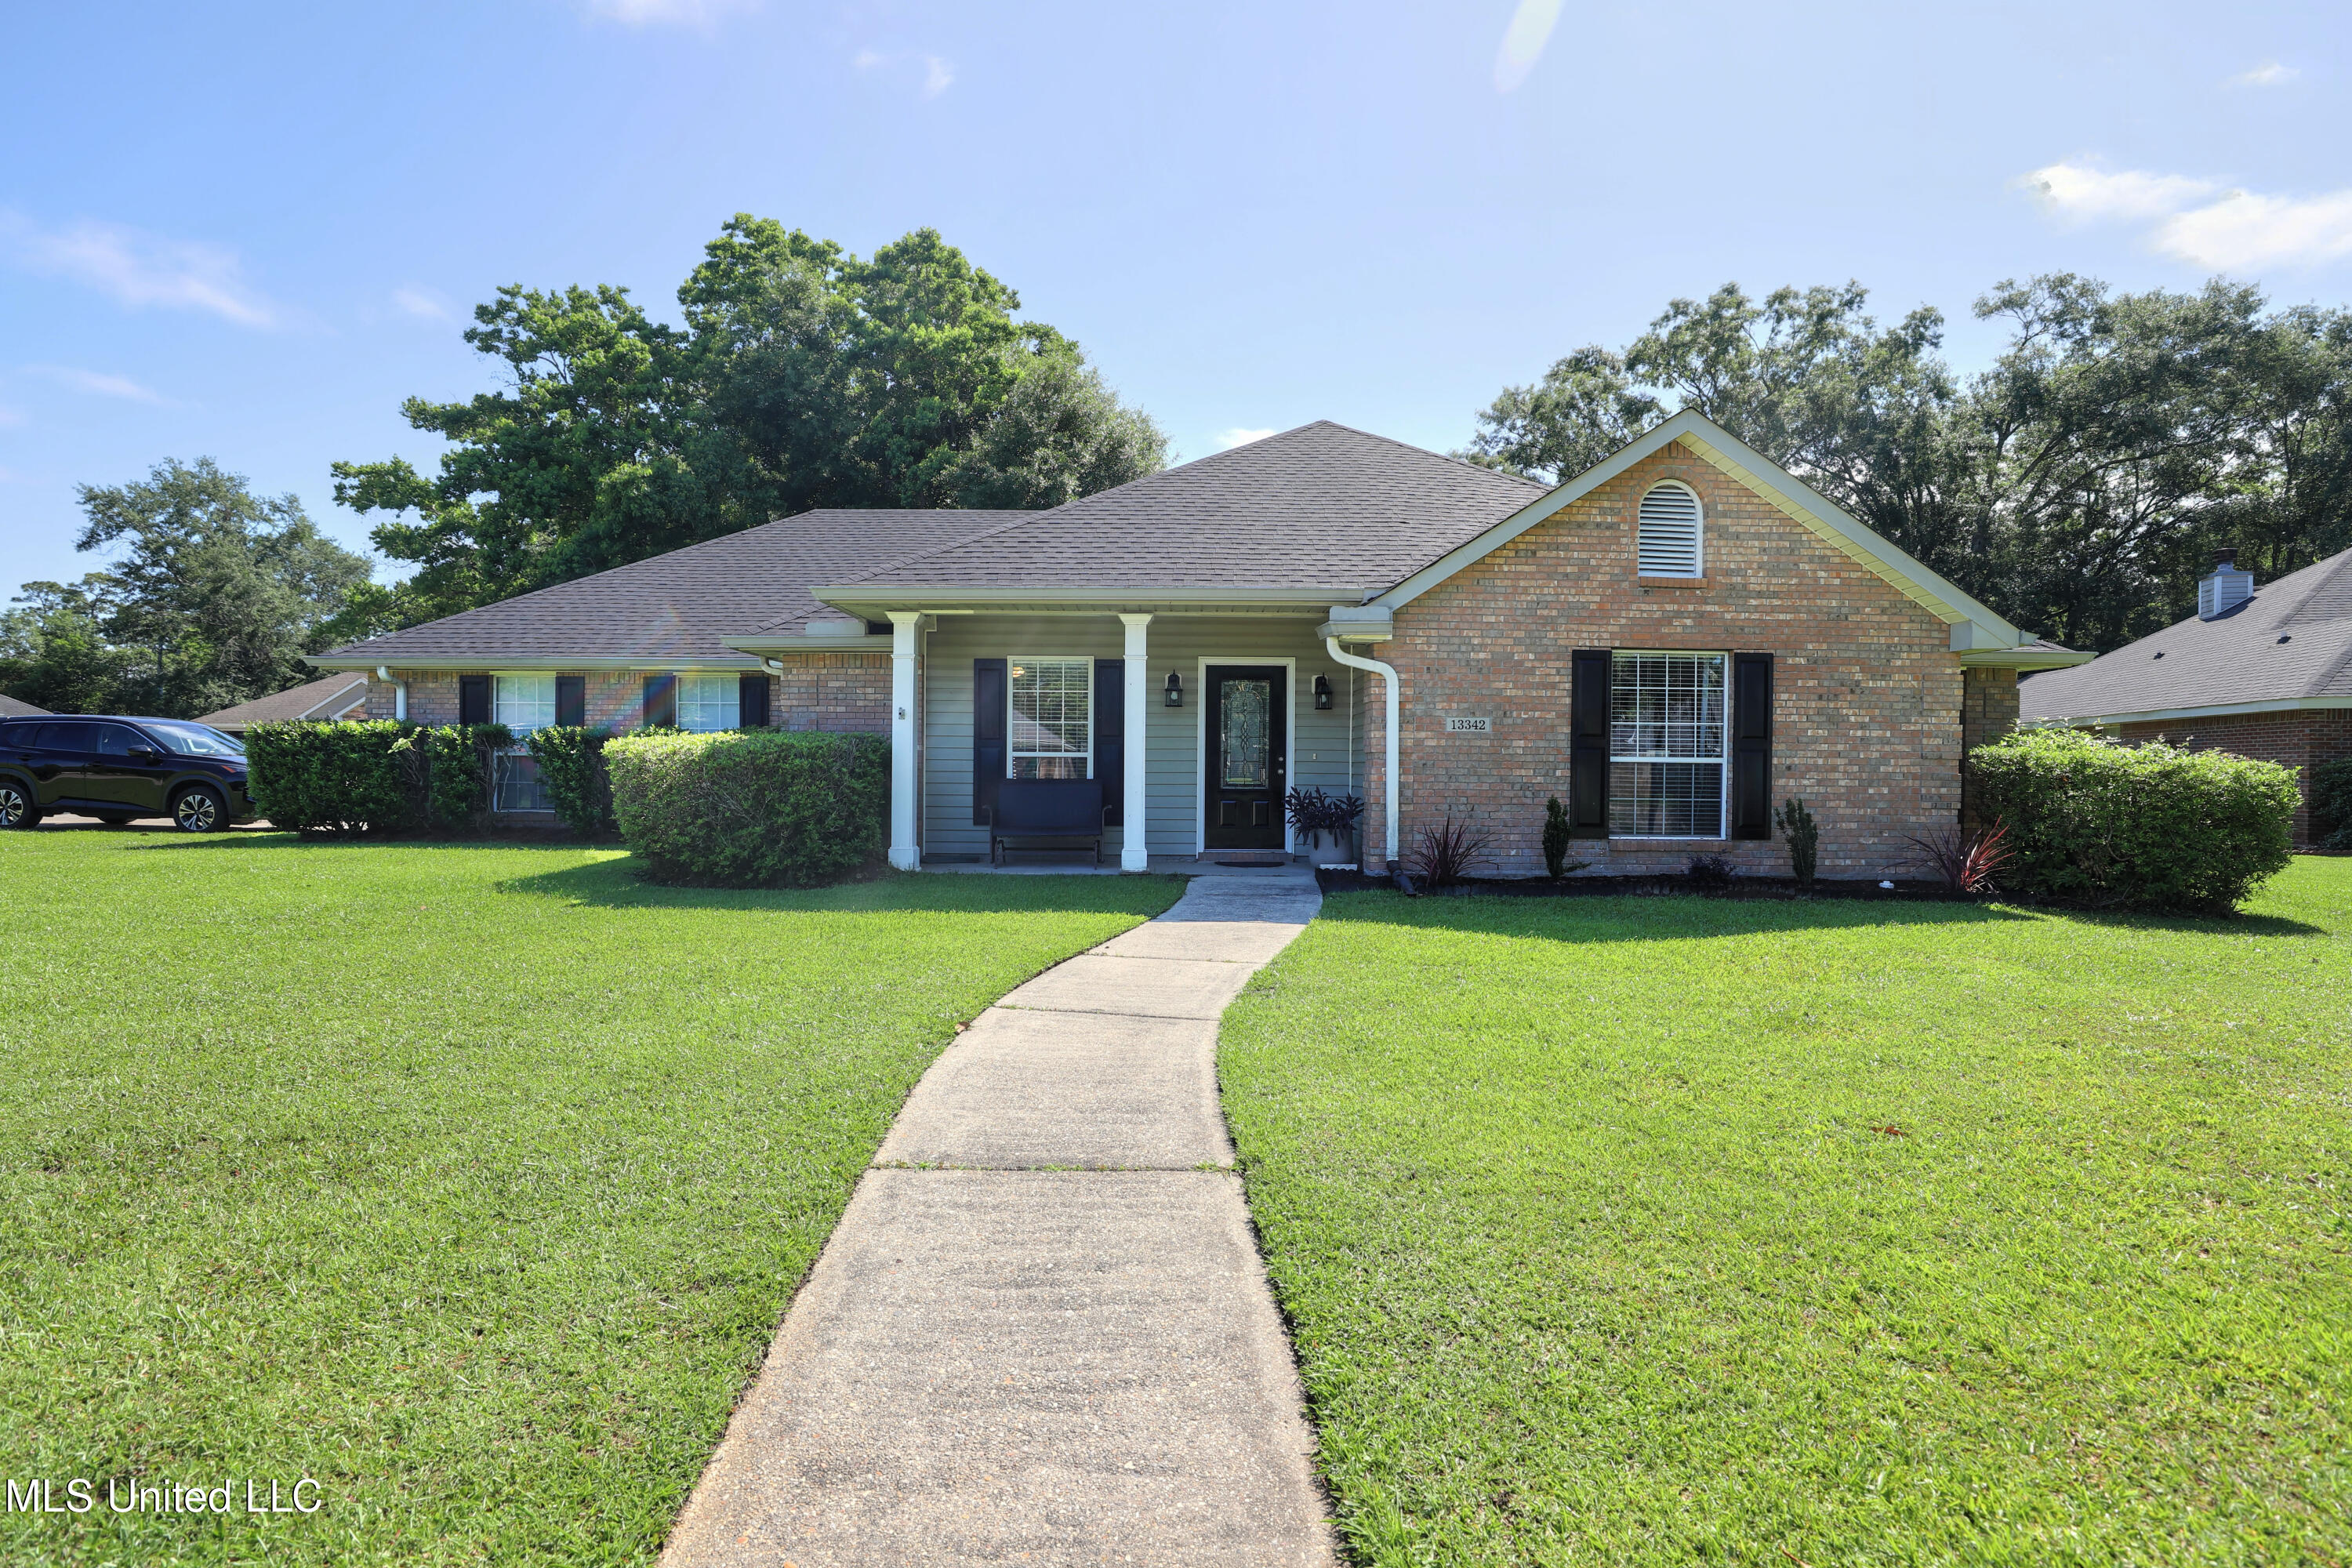
Active
$280,875
3
bds
|
2
ba
|
0
sqft
|
built
2000
13342 Carriage Cir, Gulfport, MS 39503
$-78
Cash flow
-1.4%
Cash-on-Cash Return
5.3%
Cap rate
0.7%
Rent to Value Ratio
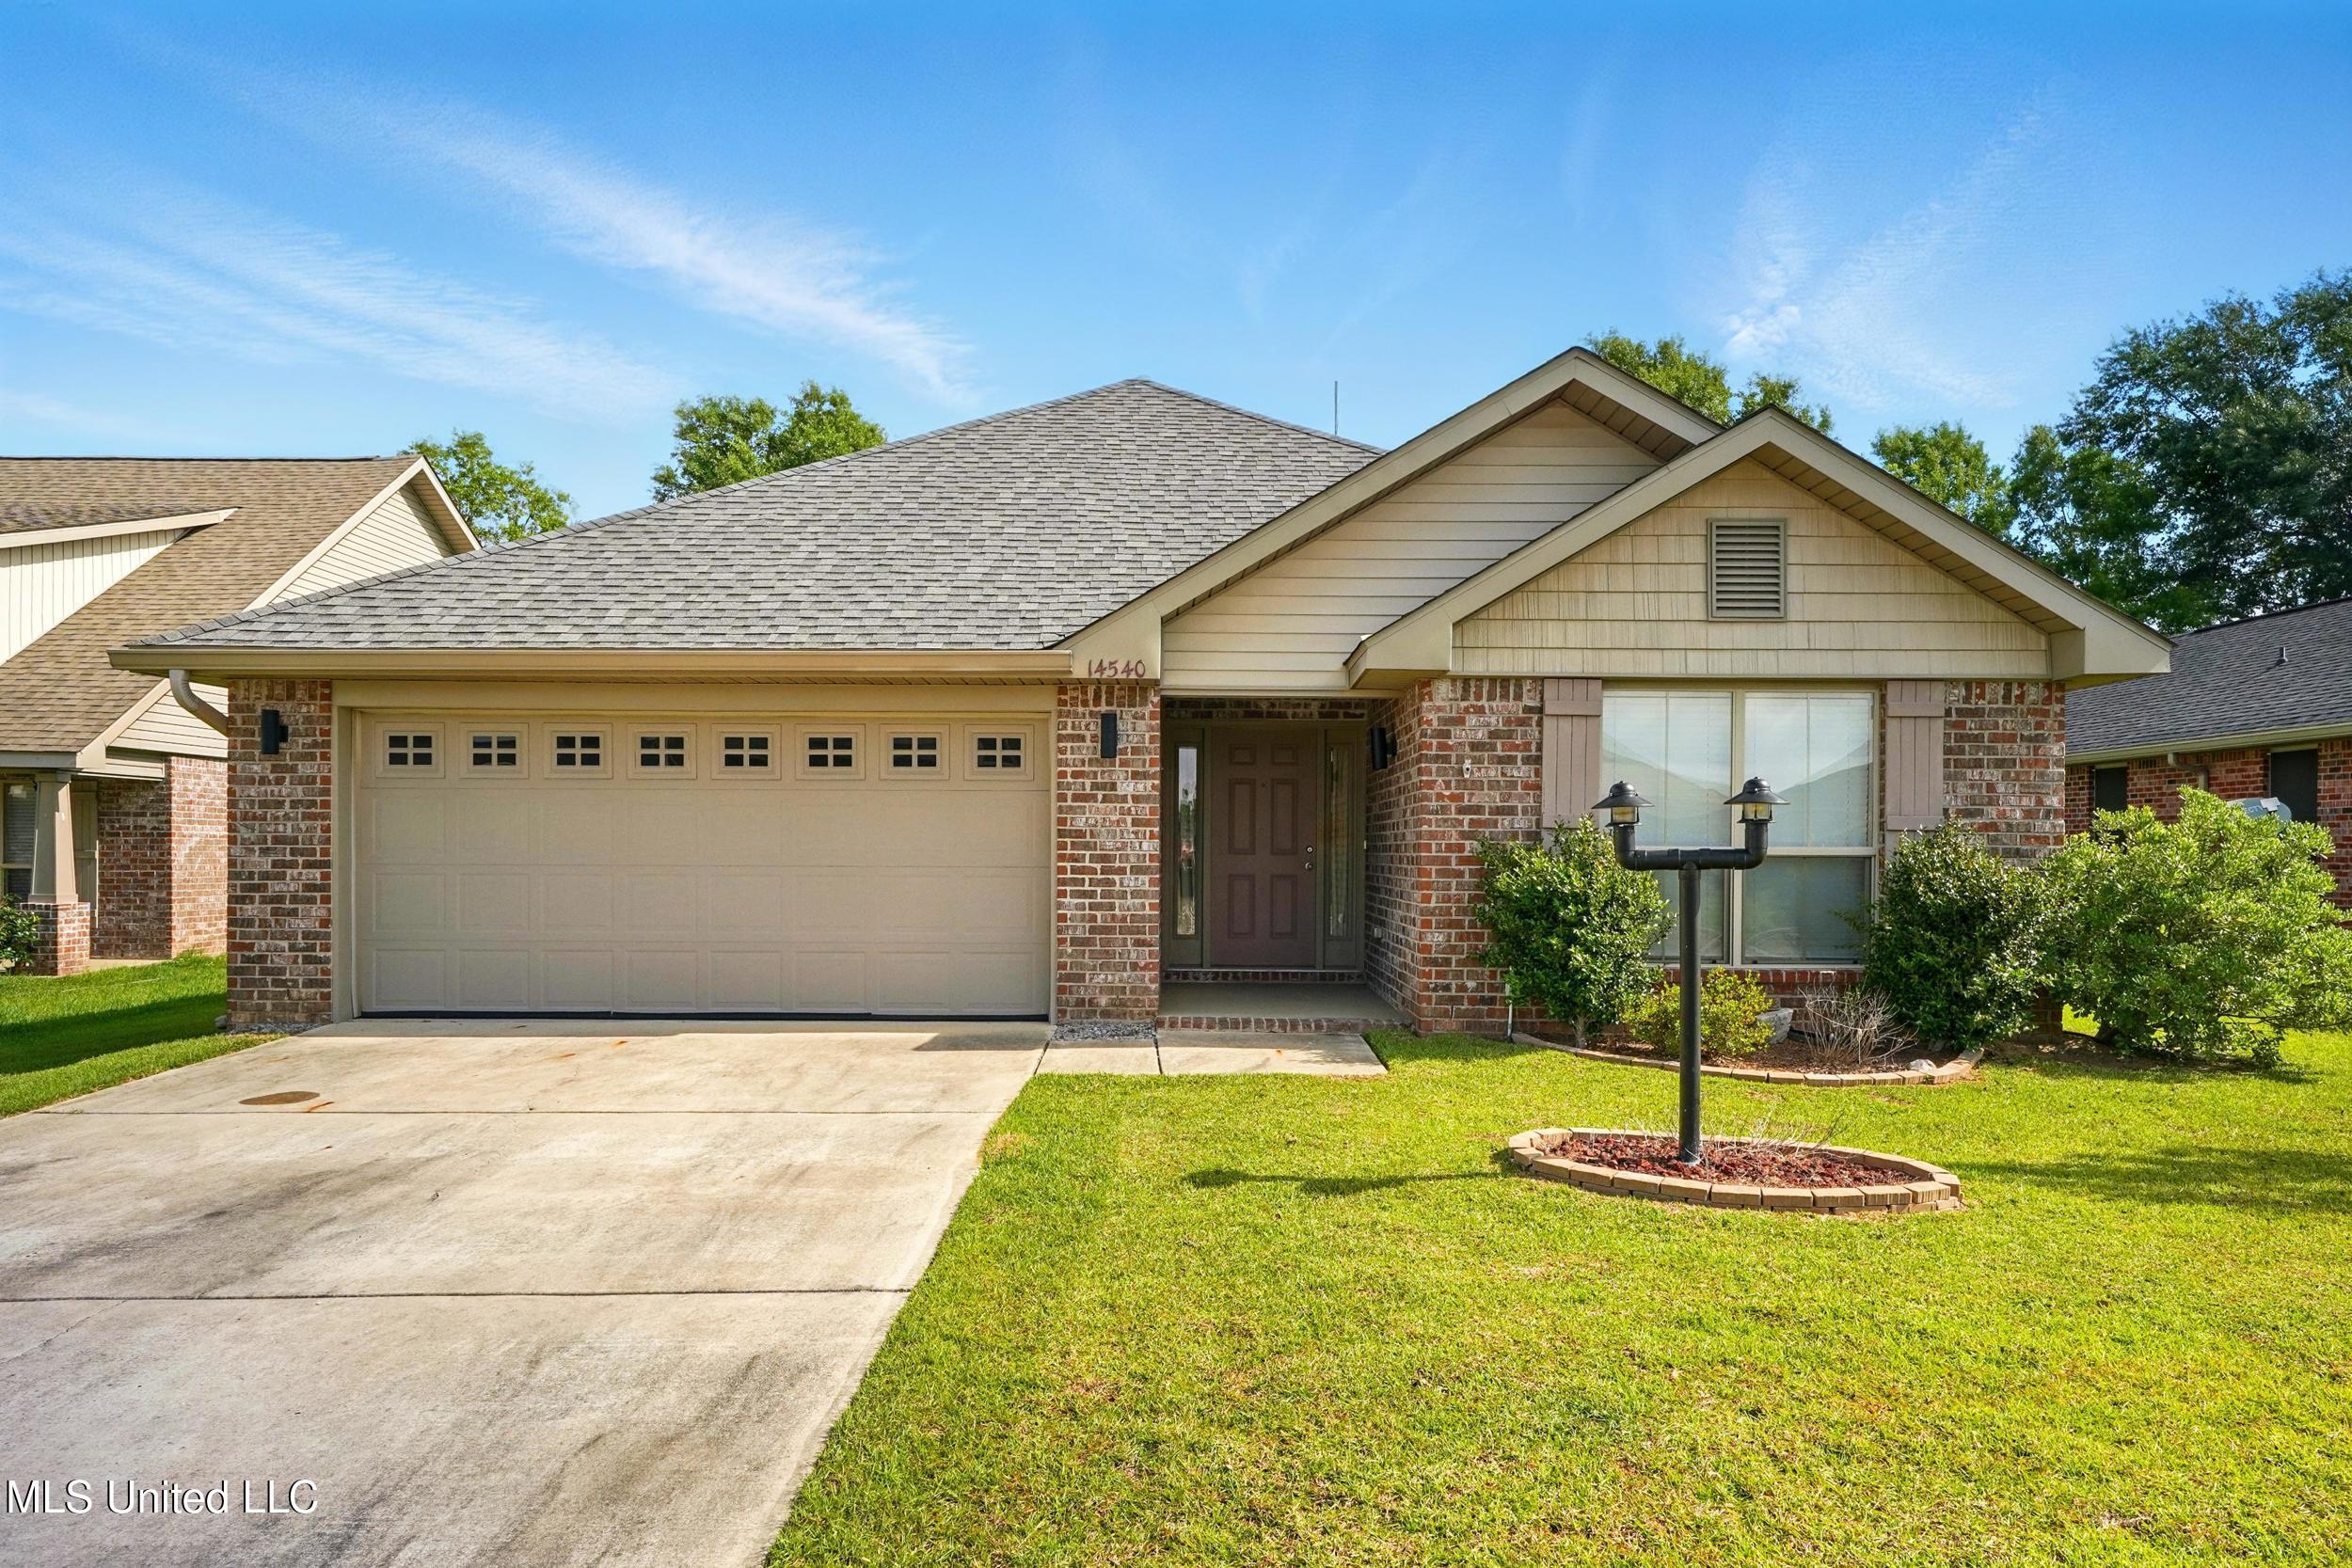
Active
$235,000
3
bds
|
2
ba
|
0
sqft
|
built
2019
14540 Canal Loop, Gulfport, MS 39503
$141
Cash flow
3.1%
Cash-on-Cash Return
6.4%
Cap rate
0.8%
Rent to Value Ratio
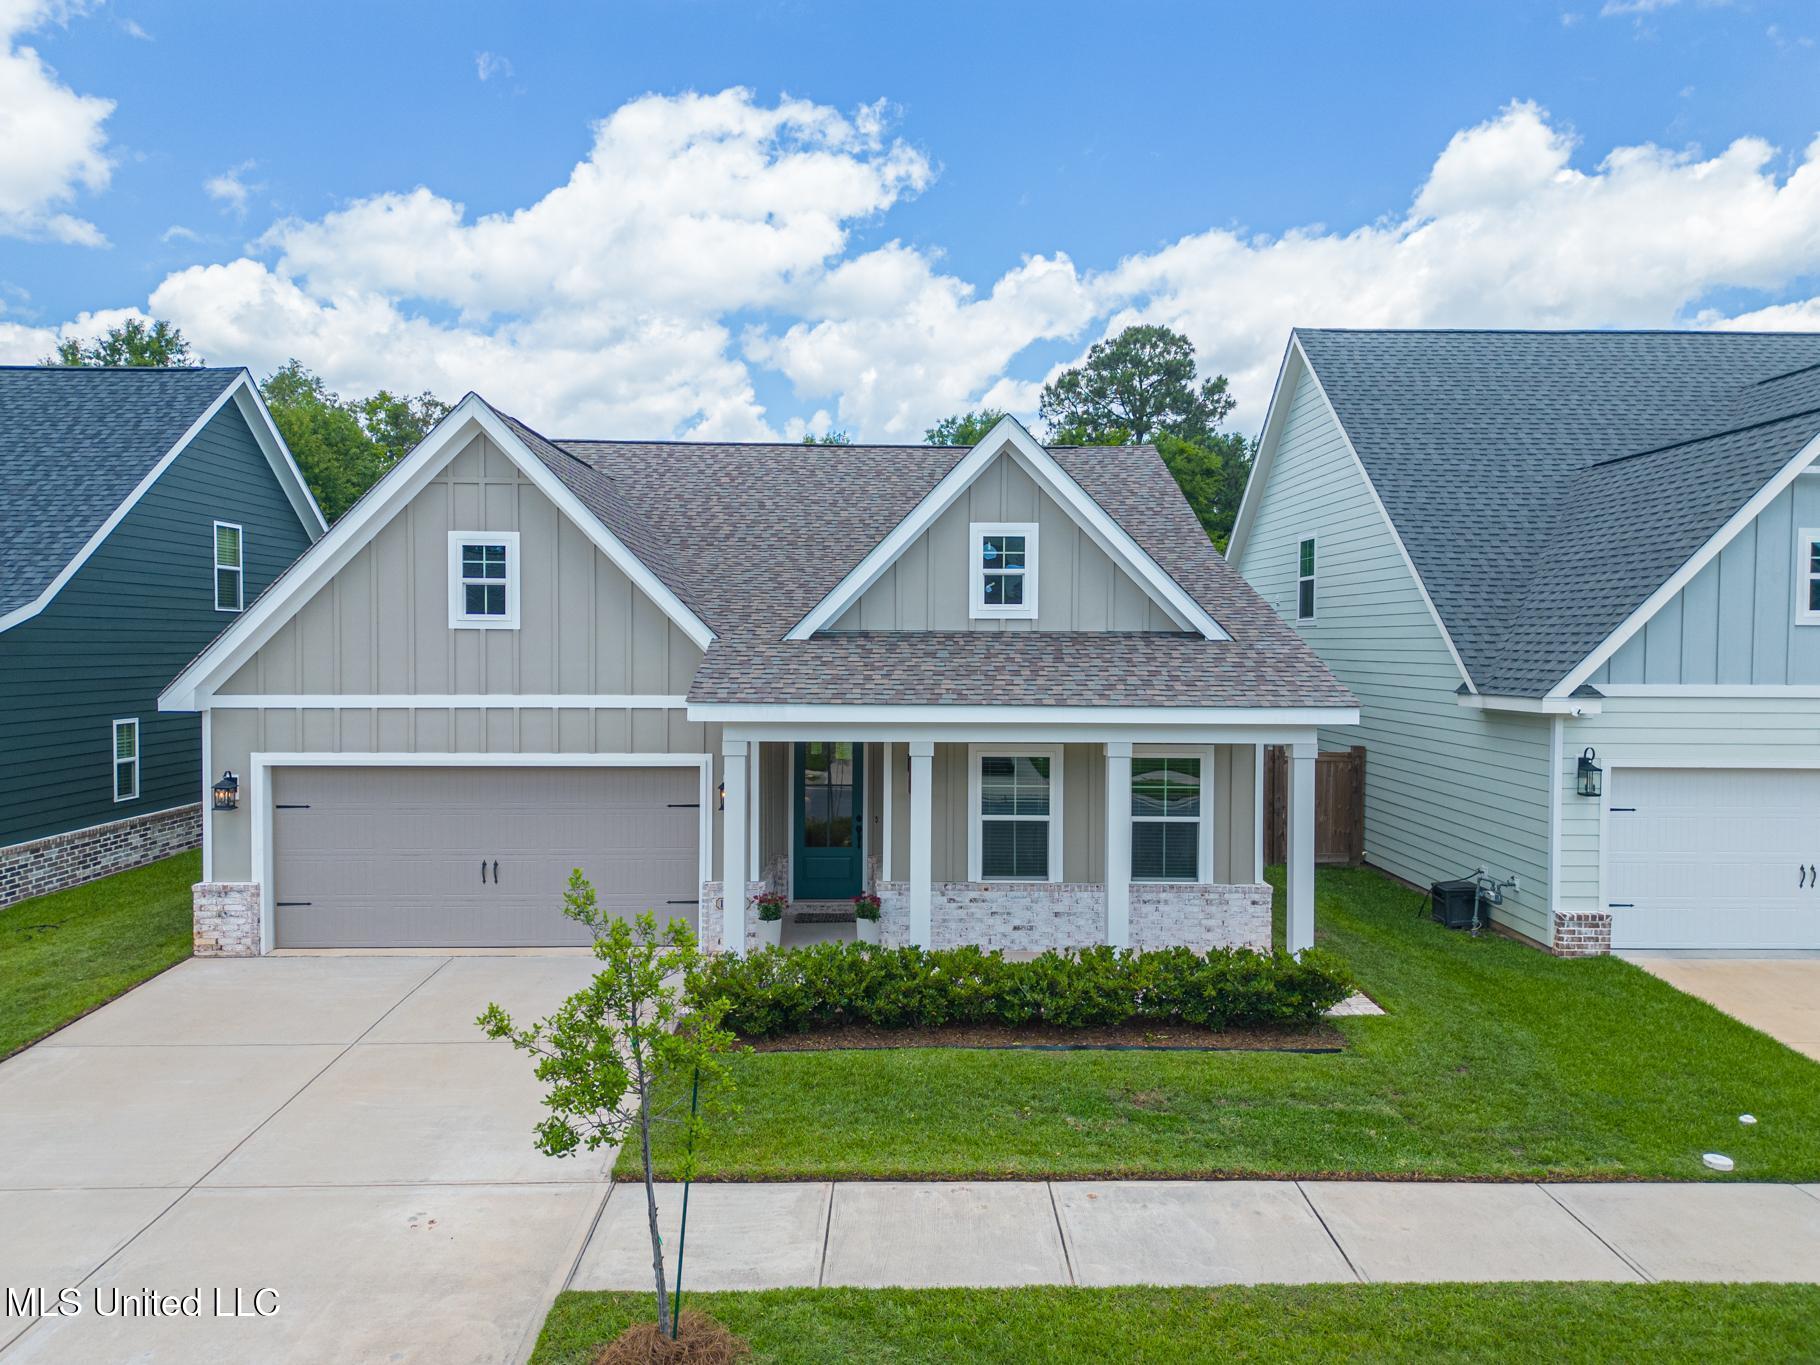
Active
$345,000
3
bds
|
2
ba
|
0
sqft
|
built
2021
13328 Hawk Pl, Gulfport, MS 39503
$-66
Cash flow
-1.0%
Cash-on-Cash Return
5.5%
Cap rate
0.8%
Rent to Value Ratio
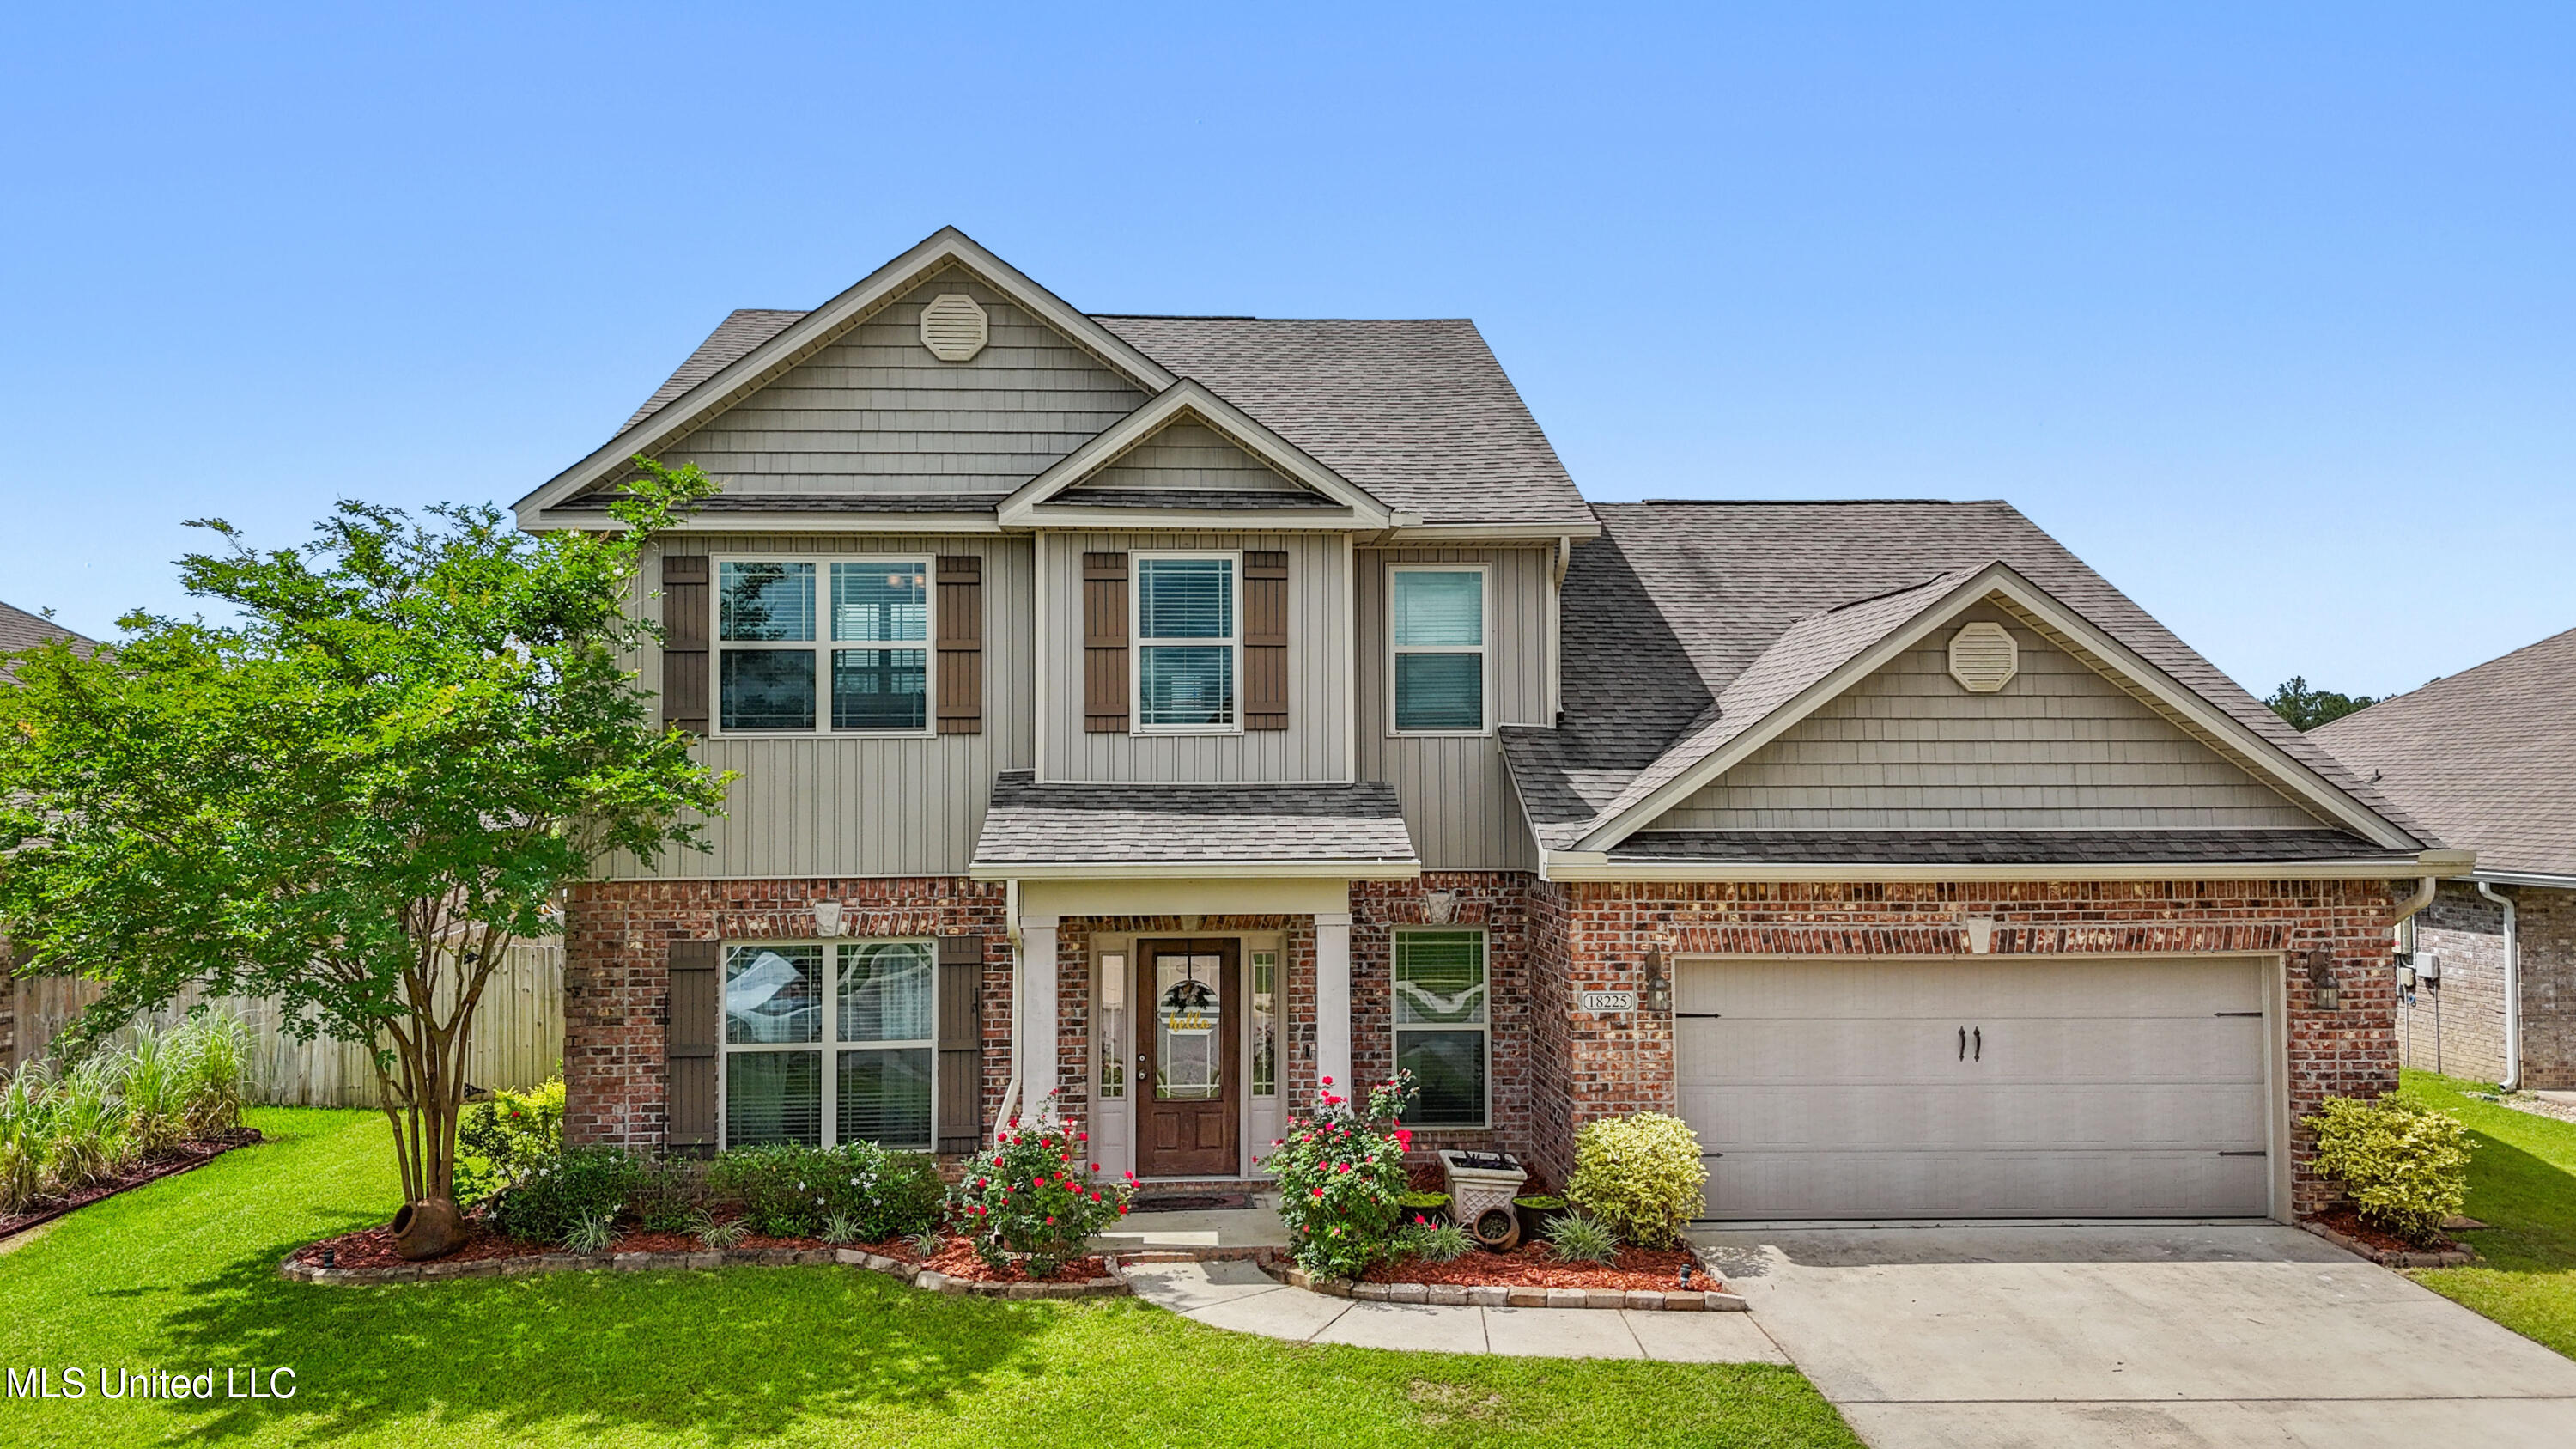
Active
$397,000
4
bds
|
4
ba
|
0
sqft
|
built
2015
18225 Tulip Cv, Gulfport, MS 39503
$-168
Cash flow
-2.2%
Cash-on-Cash Return
5.2%
Cap rate
0.7%
Rent to Value Ratio
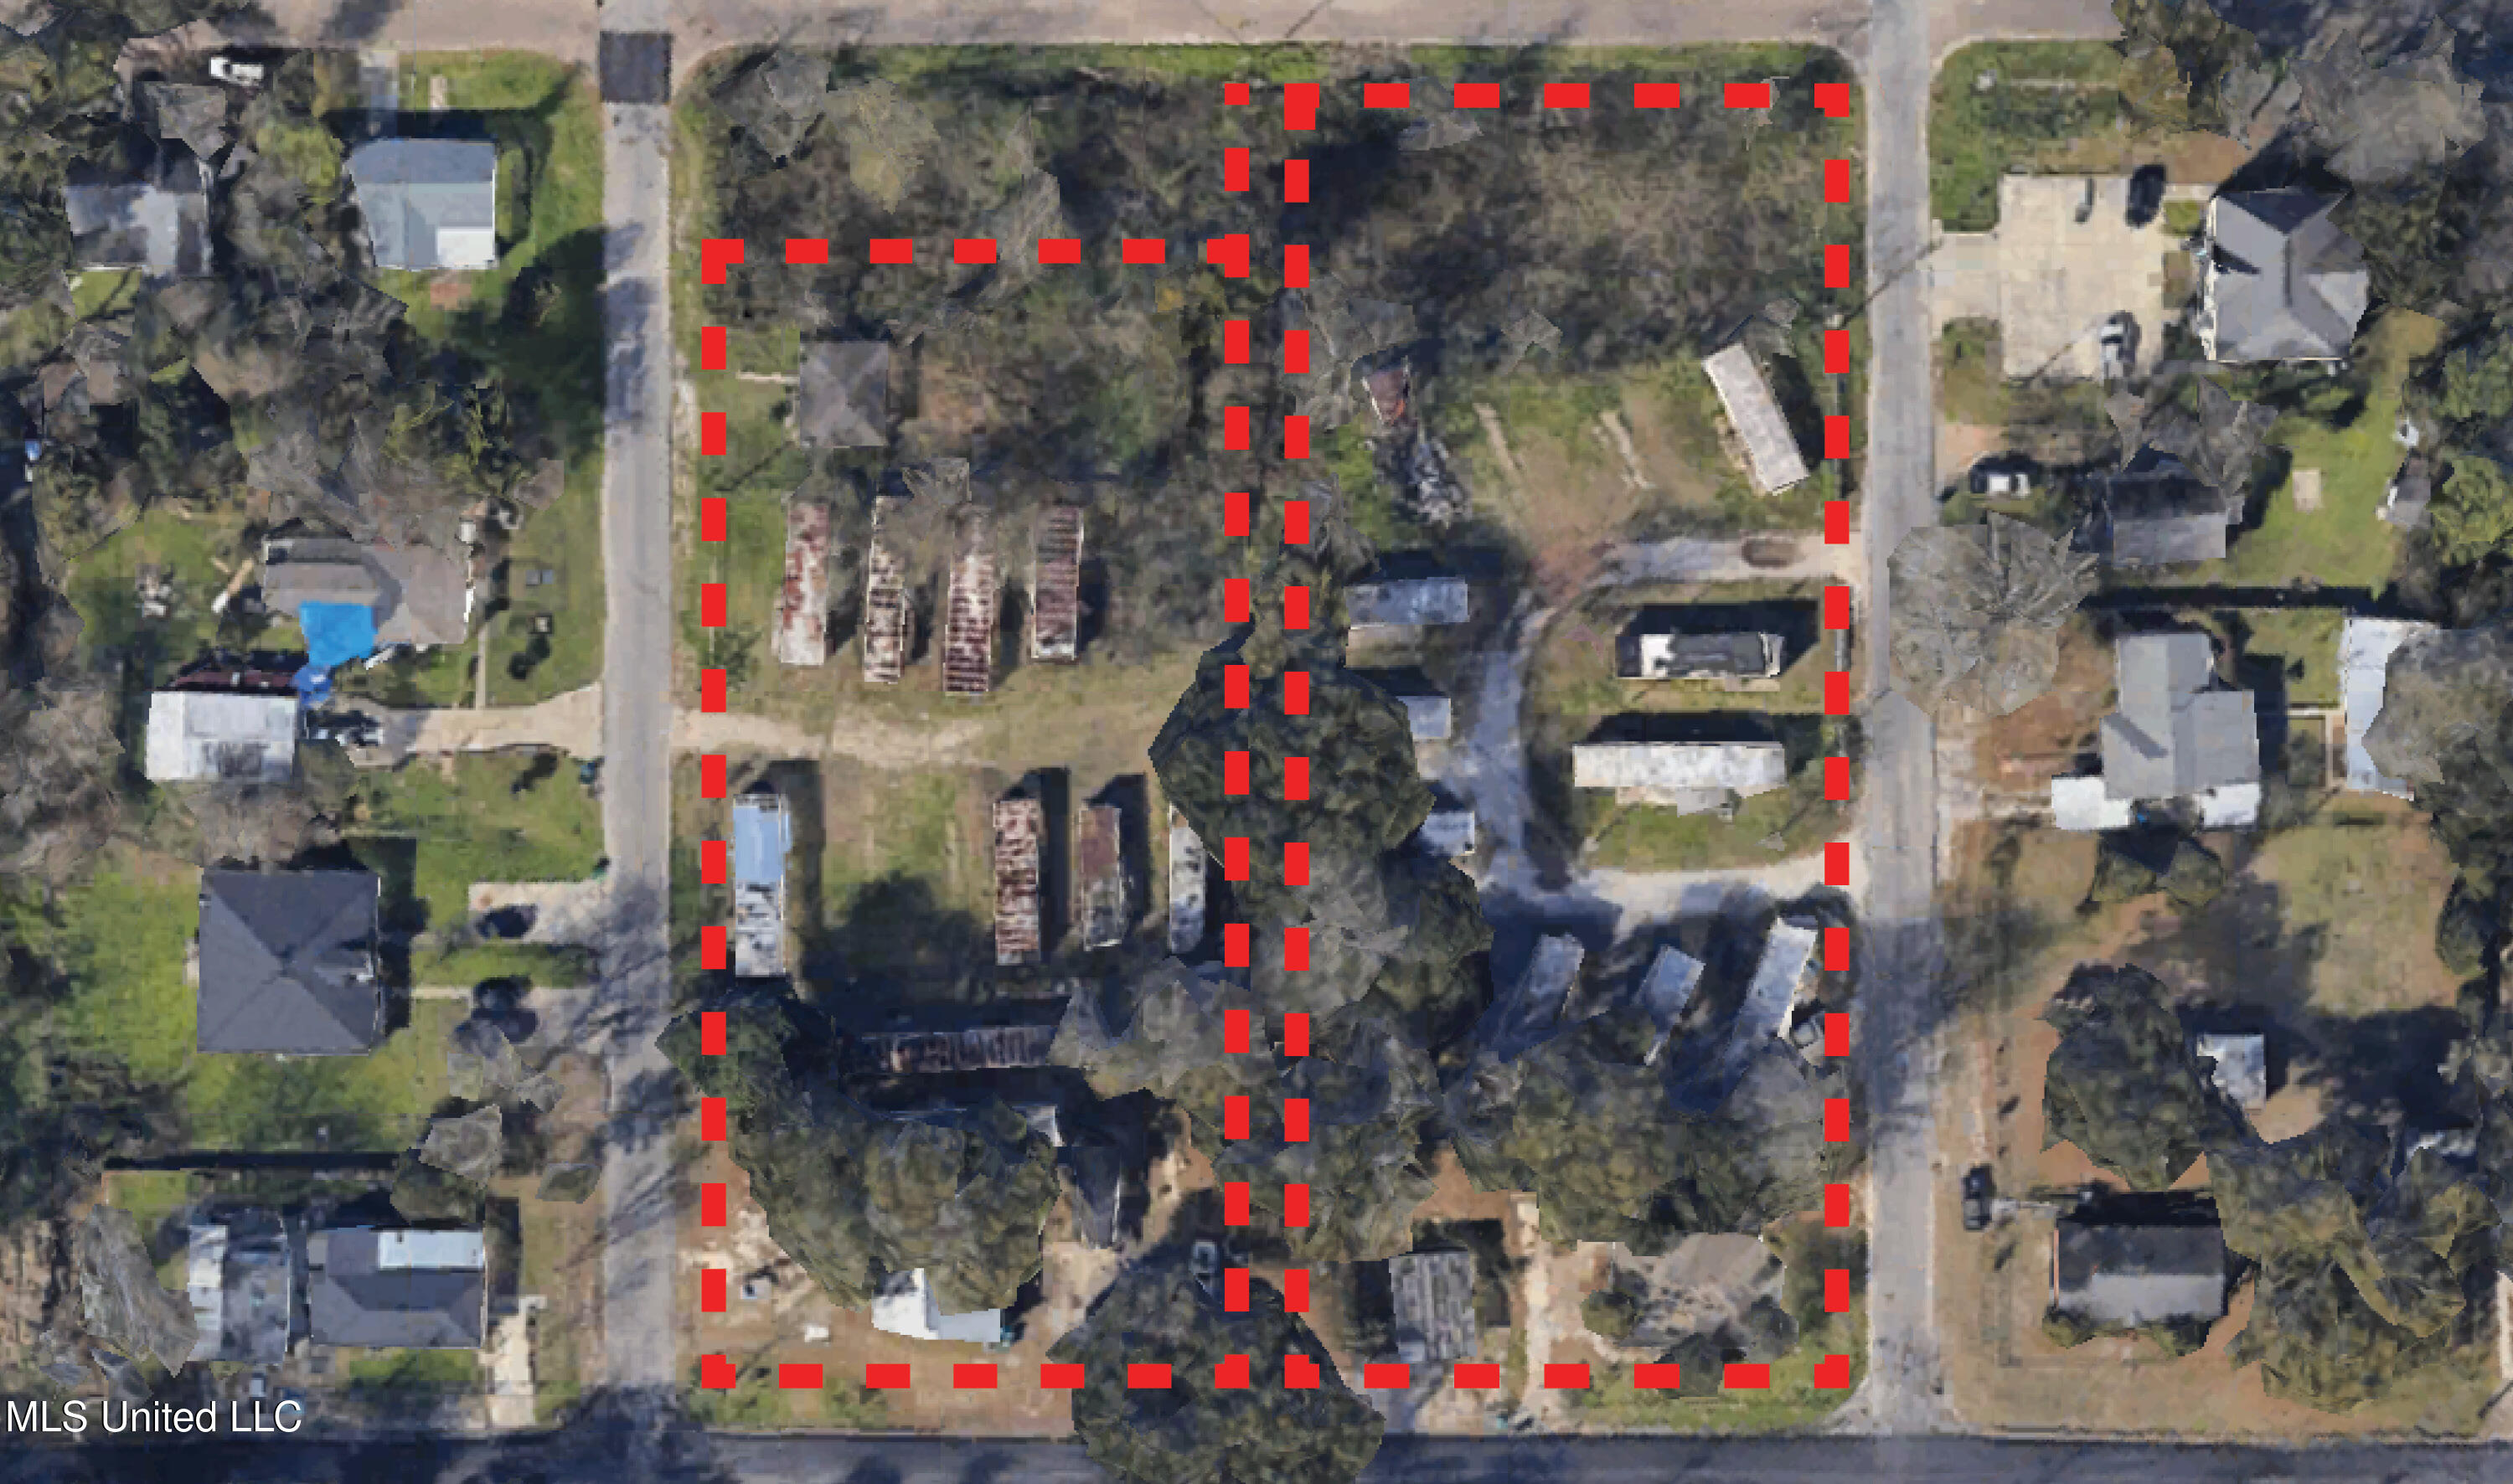
Active
$375,000
27
bds
|
22
ba
|
0
sqft
|
built
1930
2301 16th Ave, Gulfport, MS 39501
$-520
Cash flow
-7.2%
Cash-on-Cash Return
4.0%
Cap rate
0.5%
Rent to Value Ratio
Active
$175,000
3
bds
|
1
ba
|
0
sqft
|
built
1940
2900 7th Ave, Gulfport, MS 39501
$241
Cash flow
7.2%
Cash-on-Cash Return
7.3%
Cap rate
0.9%
Rent to Value Ratio
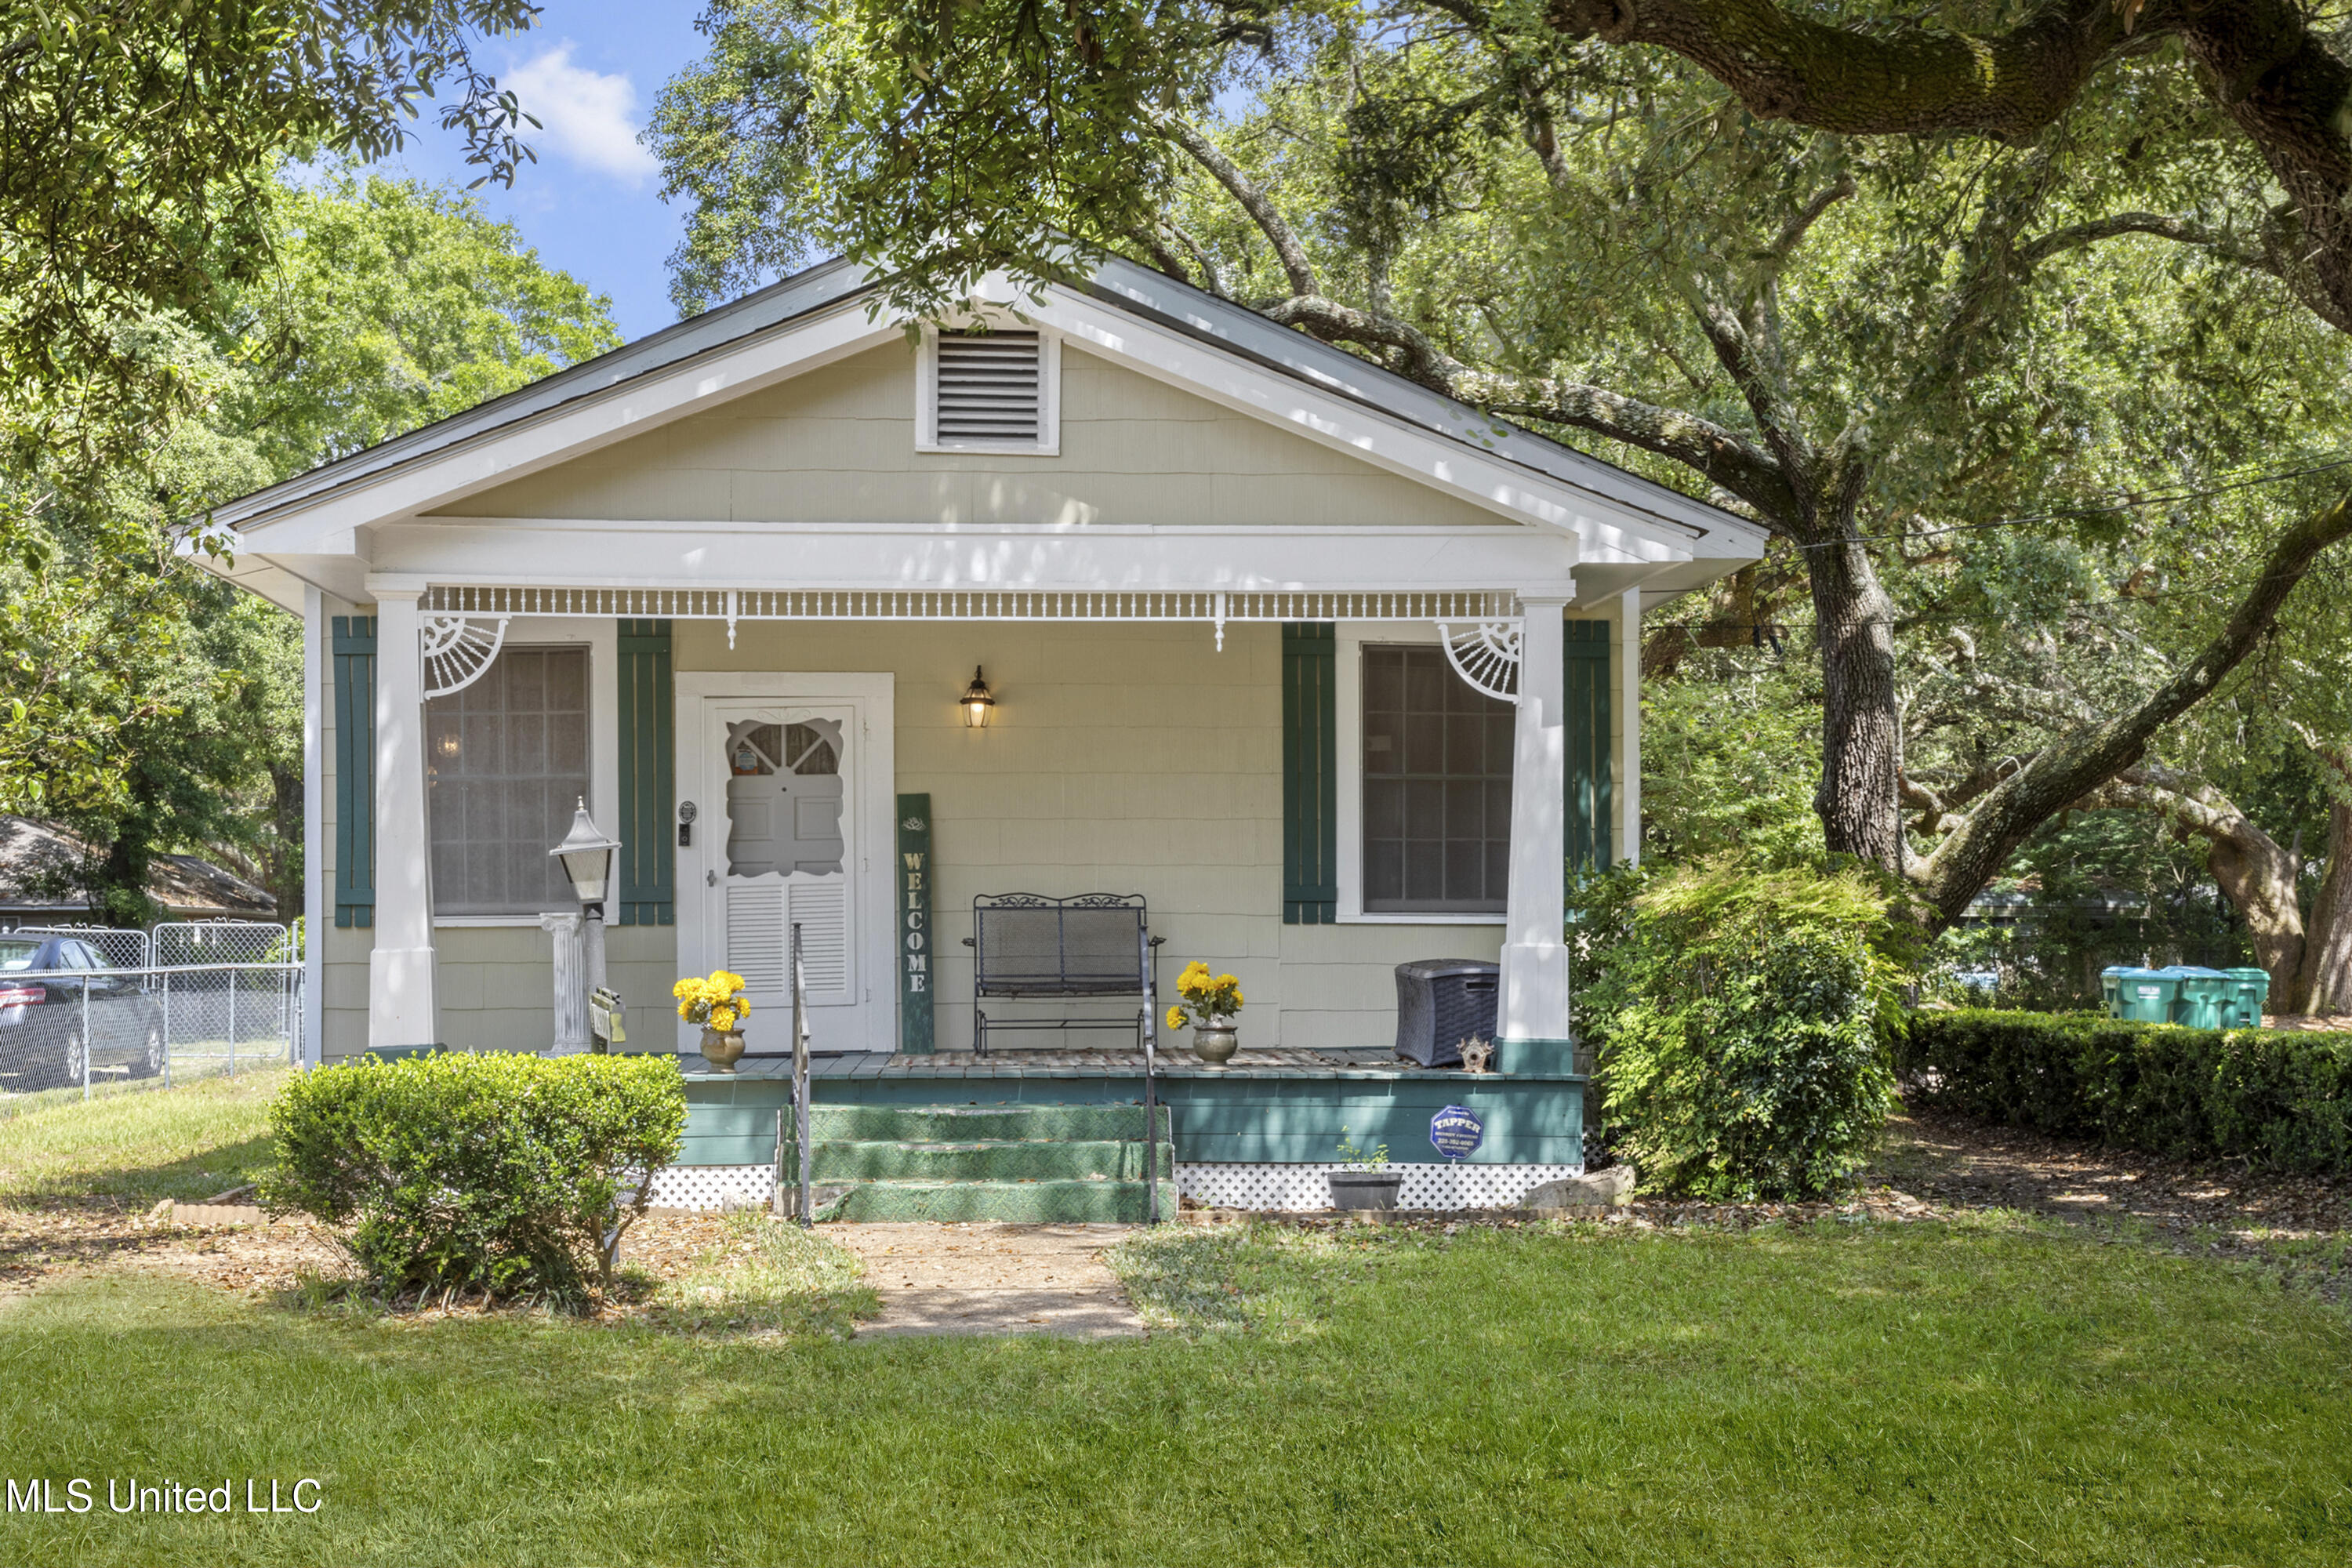
Active
$295,000
3
bds
|
2
ba
|
0
sqft
|
built
1942
1728 21st St, Gulfport, MS 39501
$789
Cash flow
14.0%
Cash-on-Cash Return
8.9%
Cap rate
1.1%
Rent to Value Ratio
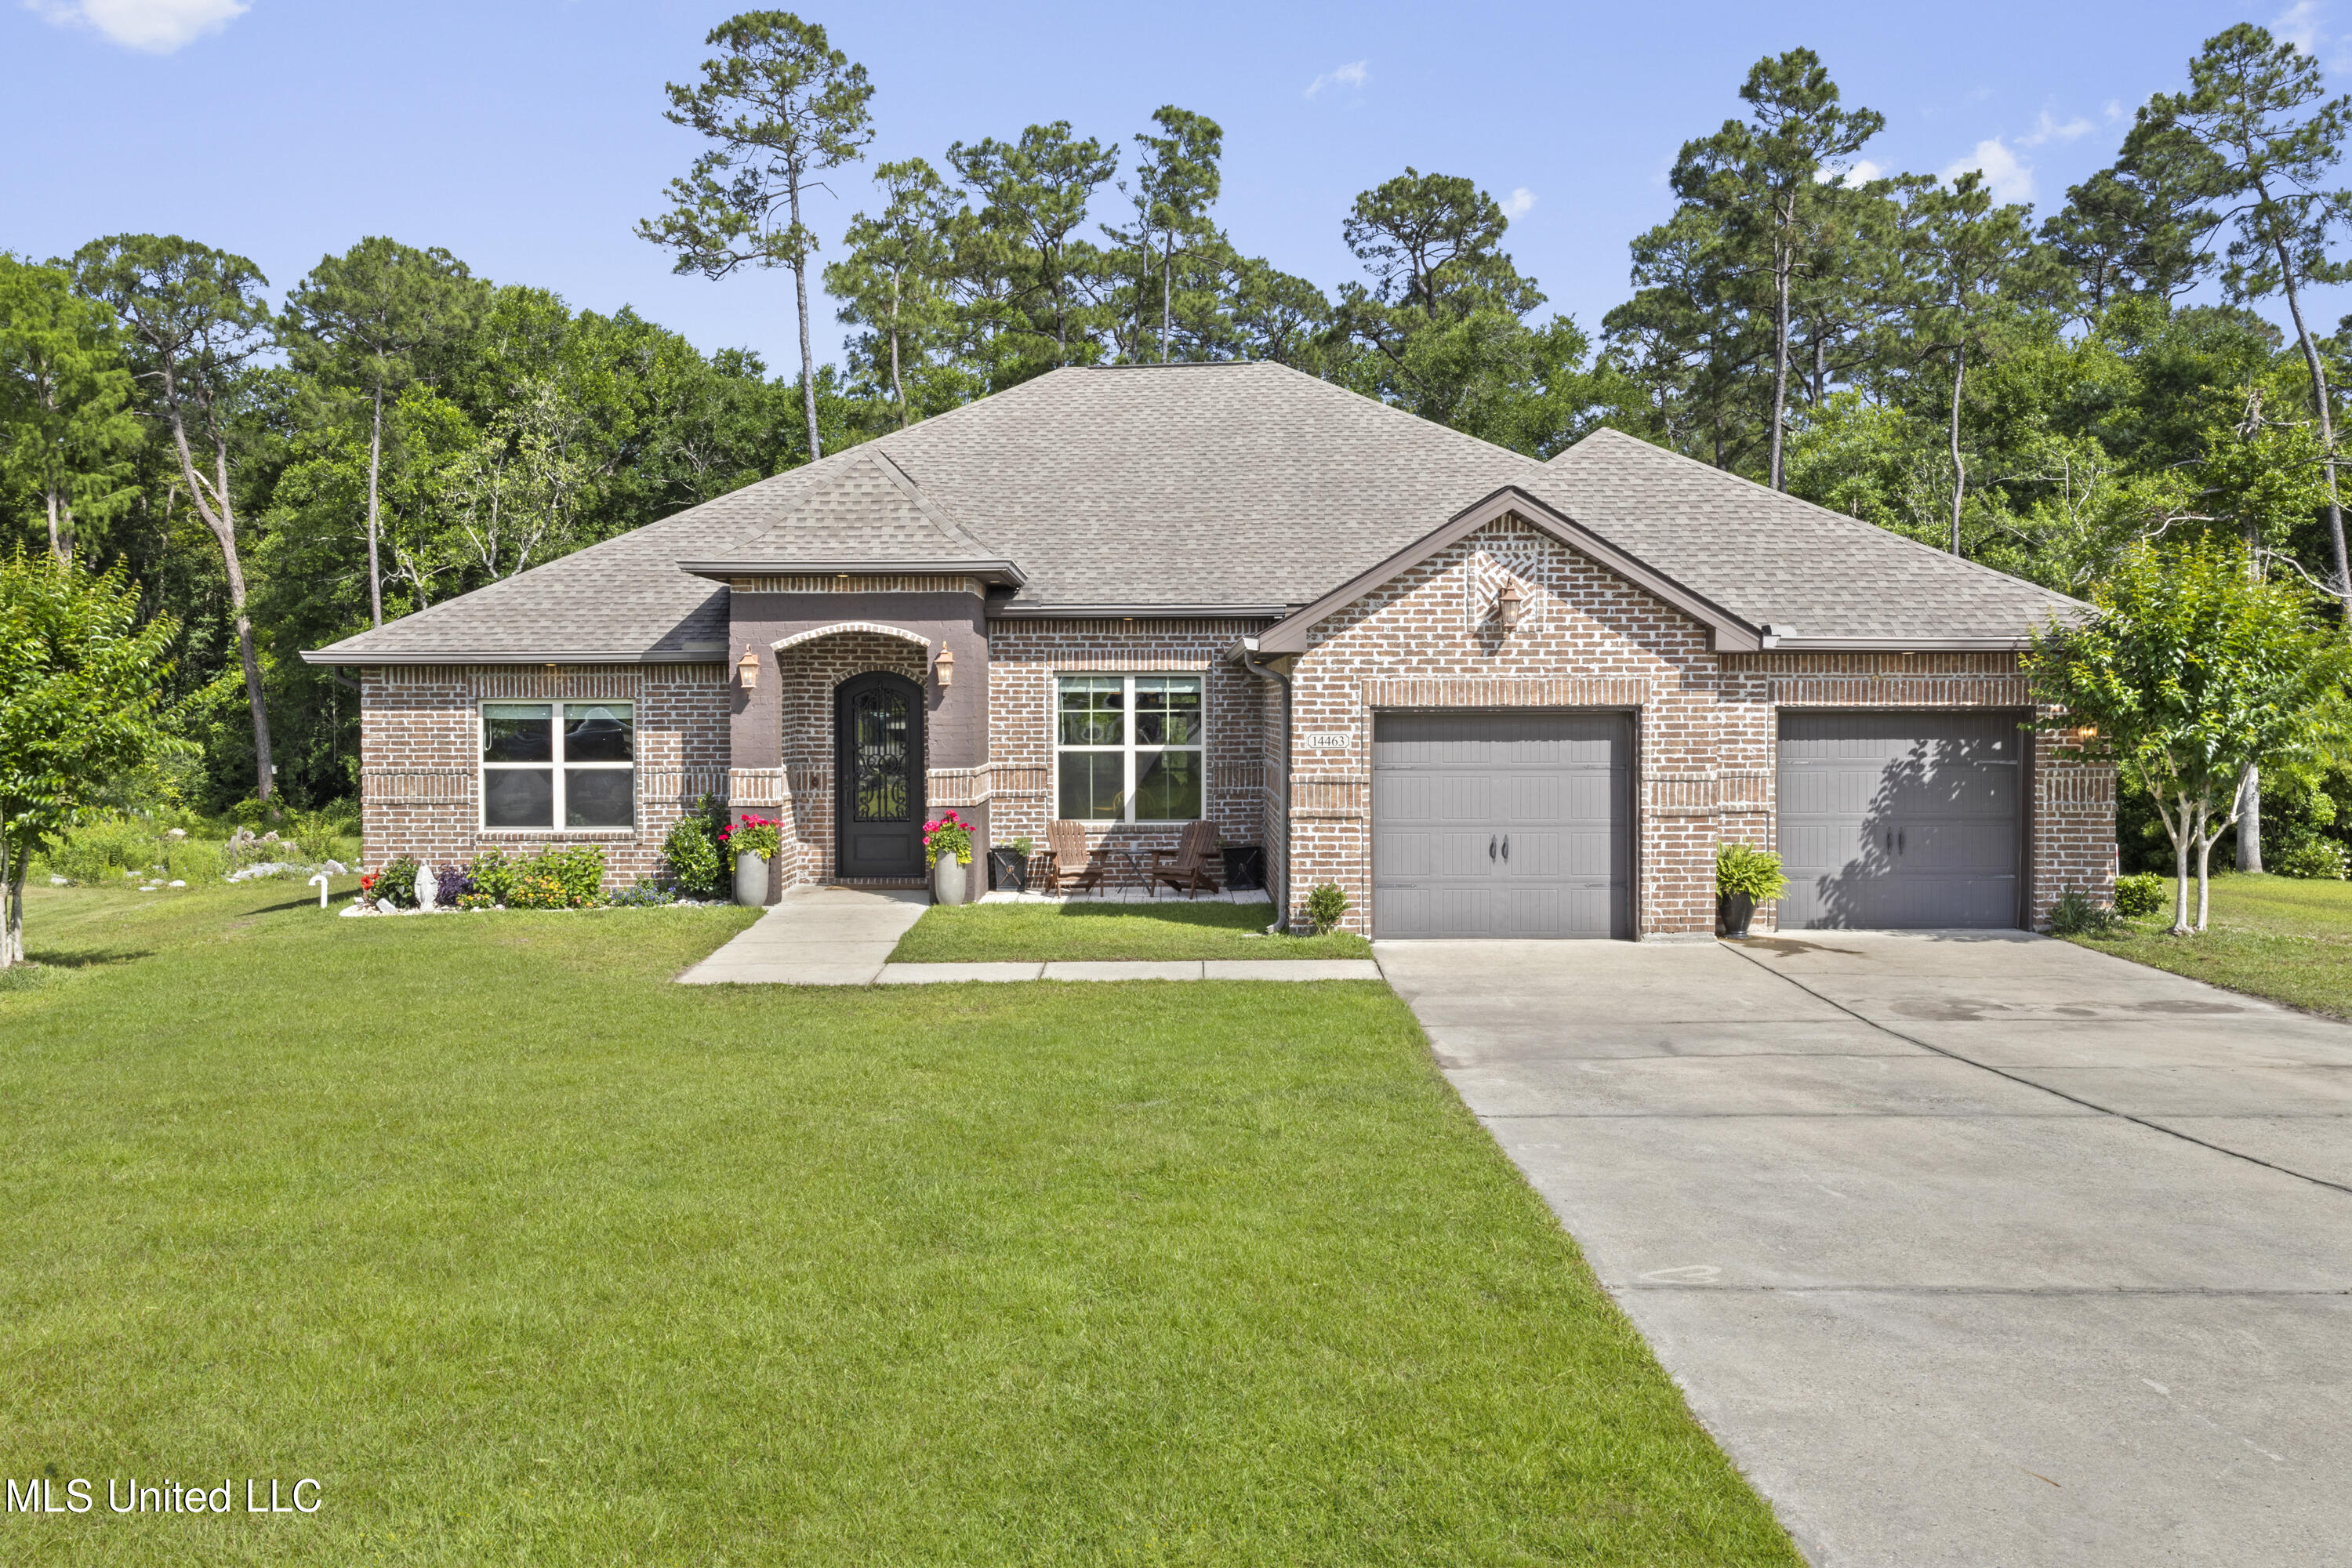
Active
$440,000
4
bds
|
2
ba
|
0
sqft
|
built
2015
14463 Aerie Rd, Gulfport, MS 39503
$-430
Cash flow
-5.1%
Cash-on-Cash Return
4.5%
Cap rate
0.6%
Rent to Value Ratio
Active
$177,000
3
bds
|
1
ba
|
0
sqft
|
built
1972
154 Ben Dr, Gulfport, MS 39503
$149
Cash flow
4.4%
Cash-on-Cash Return
6.7%
Cap rate
0.9%
Rent to Value Ratio
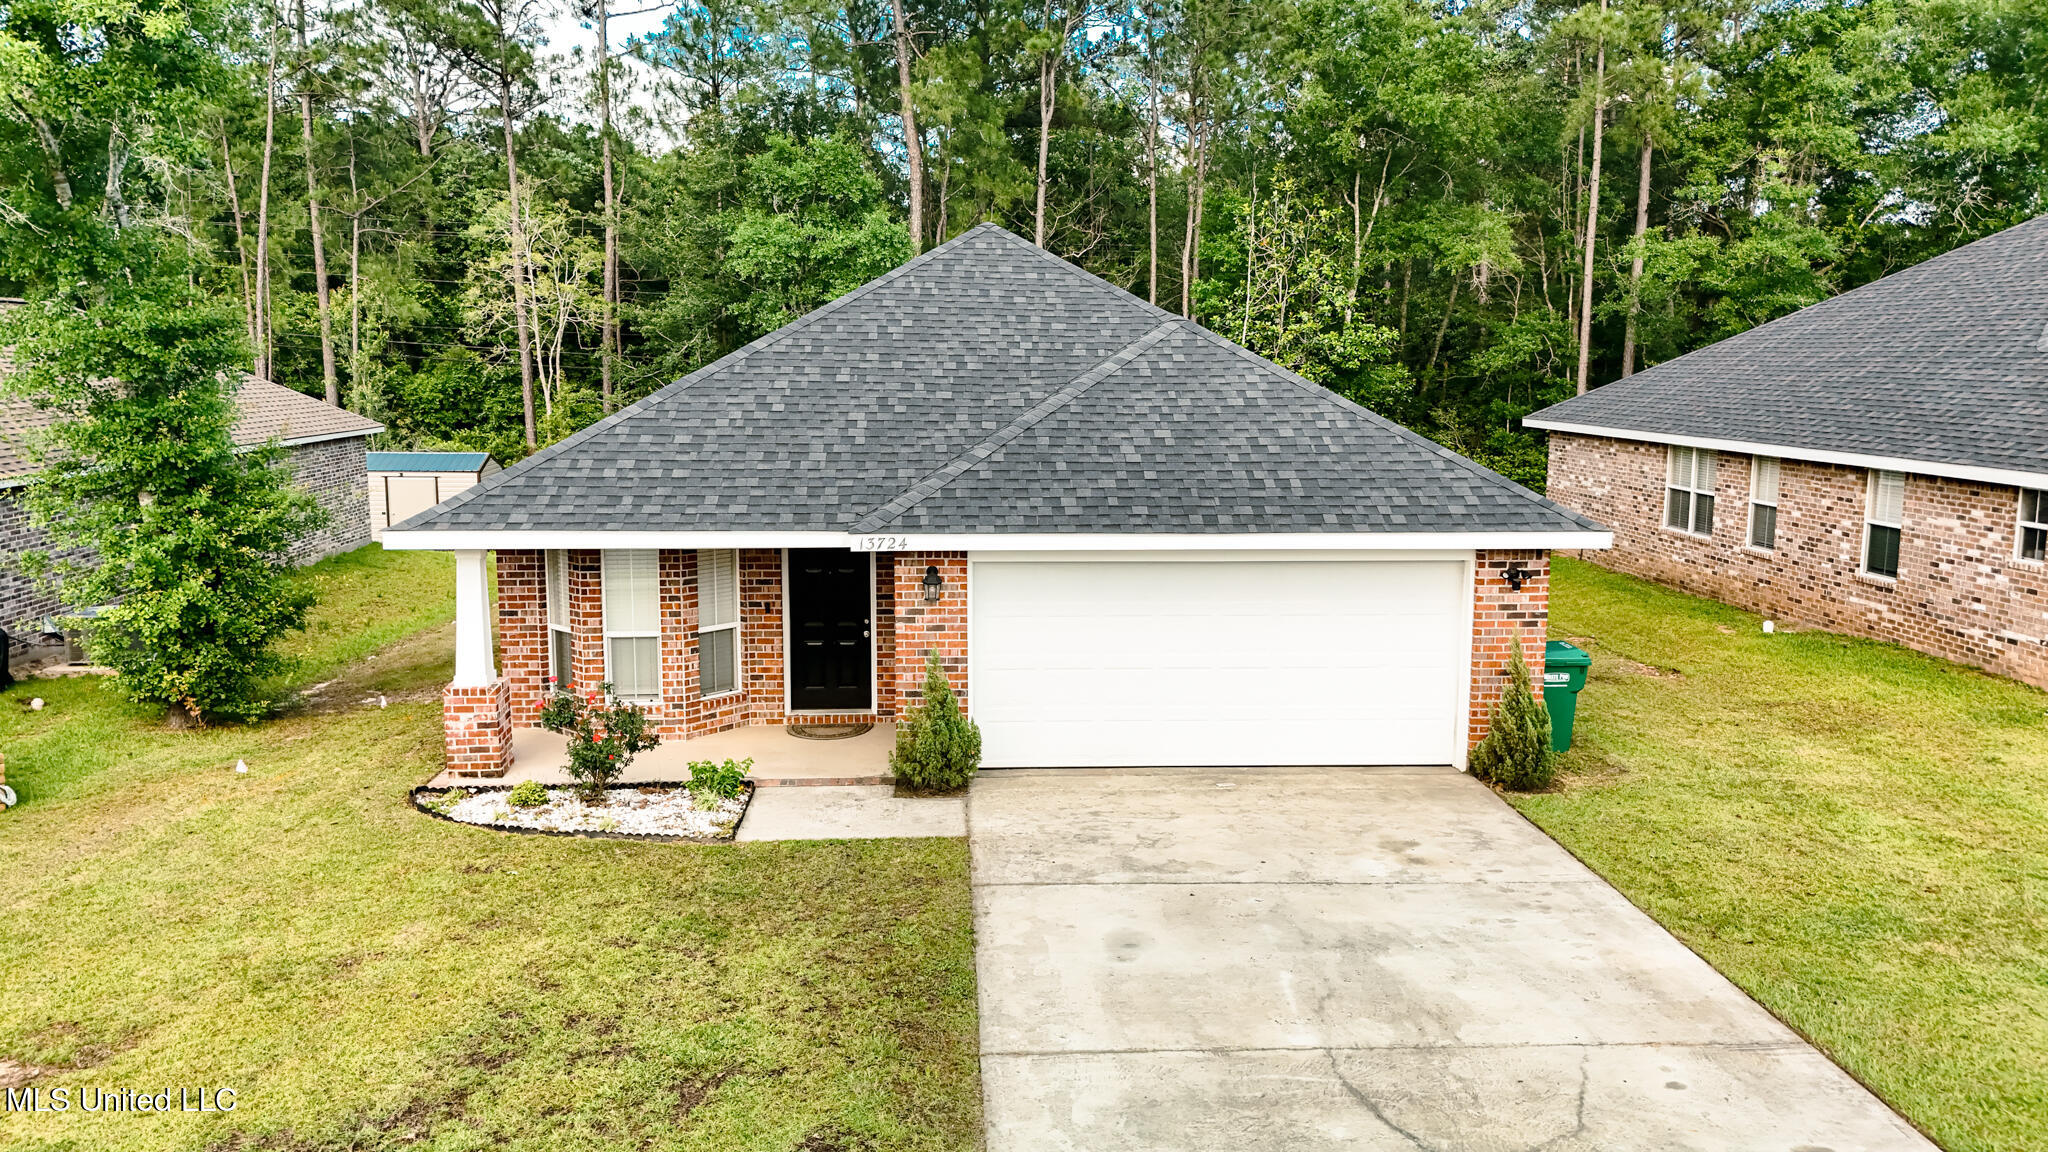
Active
$249,000
3
bds
|
2
ba
|
0
sqft
|
built
2018
13724 Fox Hill Dr, Gulfport, MS 39503
$90
Cash flow
1.9%
Cash-on-Cash Return
6.1%
Cap rate
0.9%
Rent to Value Ratio
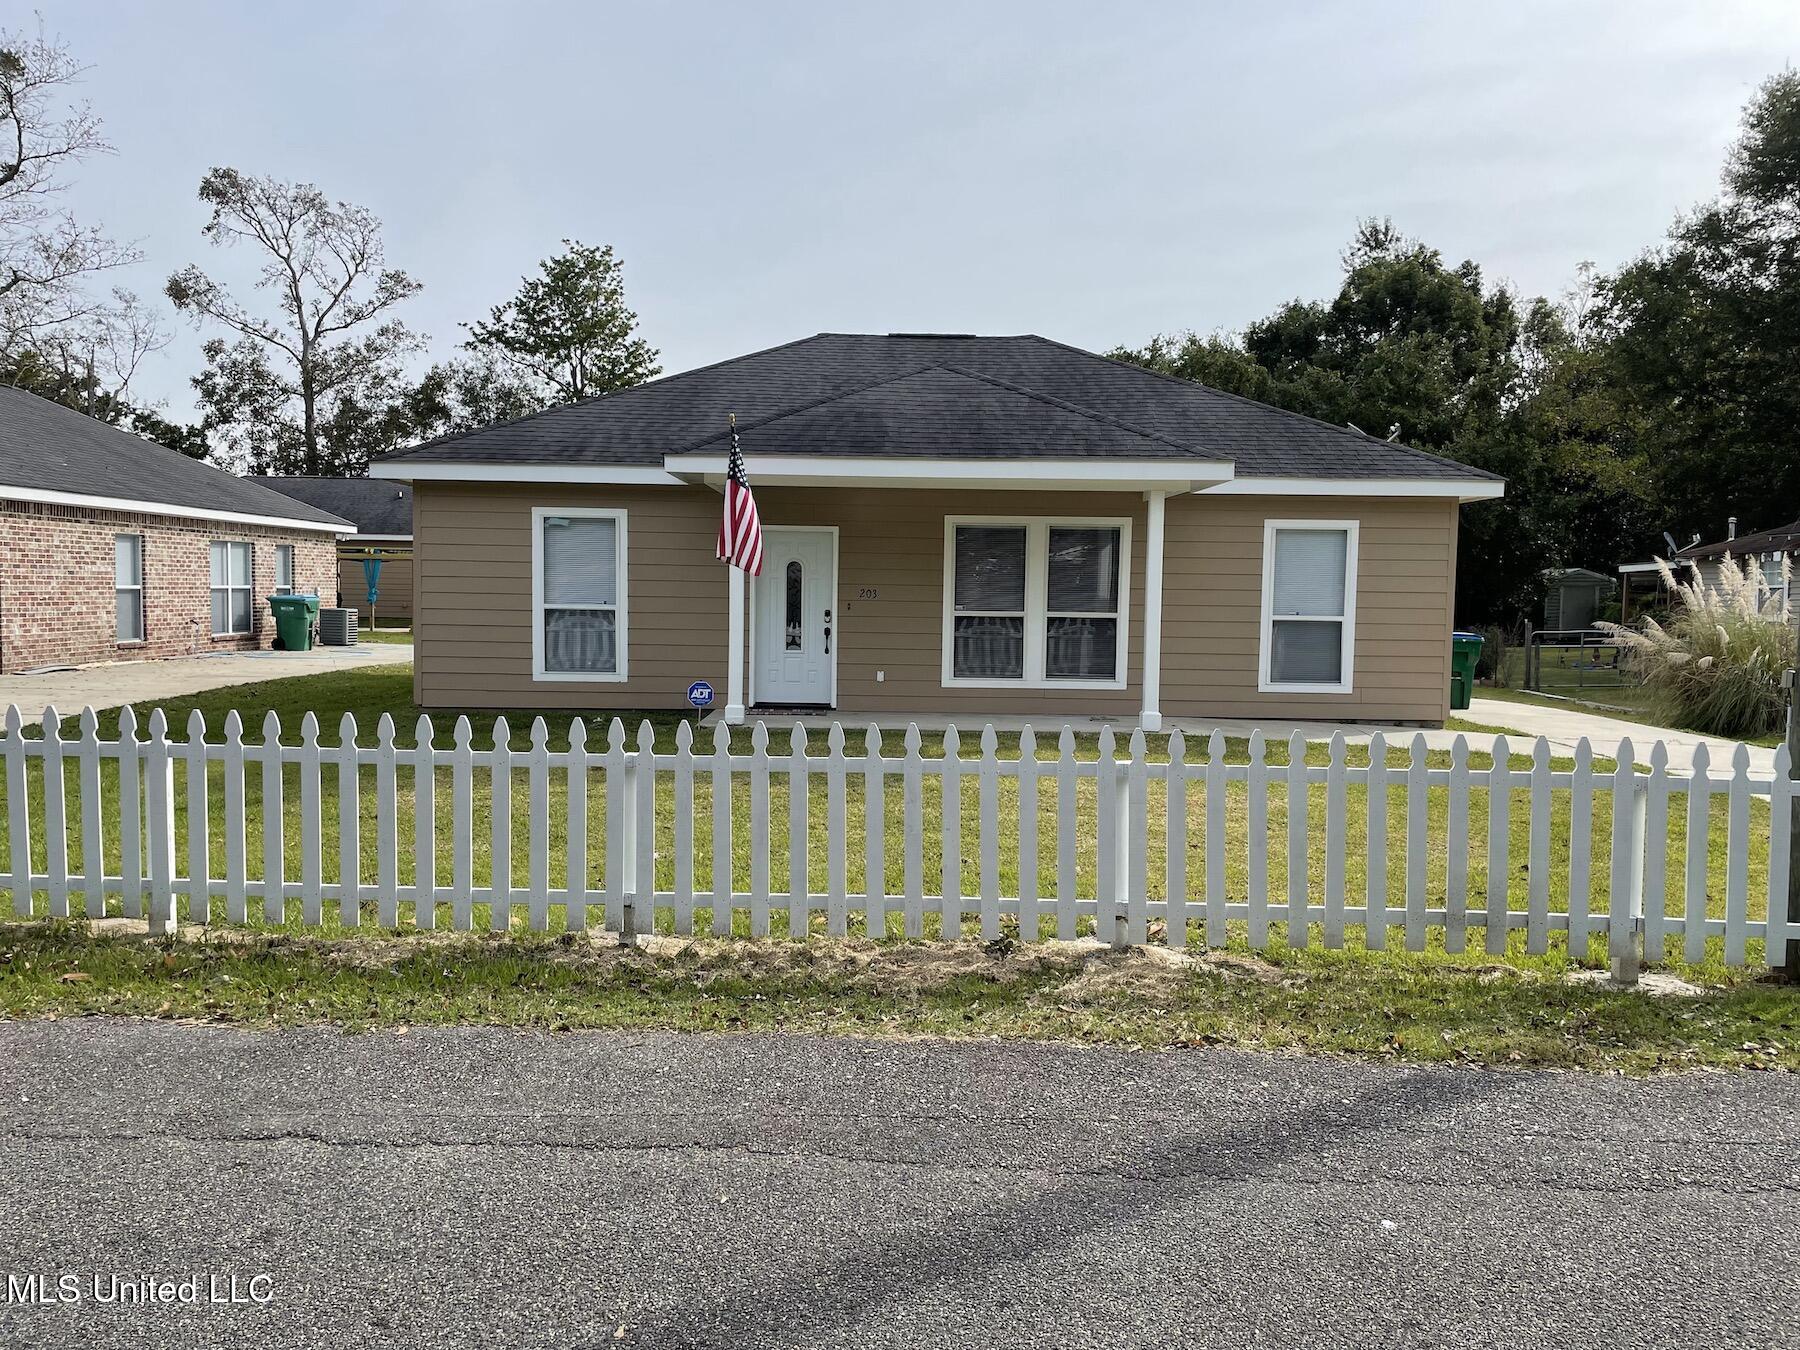
Active
$205,000
3
bds
|
2
ba
|
0
sqft
|
built
2011
203 Milner Ave, Gulfport, MS 39507
$47
Cash flow
1.2%
Cash-on-Cash Return
6.0%
Cap rate
0.8%
Rent to Value Ratio
Active
$49,500
2
bds
|
1
ba
|
0
sqft
|
built
1953
12104 Three Rivers Rd, Gulfport, MS 39503
$900
Cash flow
21.2%
Cash-on-Cash Return
21.8%
Cap rate
2.8%
Rent to Value Ratio
Active
$393,000
3
bds
|
2
ba
|
0
sqft
|
built
1993
13456 John Clark Rd, Gulfport, MS 39503
$49
Cash flow
0.7%
Cash-on-Cash Return
5.8%
Cap rate
0.7%
Rent to Value Ratio
Active
$395,000
3
bds
|
2
ba
|
0
sqft
|
built
2007
1200 Beach Dr, Gulfport, MS 39507
$-1,249
Cash flow
-16.5%
Cash-on-Cash Return
1.9%
Cap rate
0.8%
Rent to Value Ratio