Gulfport, MS Investment Properties for Sale
Browse homes for sale and investment properties in Gulfport, MS. Refine your search by price, property type, or more.
Best cash flowing properties in Gulfport, MS

Pending
$69,000
2
bds
|
1
ba
|
0
sqft
|
built
1965
1915 21st Ave, Gulfport, MS 39501
$1,035
Cash flow
17.5%
Cash-on-Cash Return
18.0%
Cap rate
2.2%
Rent to Value Ratio

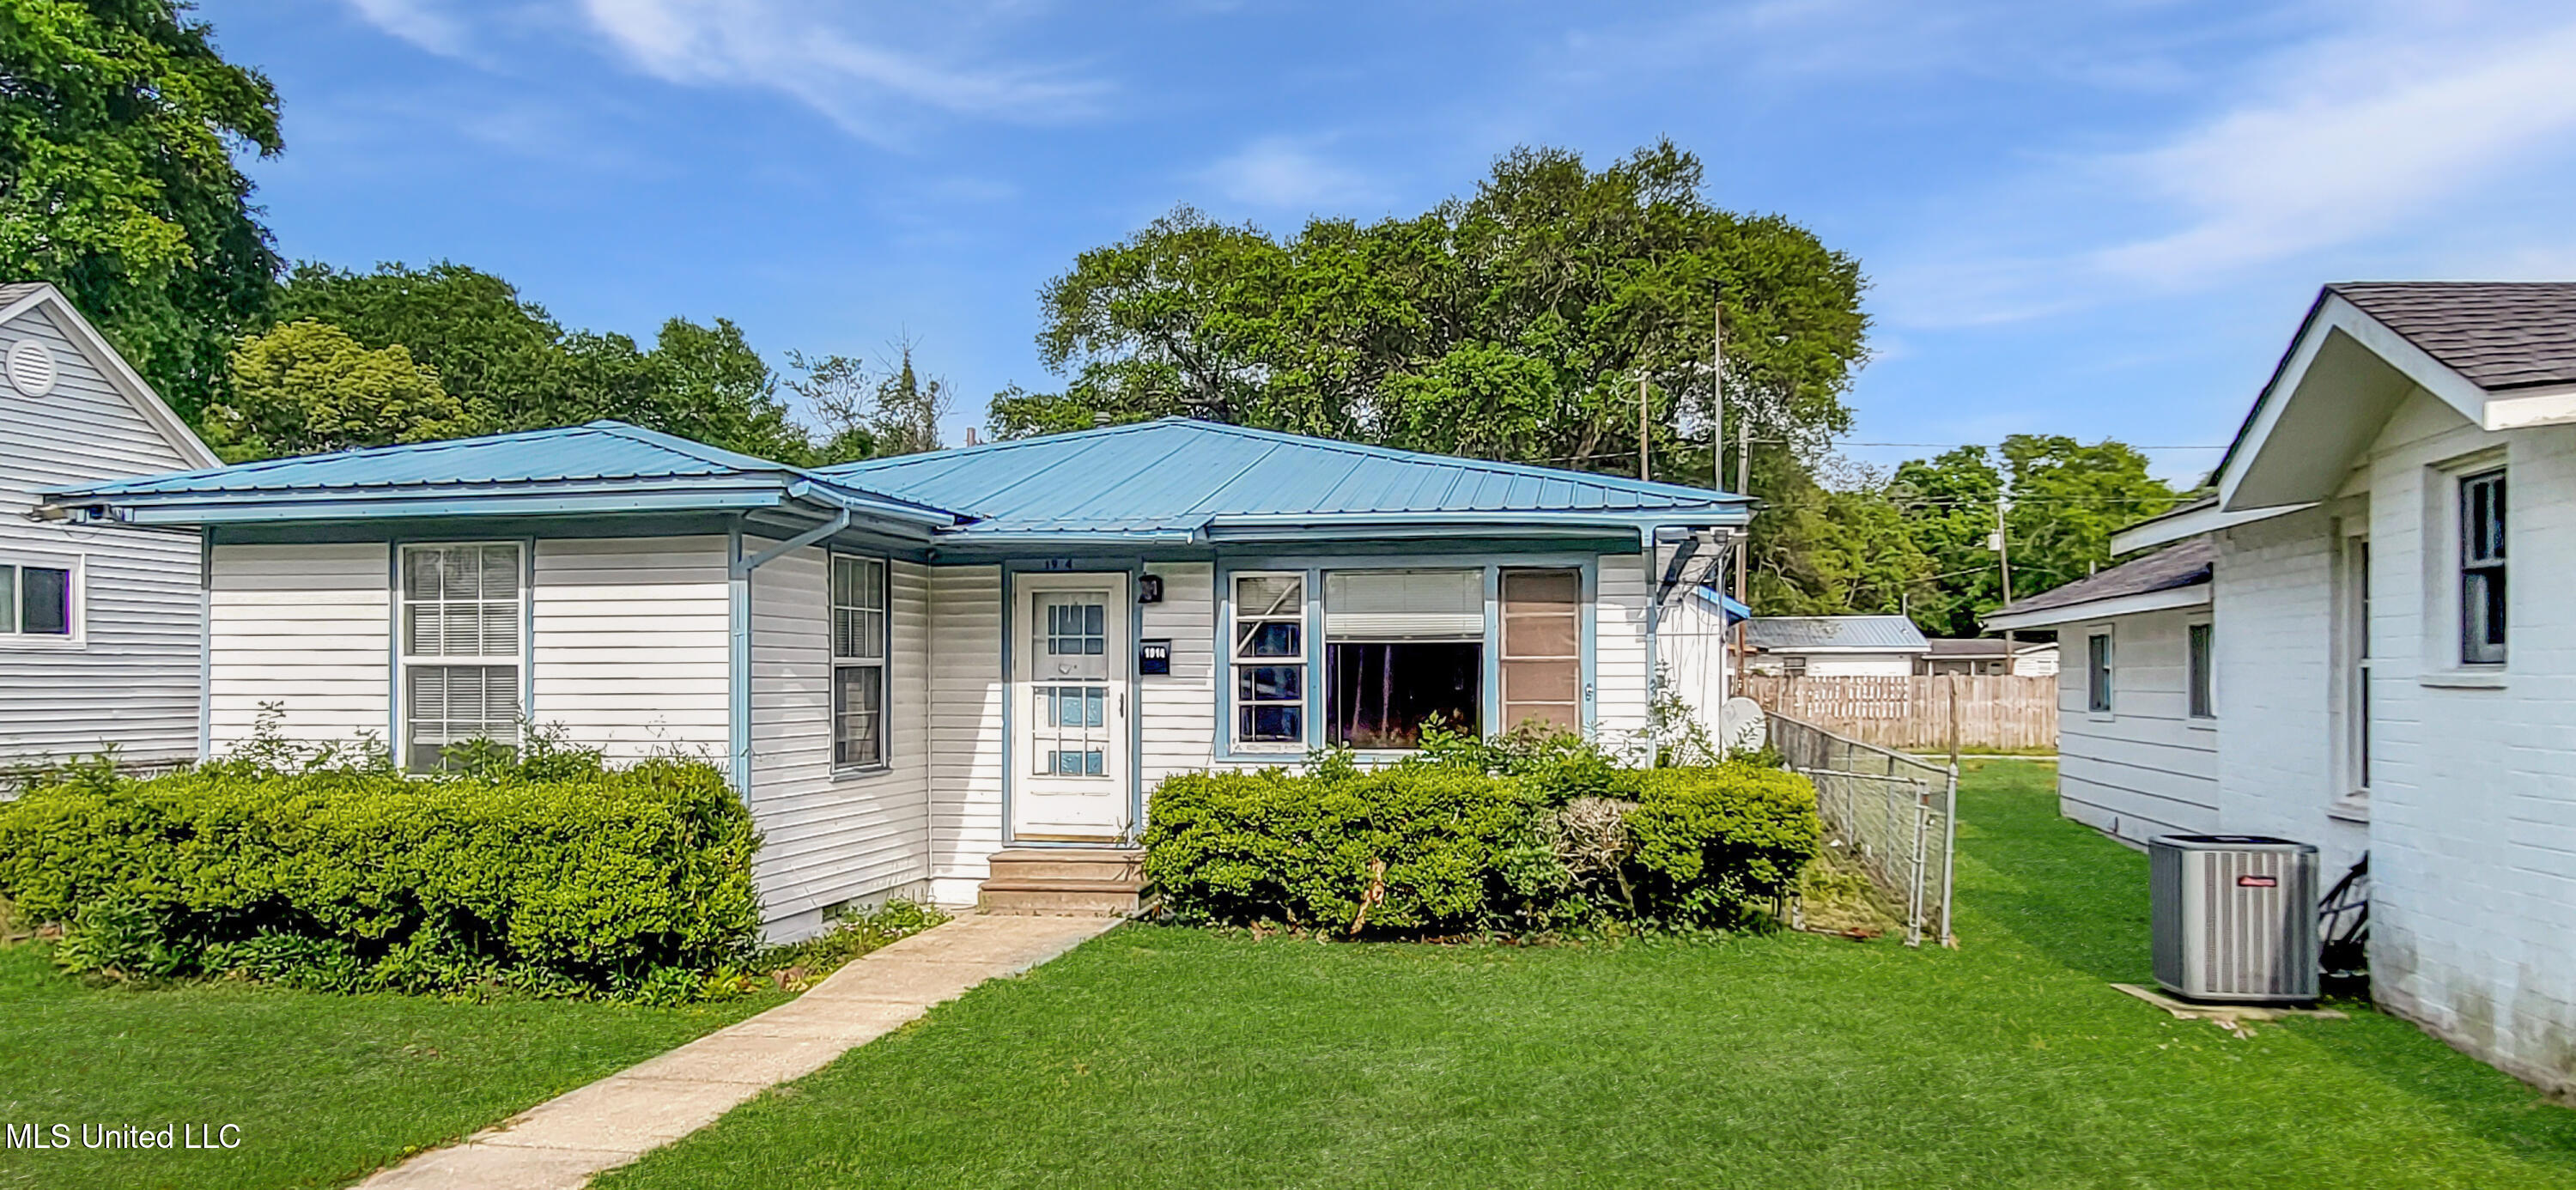
Active
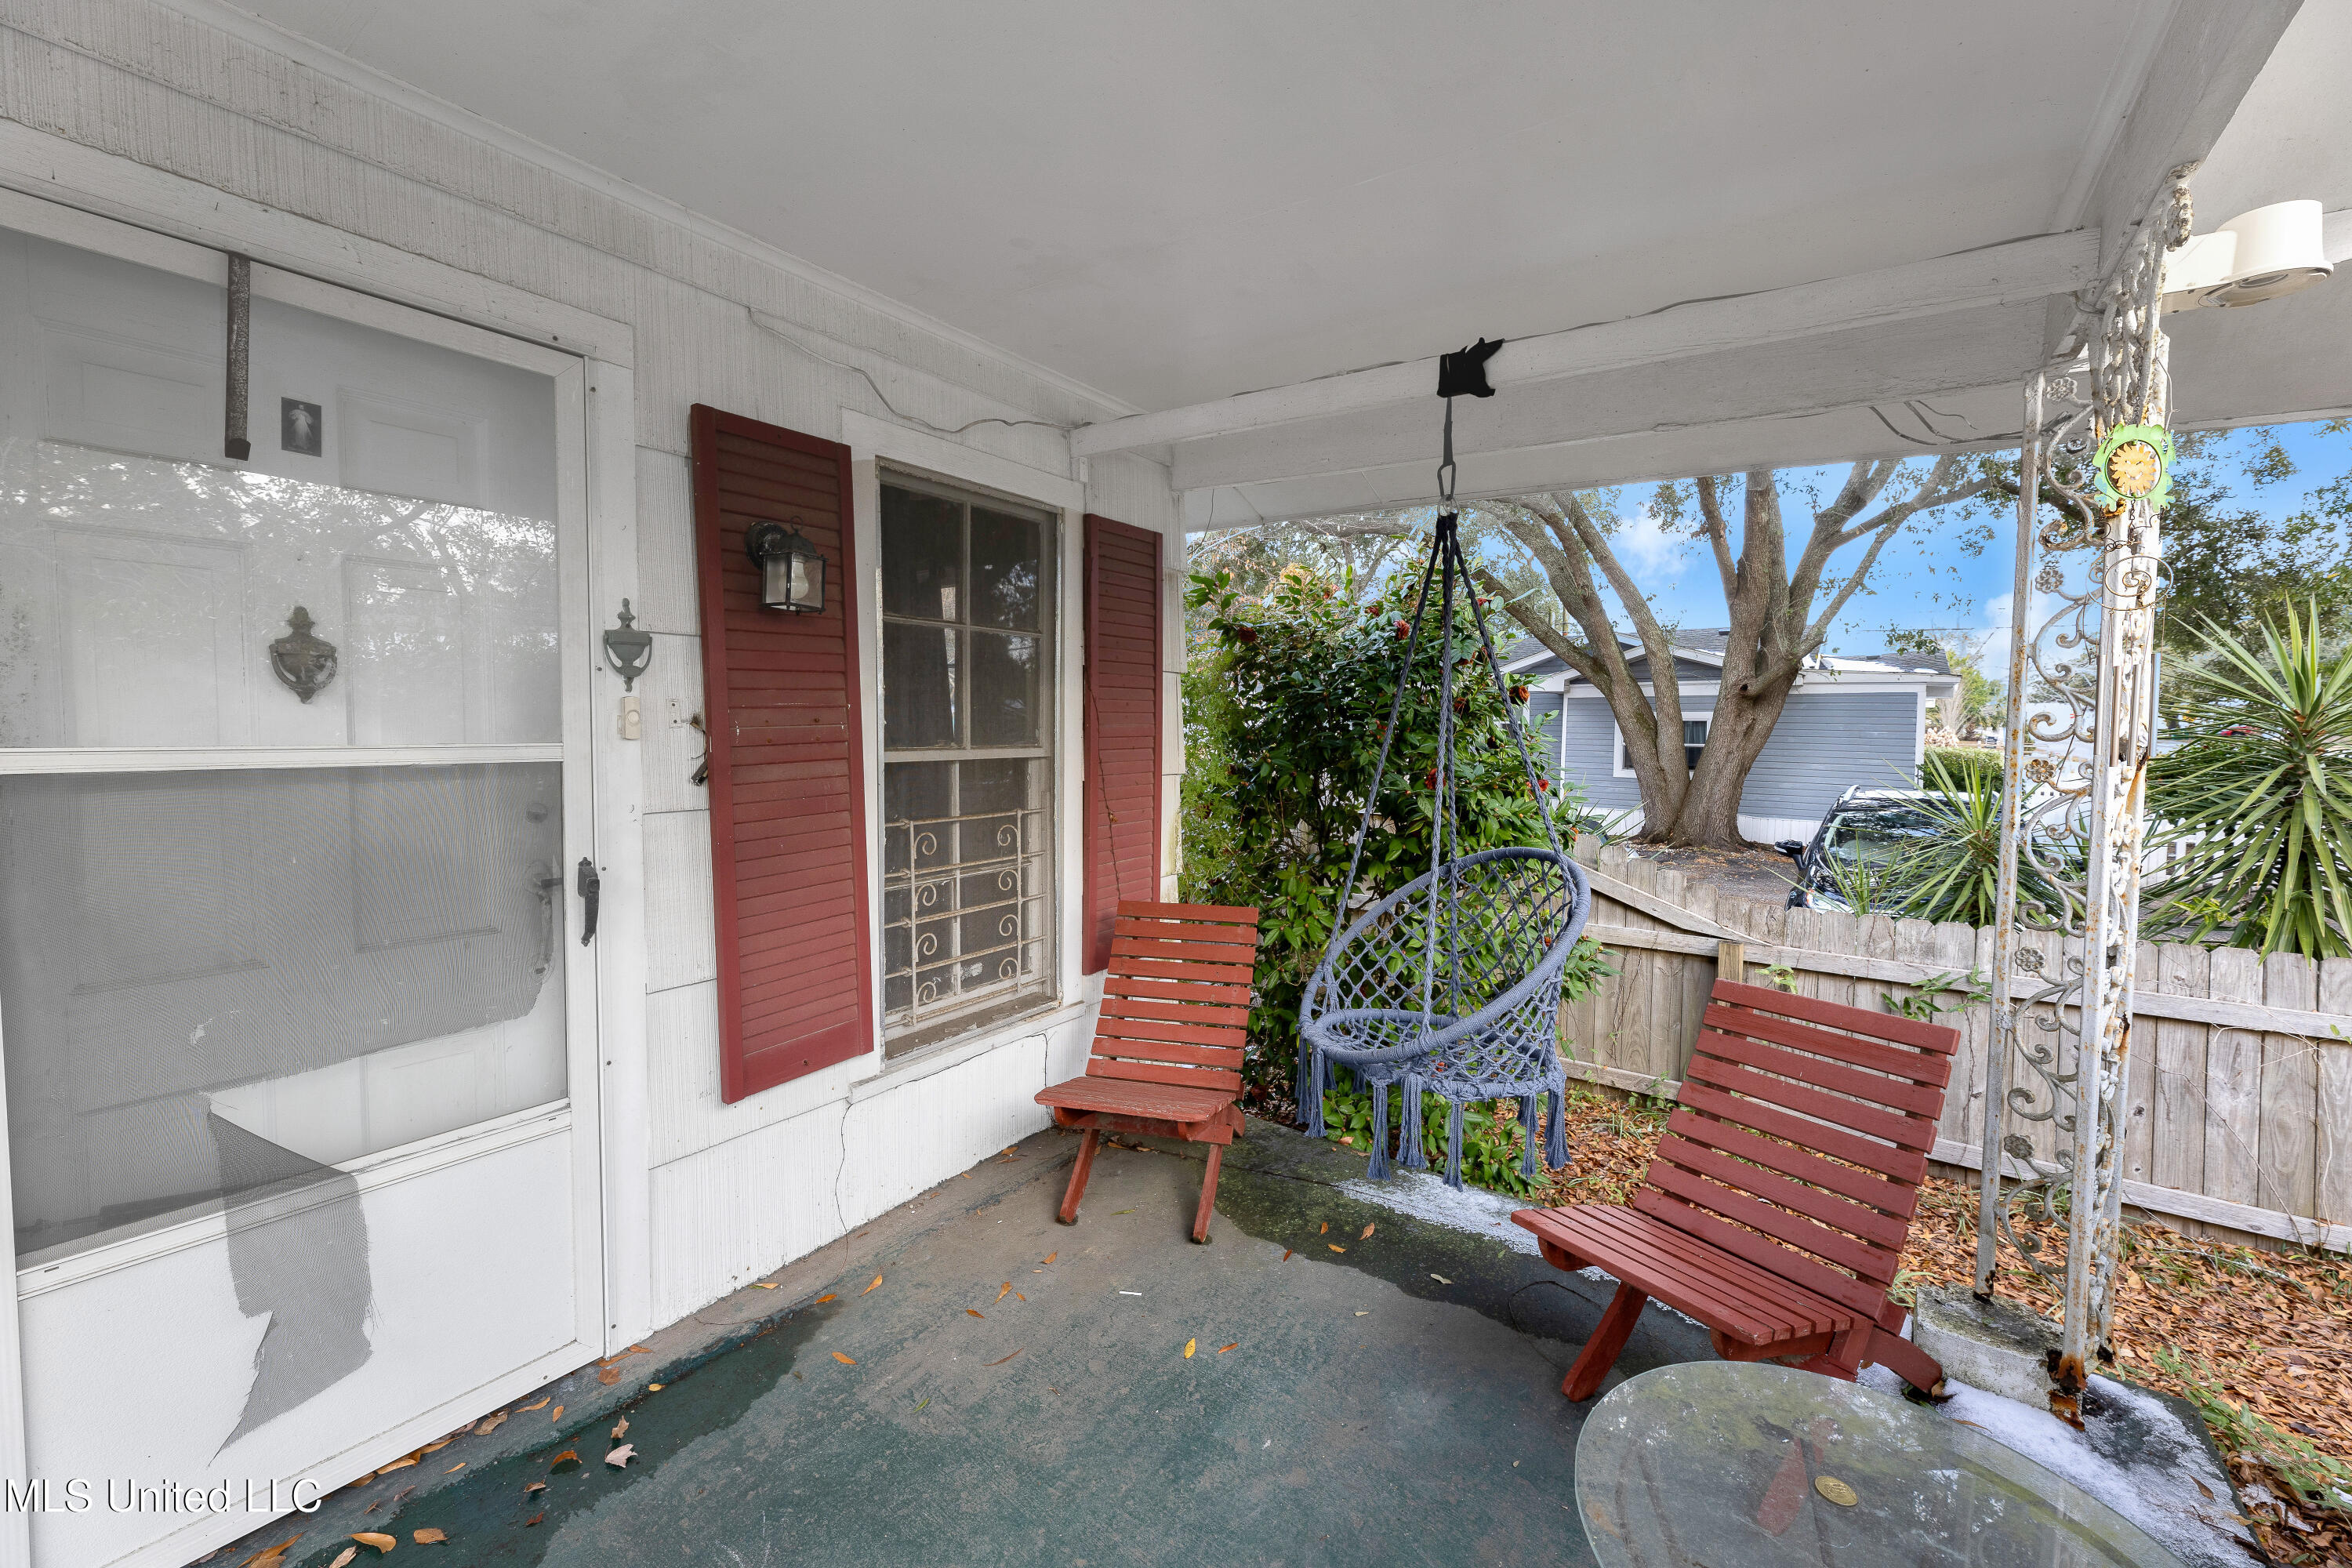
$49,900
3
bds
|
1
ba
|
0
sqft
|
built
1950
1111 Woodward Ave, Gulfport, MS 39501
$777
Cash flow
18.1%
Cash-on-Cash Return
18.7%
Cap rate
2.4%
Rent to Value Ratio
298 out of 325 properties for sale in Gulfport, MS
Limited Results Shown
Create a free account, or log in to reveal all property listings and enjoy the complete experience.

Active
$274,000
4
bds
|
3
ba
|
0
sqft
|
built
1955
625 Loposser Ave, Gulfport, MS 39507
$495
Cash flow
9.4%
Cash-on-Cash Return
7.8%
Cap rate
1.0%
Rent to Value Ratio
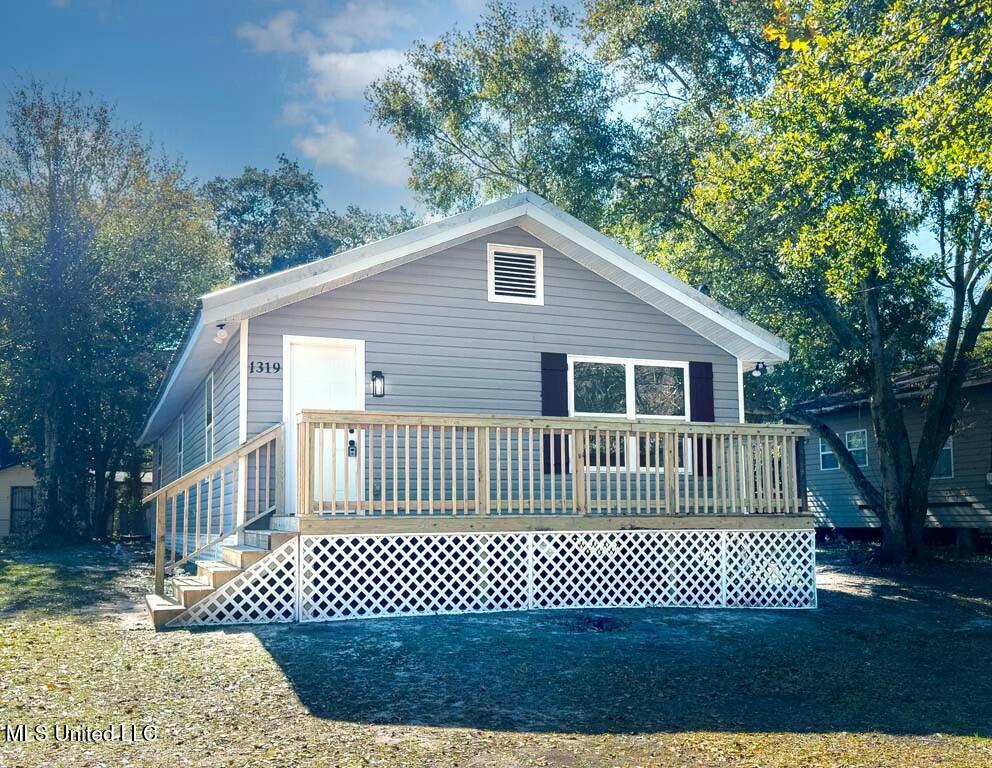
Active
$159,500
3
bds
|
2
ba
|
0
sqft
|
built
1940
1319 20th St, Gulfport, MS 39501
$487
Cash flow
15.9%
Cash-on-Cash Return
9.3%
Cap rate
1.1%
Rent to Value Ratio
Active
$115,000
3
bds
|
2
ba
|
0
sqft
|
built
1955
1914 19th Ave, Gulfport, MS 39501
$378
Cash flow
17.1%
Cash-on-Cash Return
9.6%
Cap rate
1.2%
Rent to Value Ratio
Active
$49,900
3
bds
|
1
ba
|
0
sqft
|
built
1950
1111 Woodward Ave, Gulfport, MS 39501
$777
Cash flow
18.1%
Cash-on-Cash Return
18.7%
Cap rate
2.4%
Rent to Value Ratio

Active
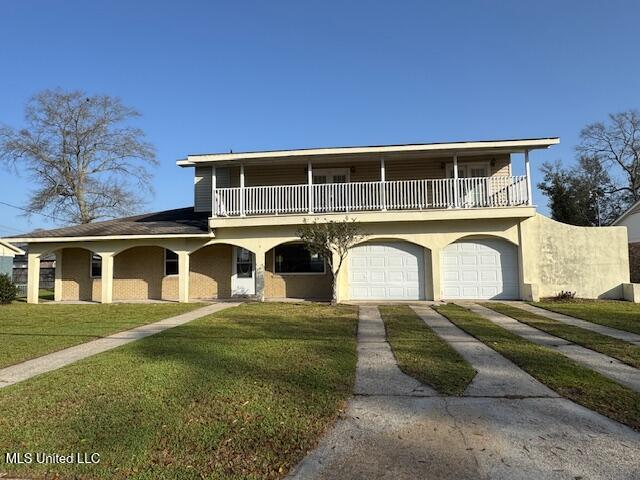
$425,000
3
bds
|
2
ba
|
0
sqft
|
built
2022
623 42nd Ave, Gulfport, MS 39501
$-326
Cash flow
-4.0%
Cash-on-Cash Return
4.8%
Cap rate
0.7%
Rent to Value Ratio

Active
$93,900
1
bds
|
1
ba
|
0
sqft
|
built
1973
413 Kahler St, Gulfport, MS 39507
$155
Cash flow
8.6%
Cash-on-Cash Return
7.7%
Cap rate
1.5%
Rent to Value Ratio

Pending
$197,000
3
bds
|
3
ba
|
0
sqft
|
built
1984
11206 Alden Cv, Gulfport, MS 39503
$348
Cash flow
9.2%
Cash-on-Cash Return
7.8%
Cap rate
1.0%
Rent to Value Ratio
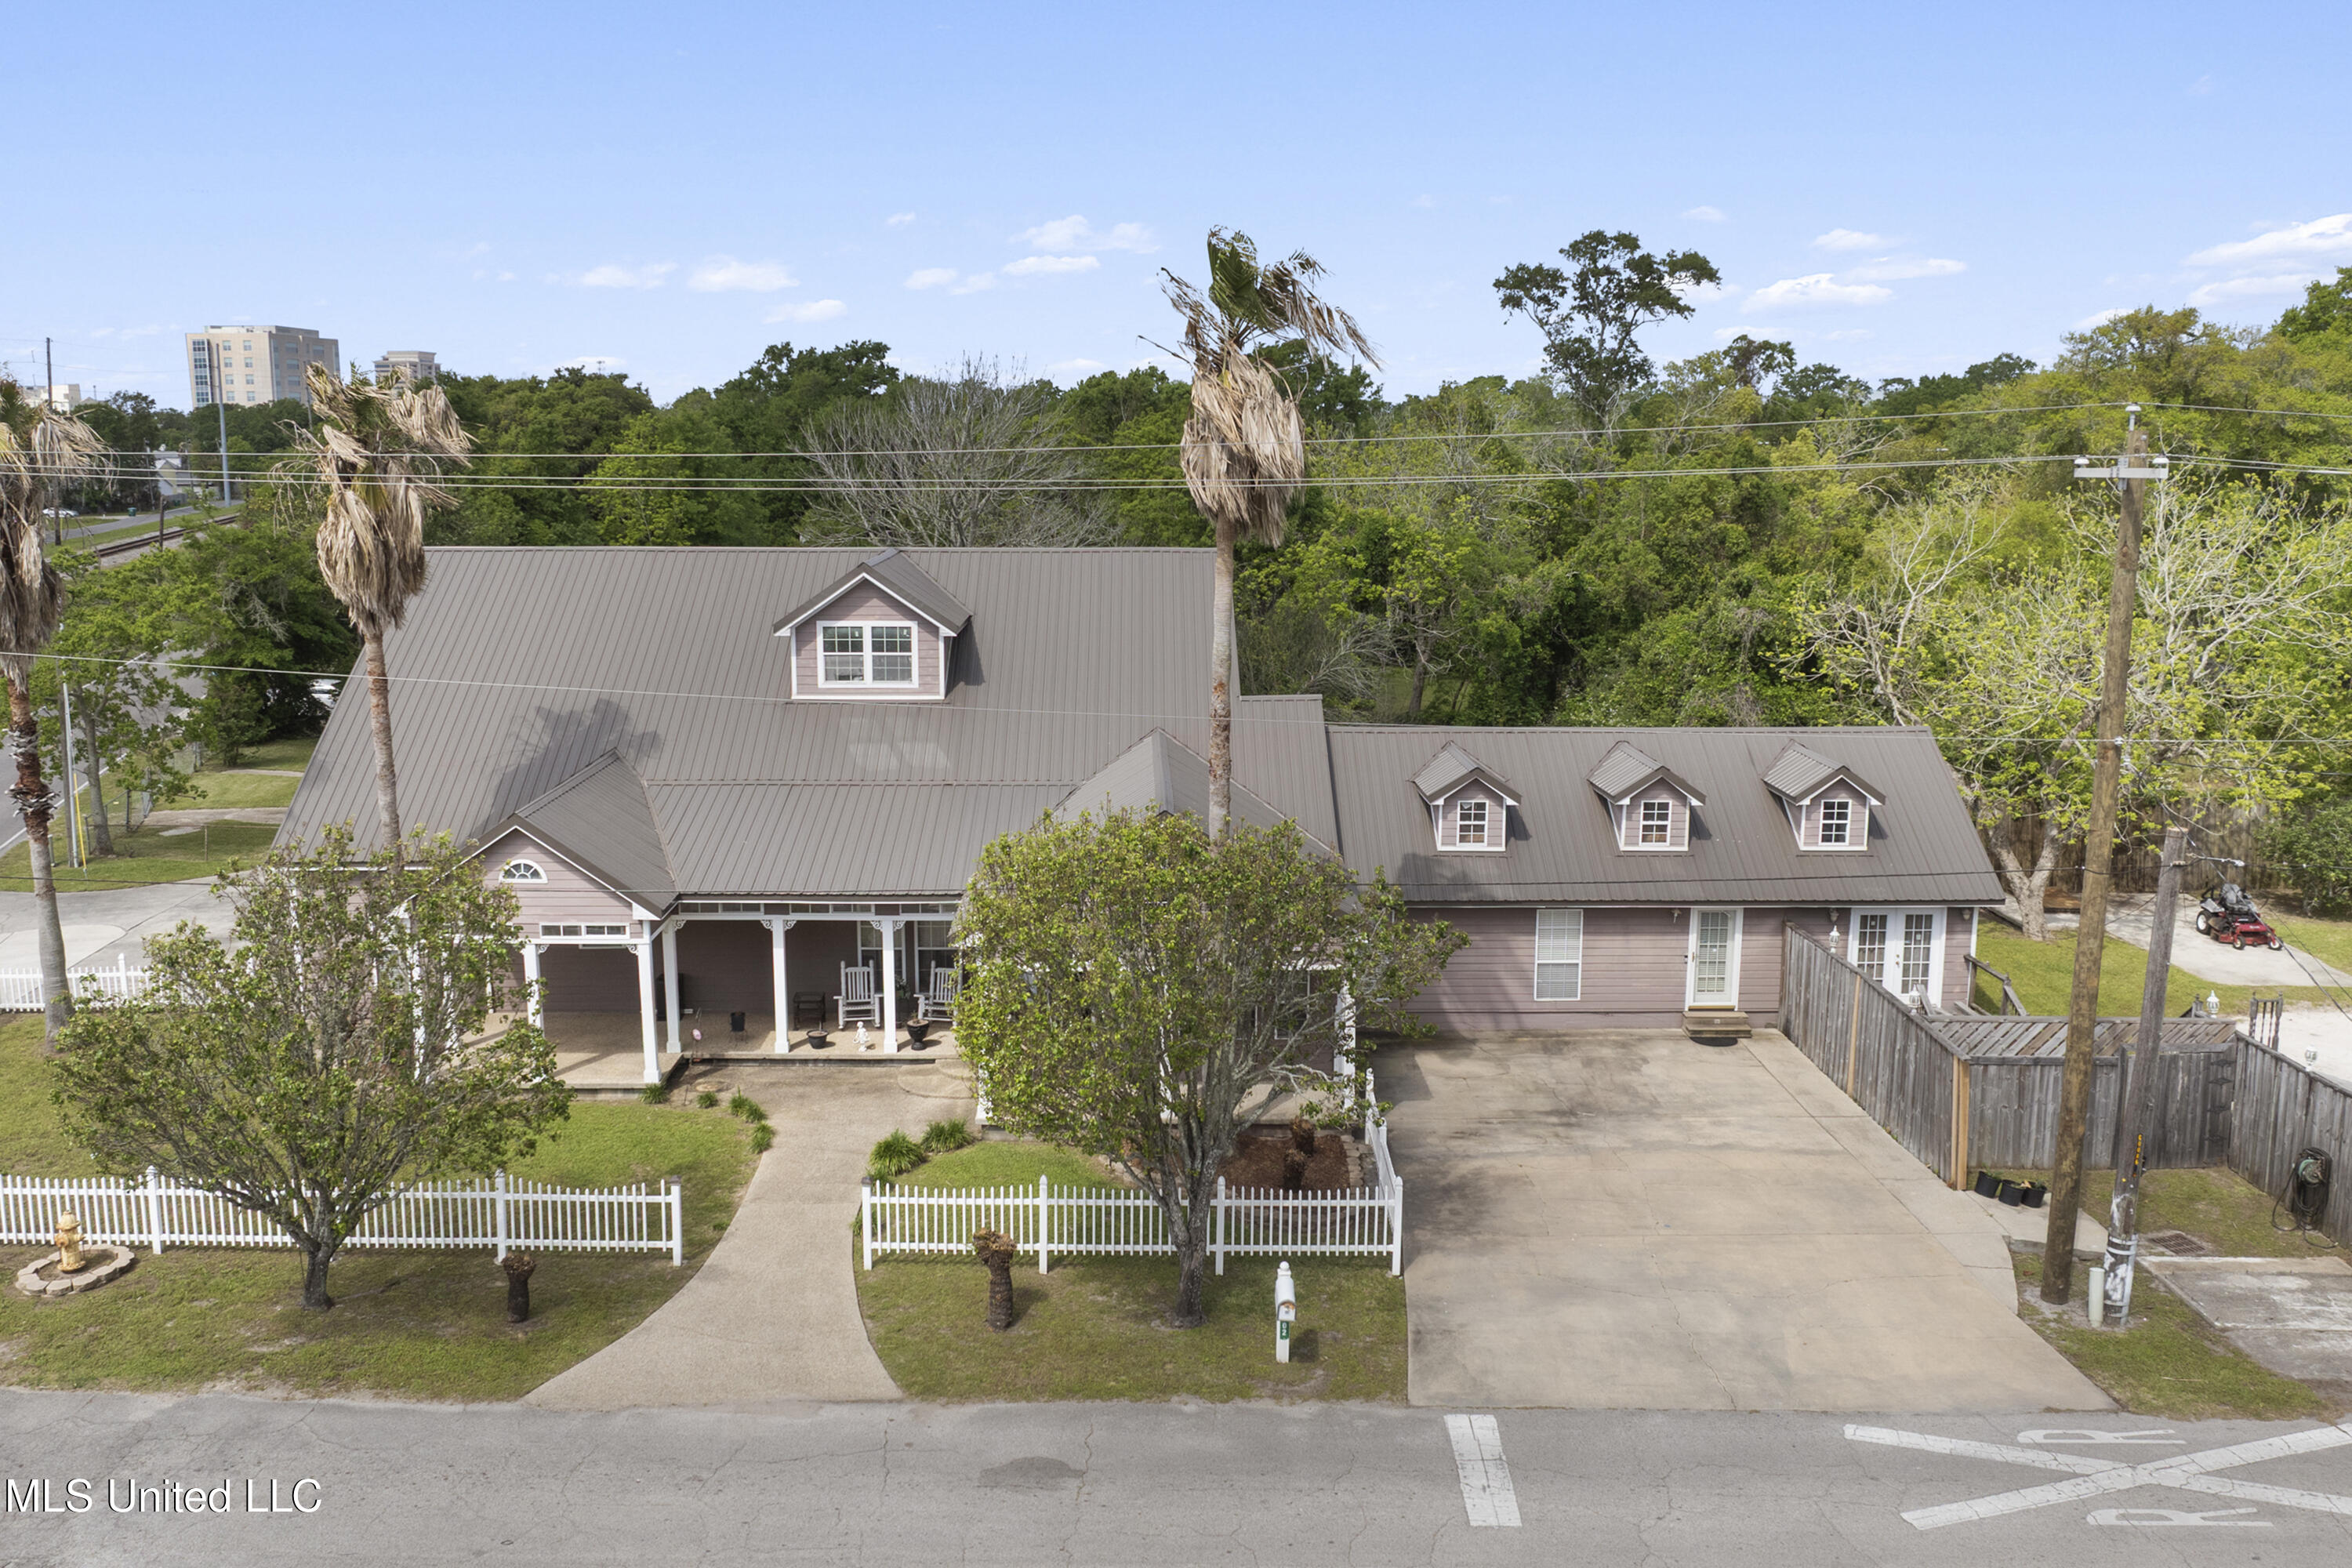
Active
$289,000
6
bds
|
2
ba
|
0
sqft
|
built
1940
1602 E Railroad St, Gulfport, MS 39501
$327
Cash flow
5.9%
Cash-on-Cash Return
7.0%
Cap rate
0.9%
Rent to Value Ratio
Active
$369,000
4
bds
|
2
ba
|
0
sqft
|
built
1995
1296 John Evans Dr, Gulfport, MS 39507
$-101
Cash flow
-1.4%
Cash-on-Cash Return
5.3%
Cap rate
0.7%
Rent to Value Ratio

Active
$140,000
2
bds
|
1
ba
|
0
sqft
|
built
1960
1015 Joseph Ave, Gulfport, MS 39501
$67
Cash flow
2.5%
Cash-on-Cash Return
6.3%
Cap rate
0.9%
Rent to Value Ratio

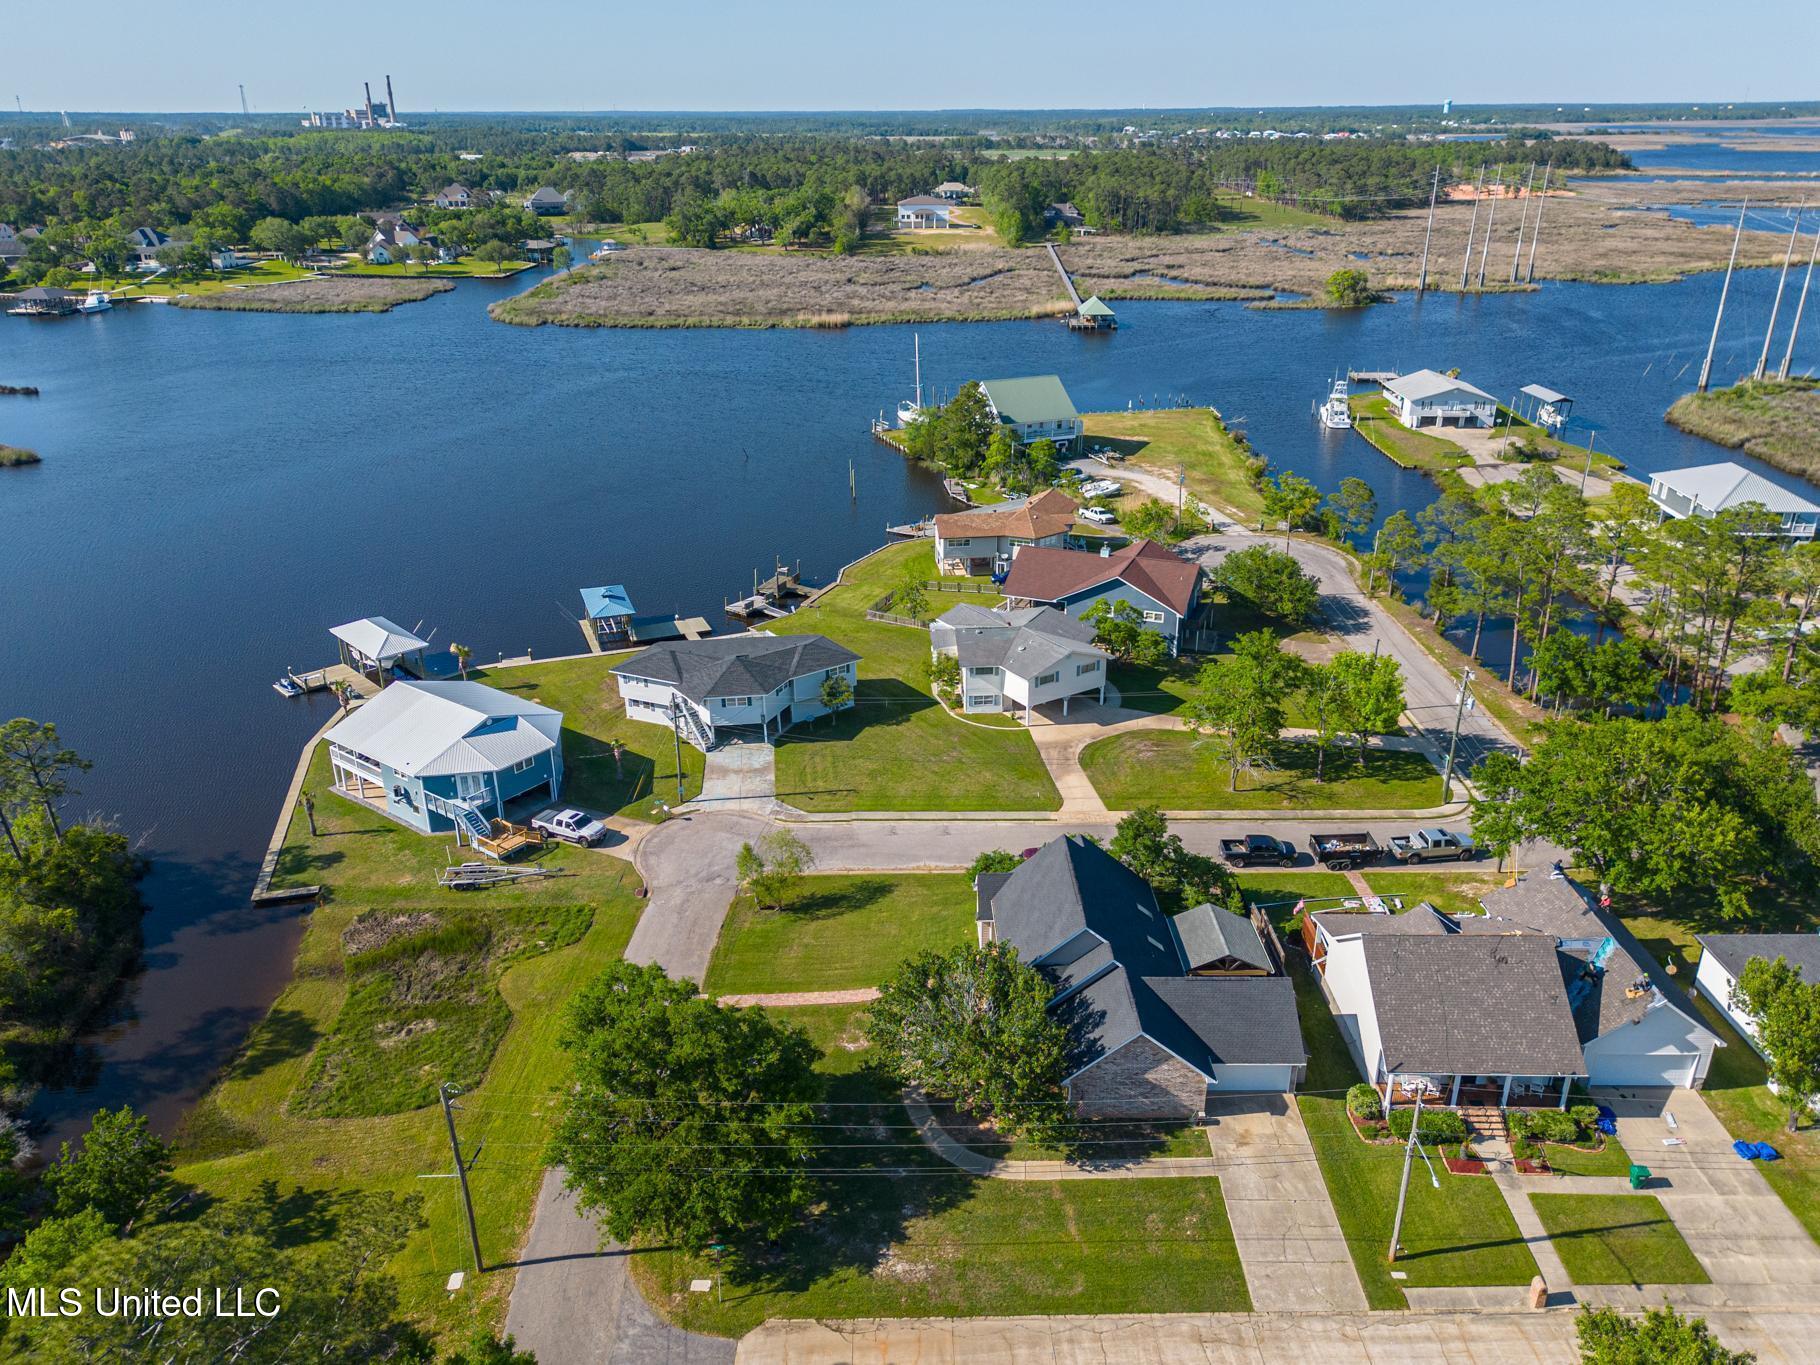
Active
$575,000
4
bds
|
3
ba
|
0
sqft
|
built
1995
11 Riversbend Dr, Gulfport, MS 39507
$-558
Cash flow
-5.1%
Cash-on-Cash Return
4.5%
Cap rate
0.7%
Rent to Value Ratio

$188,600
BiggerPockets Estimate
Our estimate offers a data-driven snapshot of this property’s current market value, using available information about the home and local trends.
BiggerPockets estimate
BiggerPockets Estimate
Our estimate offers a data-driven snapshot of this property’s current market value, using available information about the home and local trends.
BiggerPockets estimate
3
bds
|
2
ba
|
1,465
sqft
|
built
1925
4314 Lewis St, Gulfport, MS 39501
$199
Cash flow
5.5%
Cash-on-Cash Return
6.9%
Cap rate
1.0%
Rent to Value Ratio

Active
$338,500
4
bds
|
3
ba
|
0
sqft
|
built
2019
14920 N Swan Rd, Gulfport, MS 39503
$10
Cash flow
0.2%
Cash-on-Cash Return
5.7%
Cap rate
0.7%
Rent to Value Ratio
Active
$385,000
4
bds
|
2
ba
|
0
sqft
|
built
2001
12320 Fox Forrest Dr, Gulfport, MS 39503
$60
Cash flow
0.8%
Cash-on-Cash Return
5.9%
Cap rate
0.8%
Rent to Value Ratio
Active
$589,000
5
bds
|
3
ba
|
0
sqft
|
built
1955
4117 Franklin Ave, Gulfport, MS 39507
$-1,153
Cash flow
-10.2%
Cash-on-Cash Return
3.3%
Cap rate
0.5%
Rent to Value Ratio
Active
$308,999
3
bds
|
2
ba
|
1,771
sqft
|
built
2001
2252 Beach Dr, Gulfport, MS 39507
$332
Cash flow
5.6%
Cash-on-Cash Return
7.0%
Cap rate
0.8%
Rent to Value Ratio

Active
$315,000
3
bds
|
2
ba
|
0
sqft
|
built
2022
1526 E Railroad St, Gulfport, MS 39501
$122
Cash flow
2.0%
Cash-on-Cash Return
6.1%
Cap rate
0.9%
Rent to Value Ratio
Pending
$320,000
3
bds
|
3
ba
|
0
sqft
|
built
1978
17141 Robinson Rd, Gulfport, MS 39503
$138
Cash flow
2.3%
Cash-on-Cash Return
6.2%
Cap rate
0.8%
Rent to Value Ratio
Pending
$69,000
2
bds
|
1
ba
|
0
sqft
|
built
1965
1915 21st Ave, Gulfport, MS 39501
$1,035
Cash flow
17.5%
Cash-on-Cash Return
18.0%
Cap rate
2.2%
Rent to Value Ratio
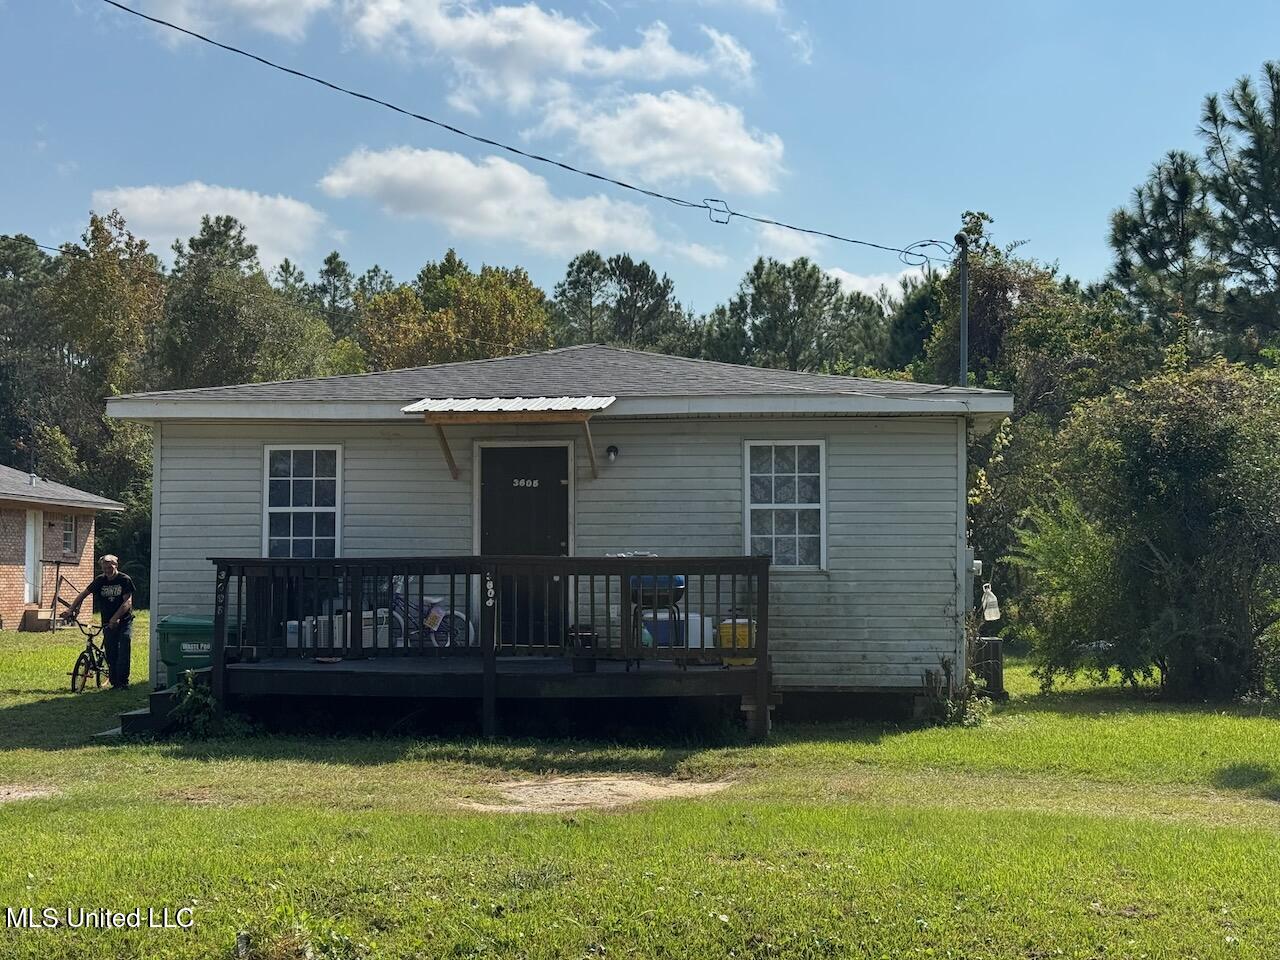
Active
$85,000
3
bds
|
1
ba
|
0
sqft
|
built
1960
3605 Ganges St, Gulfport, MS 39501
$379
Cash flow
23.3%
Cash-on-Cash Return
11.0%
Cap rate
1.4%
Rent to Value Ratio
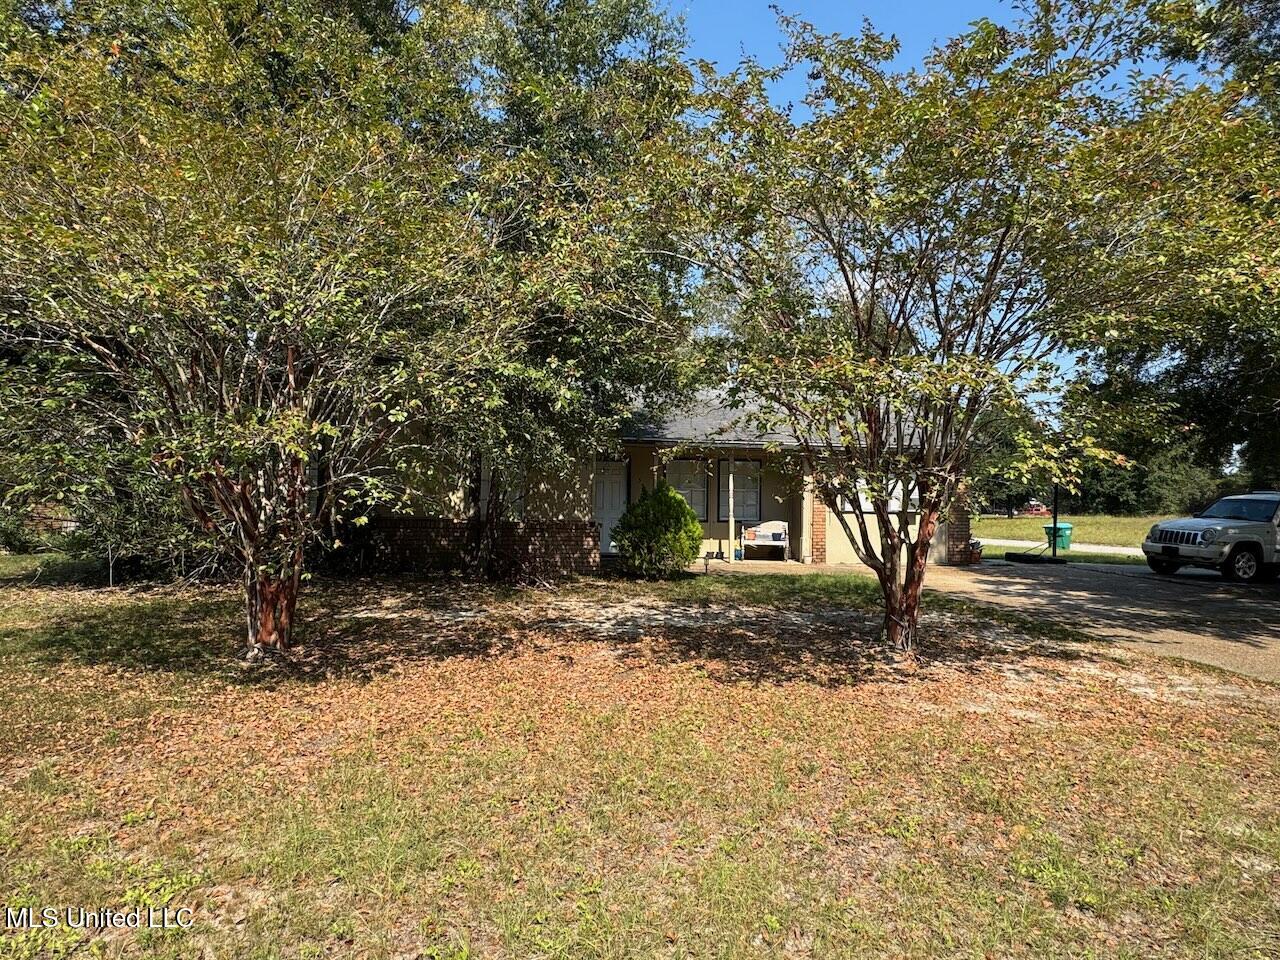
Active
$139,000
3
bds
|
1
ba
|
0
sqft
|
built
1981
534 N Forest Dr, Gulfport, MS 39507
$202
Cash flow
7.6%
Cash-on-Cash Return
7.4%
Cap rate
1.0%
Rent to Value Ratio

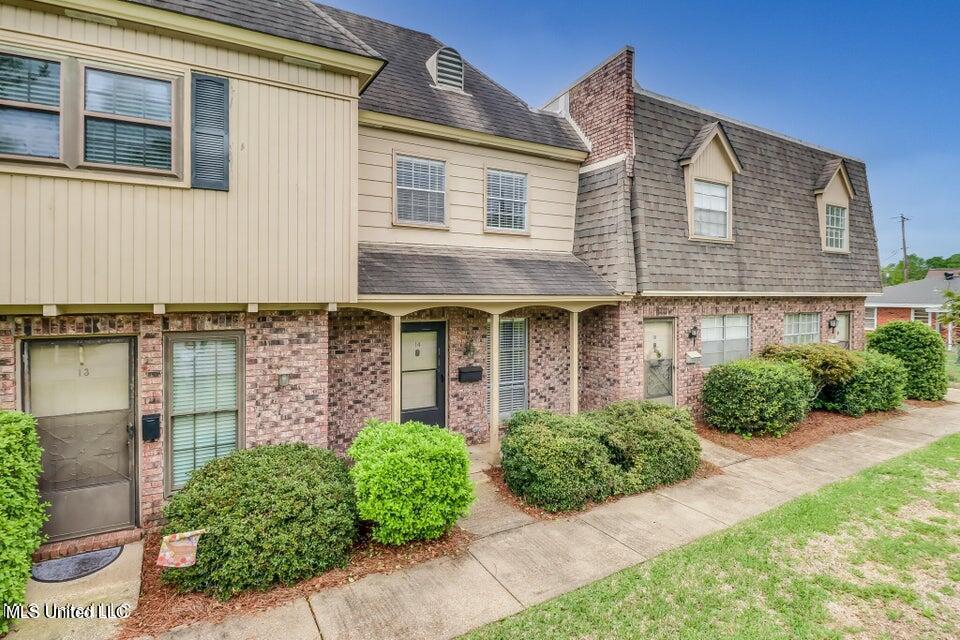
Active
$182,500
2
bds
|
3
ba
|
0
sqft
|
built
1975
26 Independence Dr, Gulfport, MS 39507
$95
Cash flow
2.7%
Cash-on-Cash Return
6.3%
Cap rate
0.8%
Rent to Value Ratio

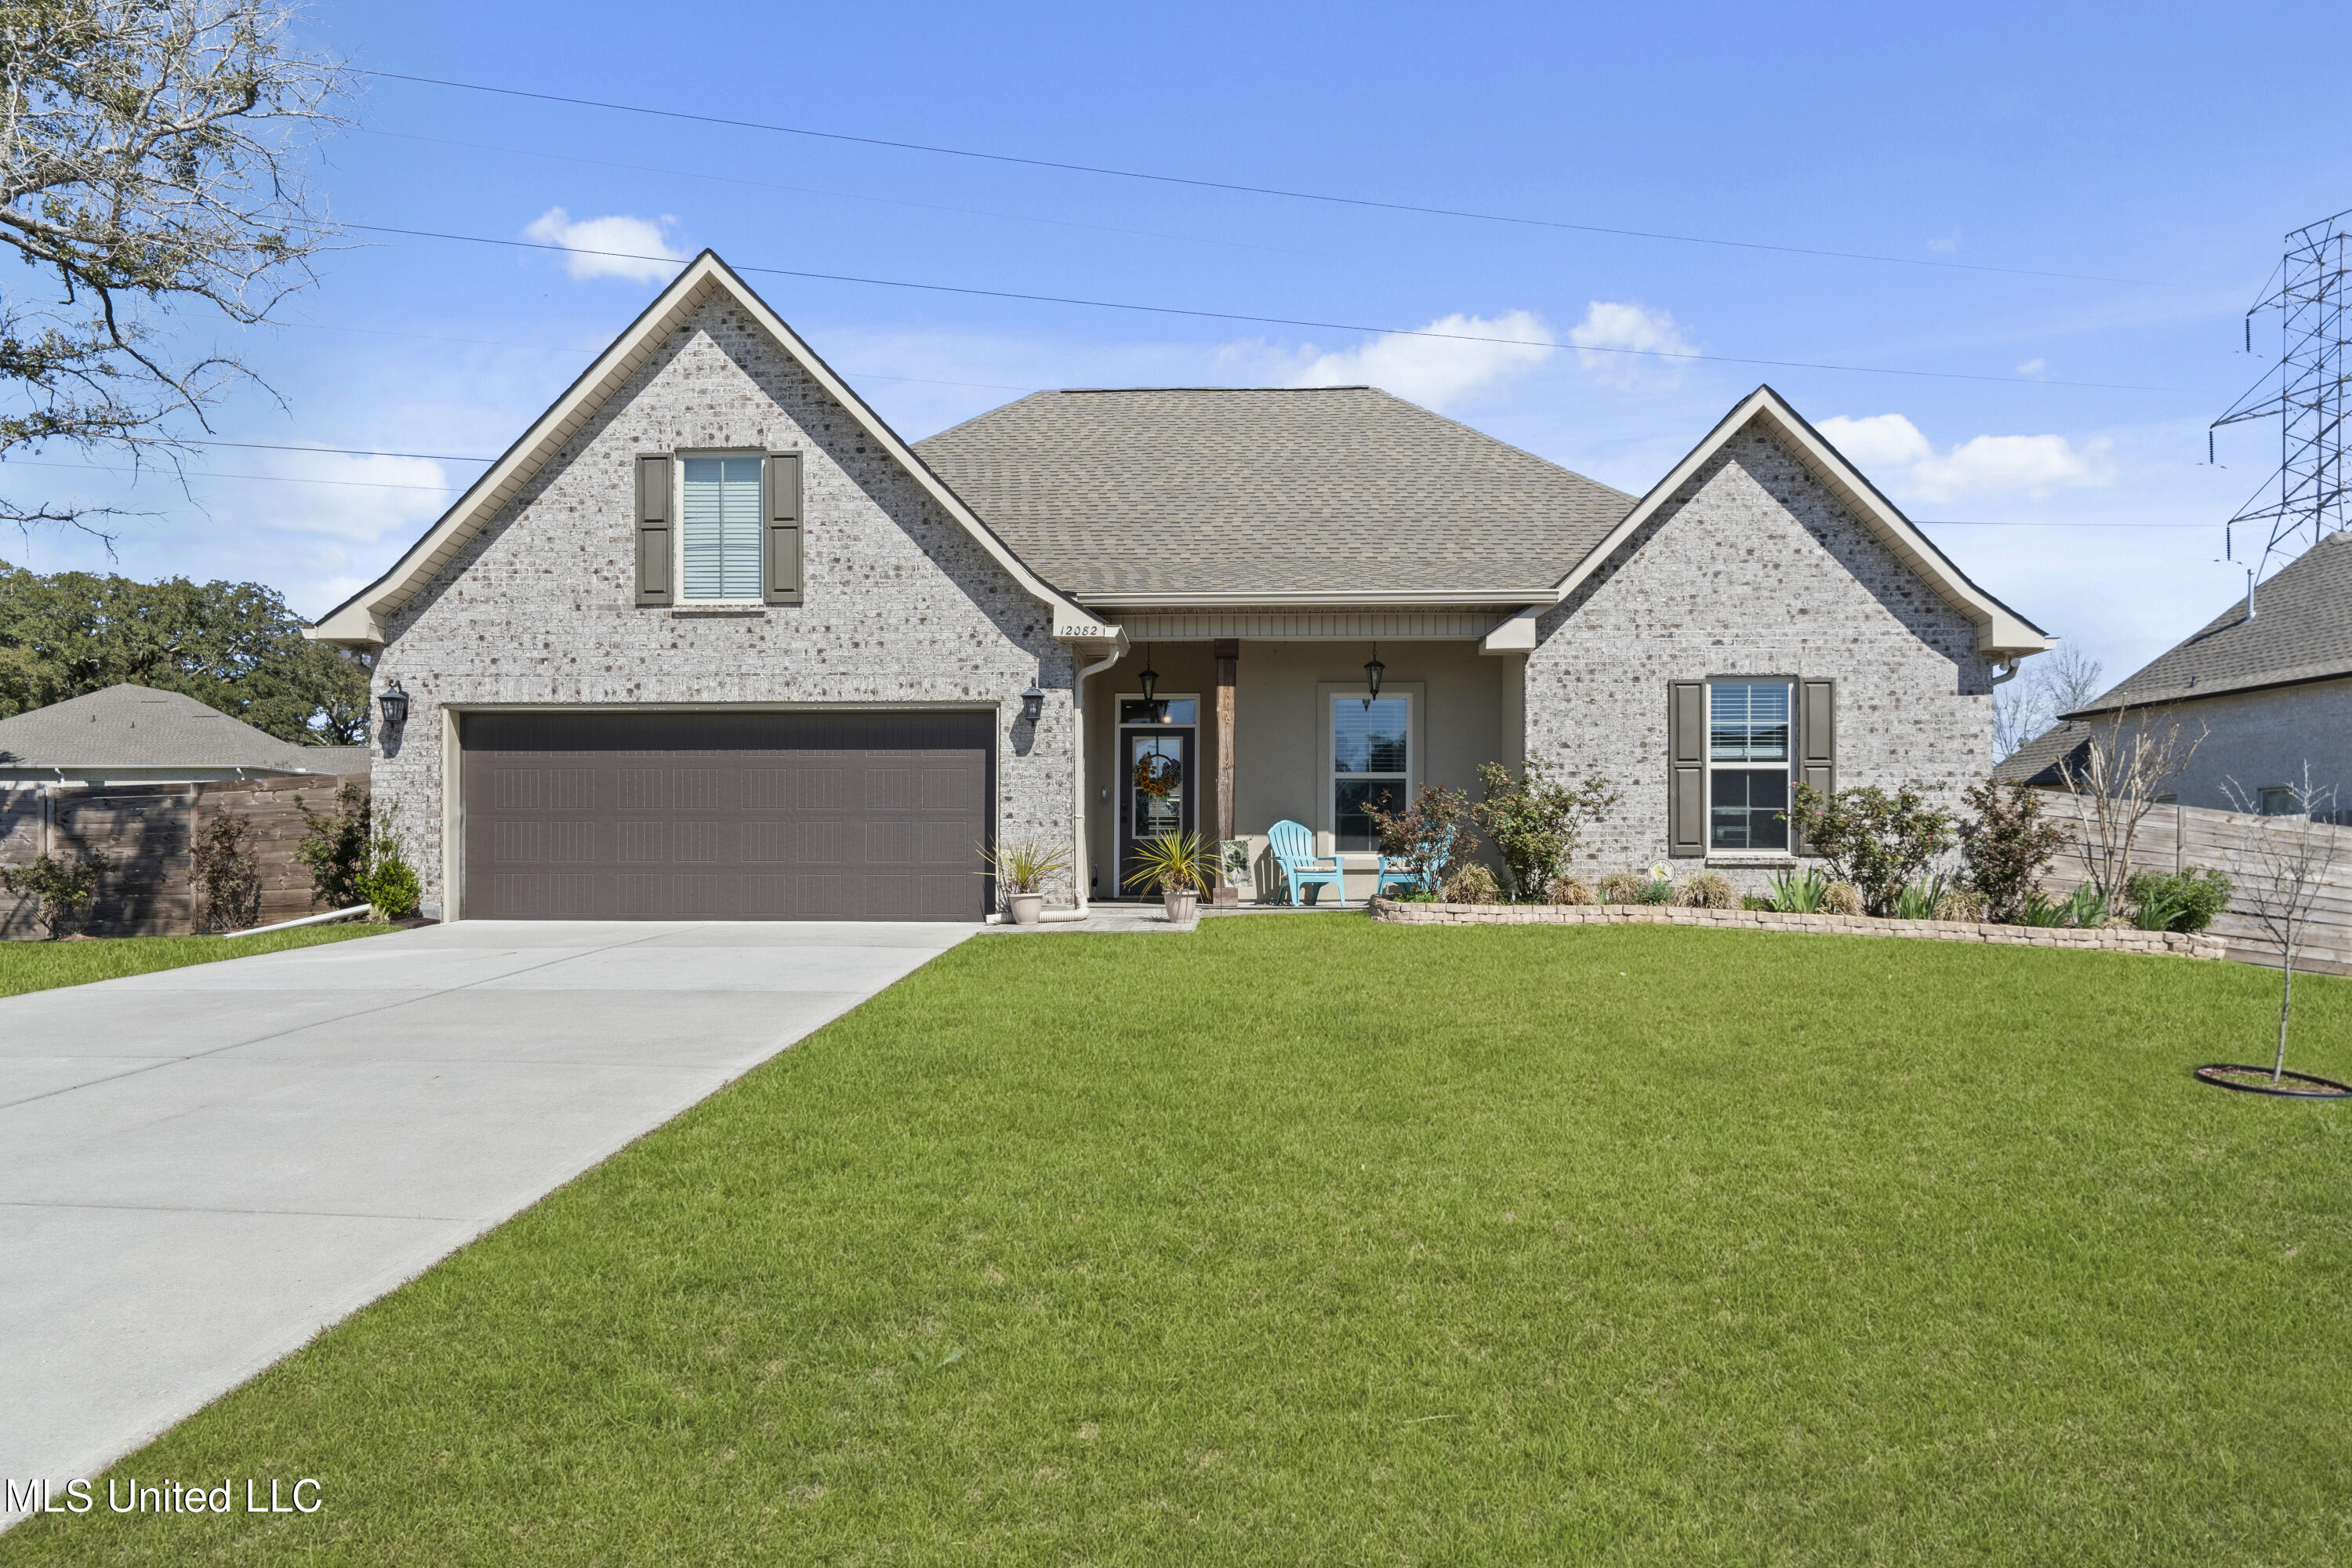
Active
$219,900
4
bds
|
2
ba
|
0
sqft
|
built
1980
12082 Marlane Pl, Gulfport, MS 39503
$227
Cash flow
5.4%
Cash-on-Cash Return
6.9%
Cap rate
0.9%
Rent to Value Ratio

Active
$237,500
3
bds
|
2
ba
|
0
sqft
|
built
1995
19374 Northridge Dr, Gulfport, MS 39503
$23
Cash flow
0.5%
Cash-on-Cash Return
5.8%
Cap rate
0.7%
Rent to Value Ratio
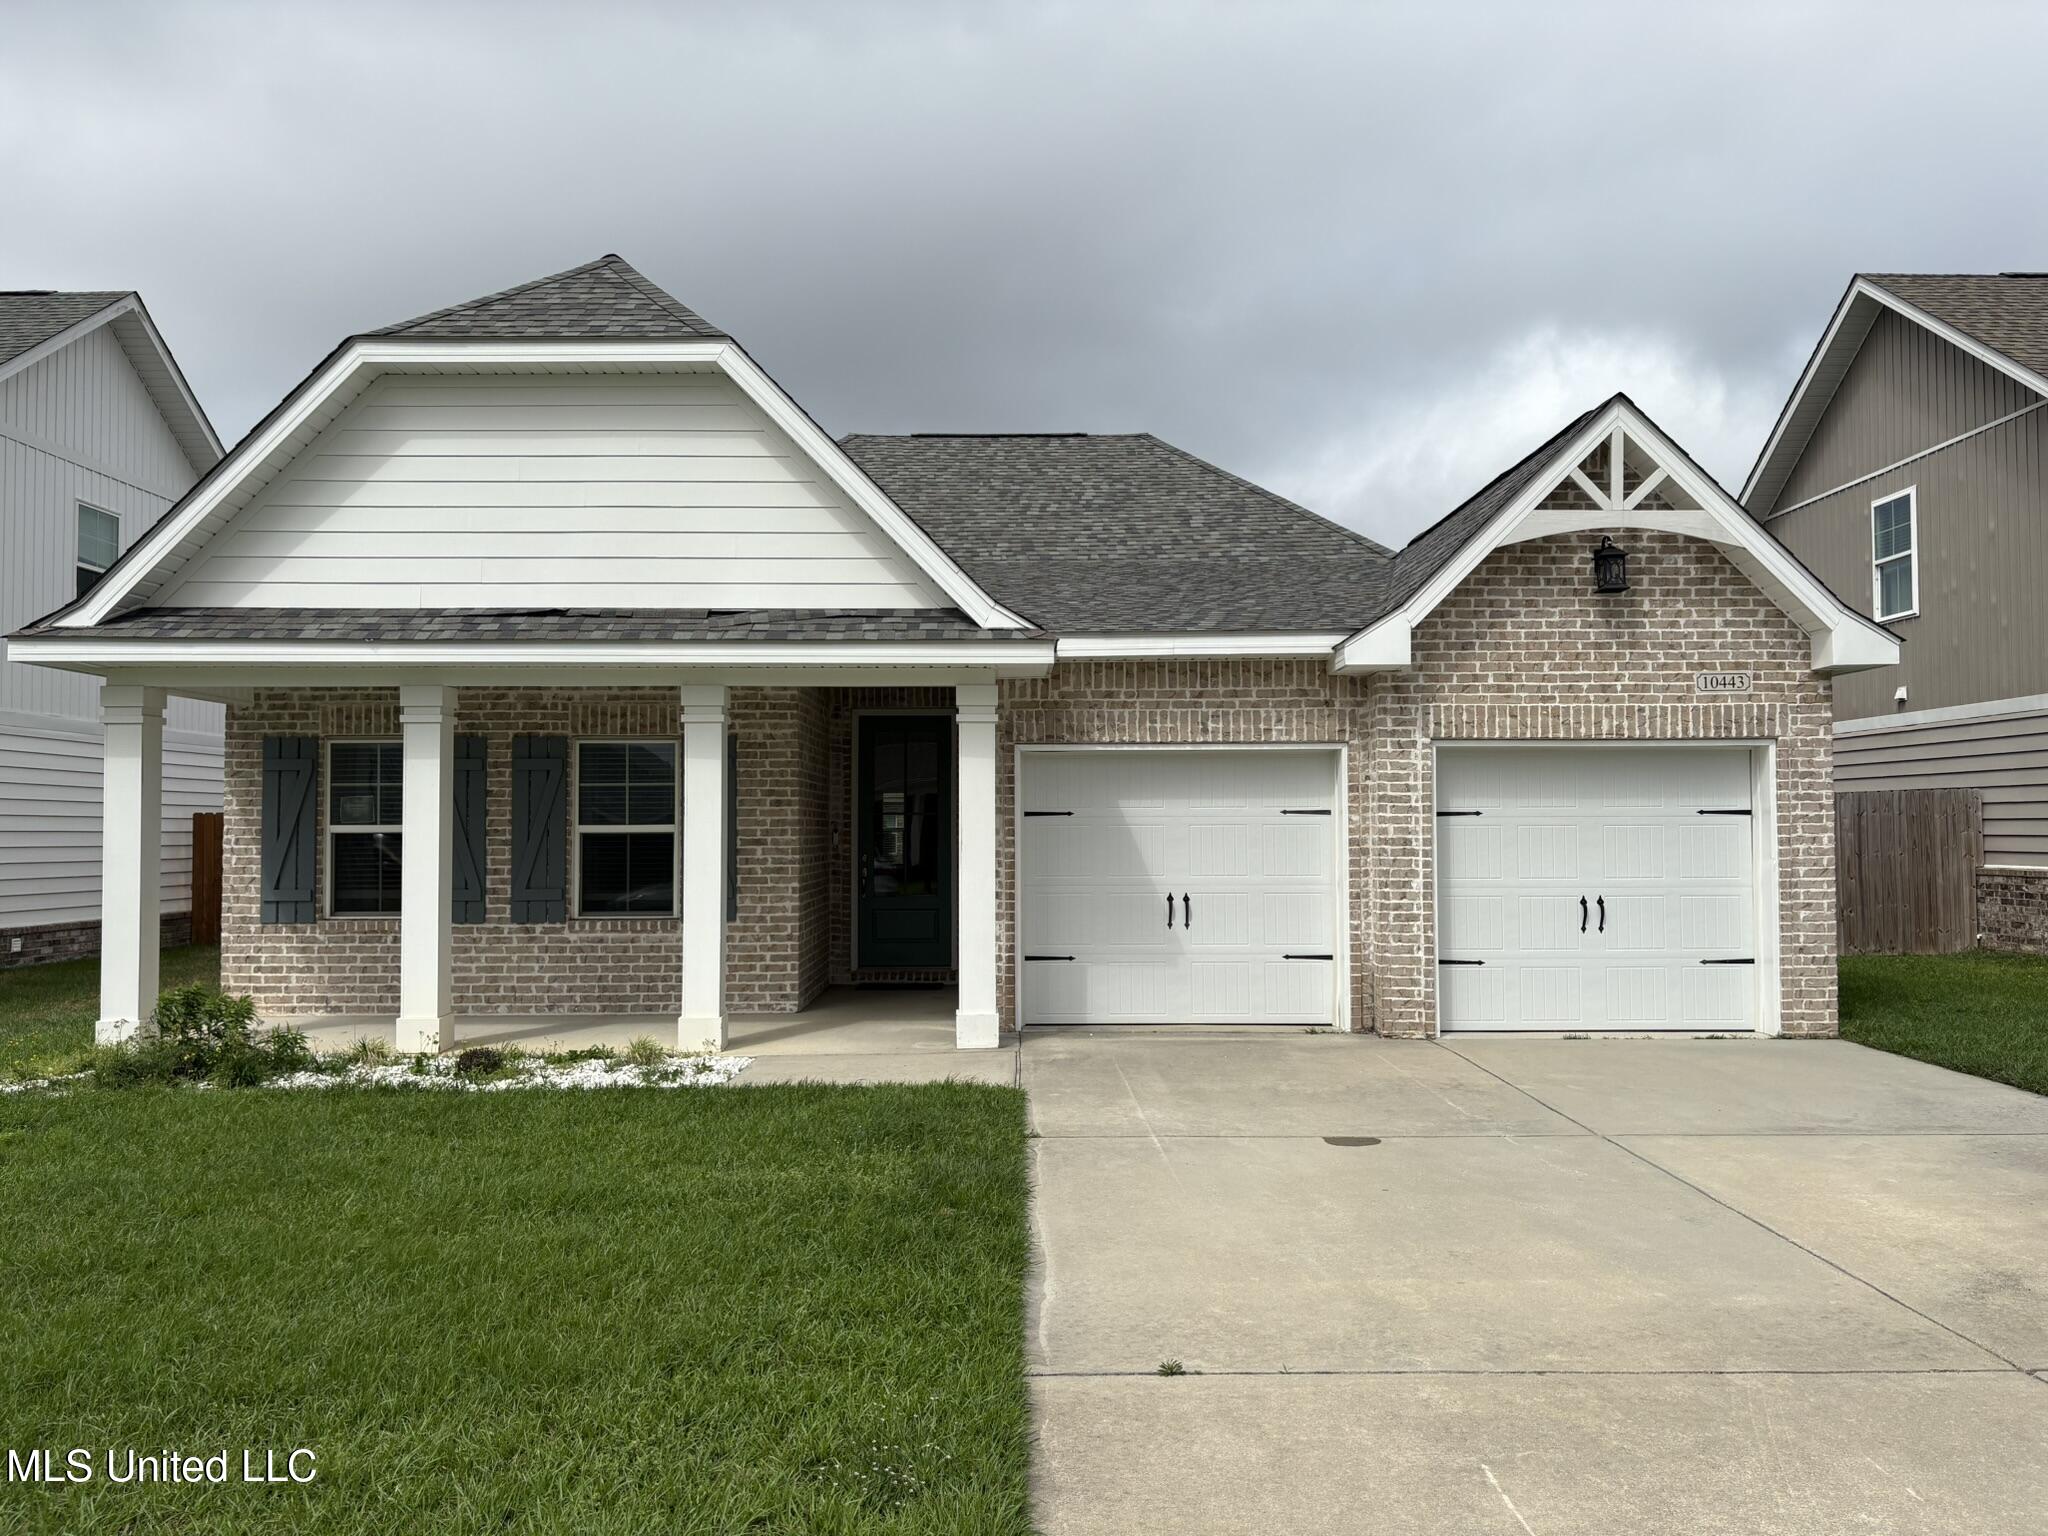
Active
$279,900
3
bds
|
2
ba
|
0
sqft
|
built
2021
10443 W Landon Green Cir, Gulfport, MS 39503
$-35
Cash flow
-0.7%
Cash-on-Cash Return
5.5%
Cap rate
0.8%
Rent to Value Ratio

Active
$339,500
3
bds
|
2
ba
|
0
sqft
|
built
1950
4464 Kendall Cir, Gulfport, MS 39507
$-297
Cash flow
-4.6%
Cash-on-Cash Return
4.6%
Cap rate
0.6%
Rent to Value Ratio

Active
$253,500
3
bds
|
2
ba
|
0
sqft
|
built
1970
2 Lexington Pl, Gulfport, MS 39507
$140
Cash flow
2.9%
Cash-on-Cash Return
6.3%
Cap rate
0.8%
Rent to Value Ratio

Active
$1,195,000
5
bds
|
5
ba
|
0
sqft
|
built
2023
11006 Georgian Way, Gulfport, MS 39503
$-2,748
Cash flow
-12.0%
Cash-on-Cash Return
2.9%
Cap rate
0.5%
Rent to Value Ratio
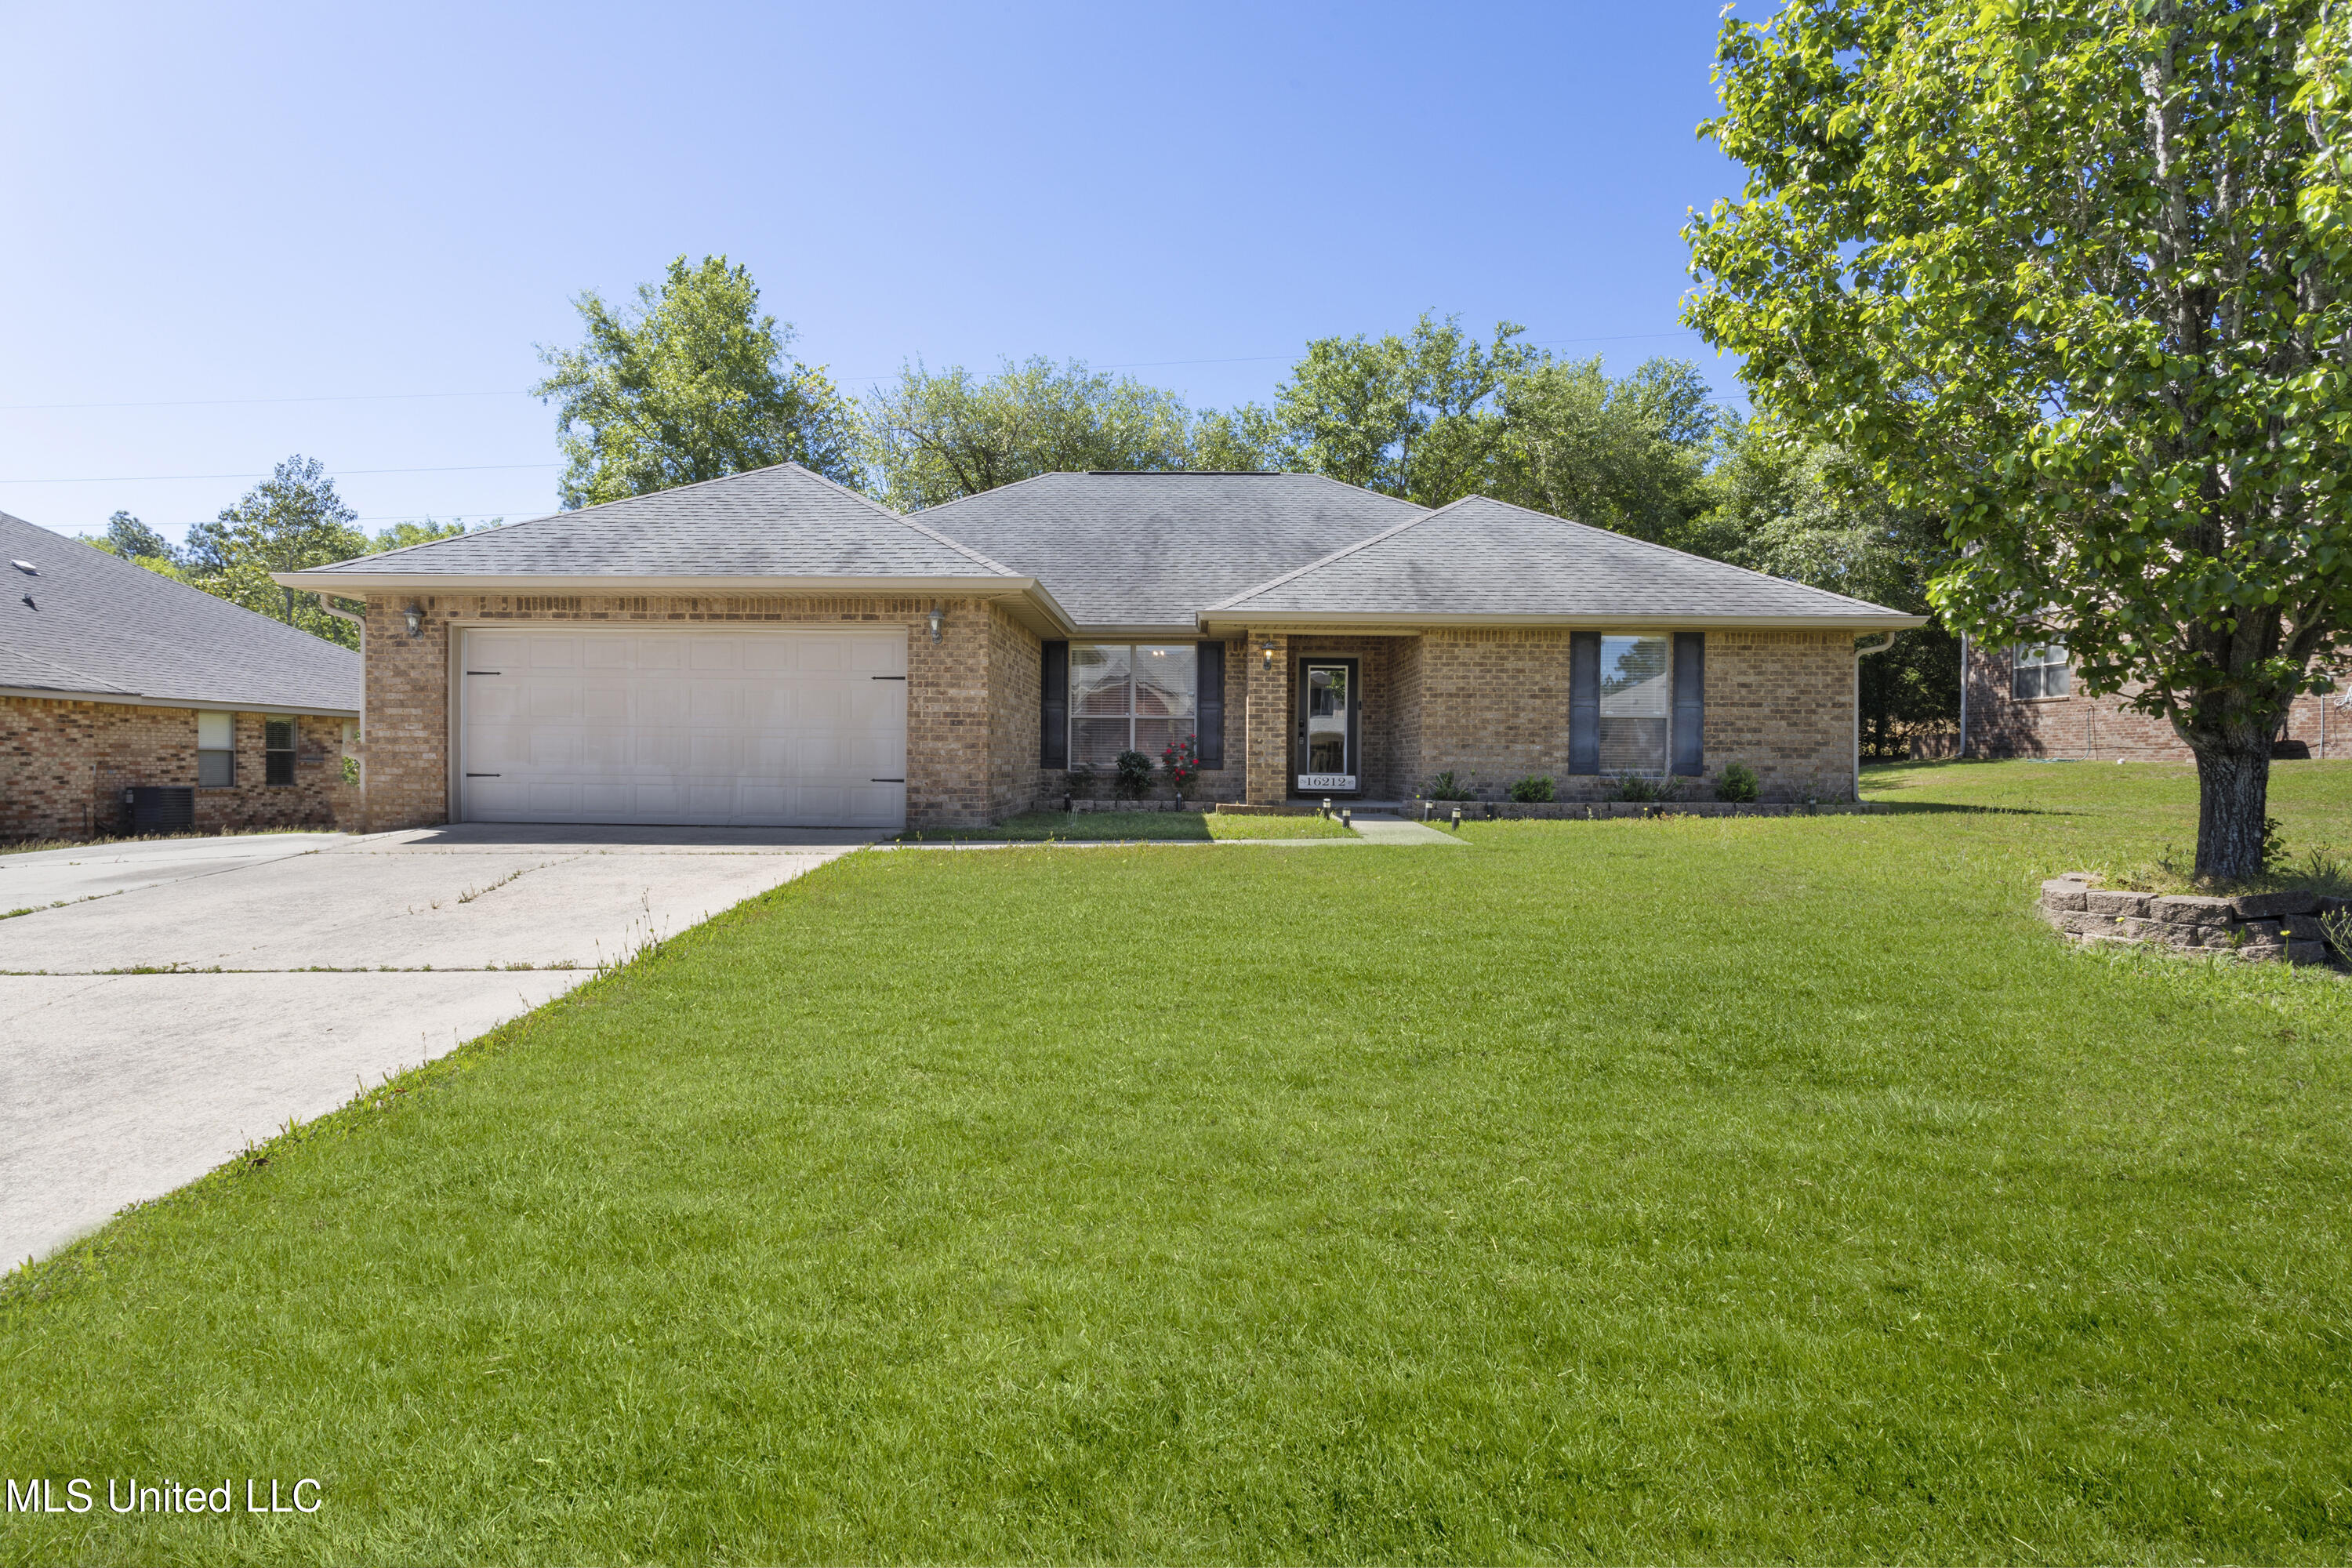
Active
$284,900
4
bds
|
3
ba
|
0
sqft
|
built
2009
16212 Walker Farm Ln, Gulfport, MS 39503
$173
Cash flow
3.2%
Cash-on-Cash Return
6.4%
Cap rate
0.9%
Rent to Value Ratio

Active
$175,000
3
bds
|
2
ba
|
0
sqft
|
built
2008
11300 Jessica Dr, Gulfport, MS 39503
$314
Cash flow
9.4%
Cash-on-Cash Return
7.8%
Cap rate
1.0%
Rent to Value Ratio

Active
$99,900
2
bds
|
1
ba
|
0
sqft
|
built
1956
1705 Park Blvd, Gulfport, MS 39501
$402
Cash flow
21.0%
Cash-on-Cash Return
10.5%
Cap rate
1.4%
Rent to Value Ratio

Pending
$169,900
3
bds
|
2
ba
|
0
sqft
|
built
1970
214 Janelle Dr, Gulfport, MS 39503
$201
Cash flow
6.2%
Cash-on-Cash Return
7.1%
Cap rate
0.9%
Rent to Value Ratio
Active
$154,000
4
bds
|
2
ba
|
0
sqft
|
built
1969
2219 Gregory Blvd, Gulfport, MS 39507
n/a
Cash flow
n/a
Cash-on-Cash Return
n/a
Cap rate
n/a
Rent to Value Ratio
Active
$222,500
2
bds
|
2
ba
|
0
sqft
|
built
1950
805 42nd Ave, Gulfport, MS 39501
$-38
Cash flow
-0.9%
Cash-on-Cash Return
5.5%
Cap rate
0.8%
Rent to Value Ratio
Active
$120,000
1
bds
|
1
ba
|
0
sqft
|
built
1973
413 Kahler St, Gulfport, MS 39507
$-110
Cash flow
-4.8%
Cash-on-Cash Return
4.6%
Cap rate
1.0%
Rent to Value Ratio

Active
$374,999
2
bds
|
2
ba
|
0
sqft
|
built
2023
13092 W Echo Dr, Gulfport, MS 39503
$-580
Cash flow
-8.1%
Cash-on-Cash Return
3.8%
Cap rate
0.5%
Rent to Value Ratio
Active
$379,900
4
bds
|
2
ba
|
0
sqft
|
built
2021
12082 Michael Grace Dr, Gulfport, MS 39503
$-262
Cash flow
-3.6%
Cash-on-Cash Return
4.9%
Cap rate
0.7%
Rent to Value Ratio
Active
$135,000
2
bds
|
2
ba
|
0
sqft
|
built
1973
413 Kahler St, Gulfport, MS 39507
$-67
Cash flow
-2.6%
Cash-on-Cash Return
5.1%
Cap rate
1.0%
Rent to Value Ratio
Active
$245,000
4
bds
|
3
ba
|
0
sqft
|
built
1972
12394 Cypress Dr, Gulfport, MS 39503
$254
Cash flow
5.4%
Cash-on-Cash Return
6.9%
Cap rate
0.9%
Rent to Value Ratio

Active
$674,000
4
bds
|
4
ba
|
0
sqft
|
built
1999
16 Lawrence Pl, Gulfport, MS 39507
$-2,054
Cash flow
-15.9%
Cash-on-Cash Return
2.0%
Cap rate
0.3%
Rent to Value Ratio