Gulfport, MS Investment Properties for Sale
Browse homes for sale and investment properties in Gulfport, MS. Refine your search by price, property type, or more.
Best cash flowing properties in Gulfport, MS
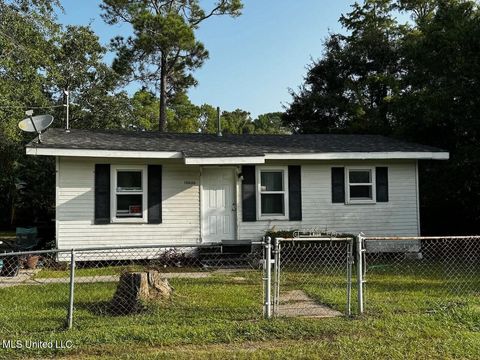
Active
$49,000
3
bds
|
1
ba
|
0
sqft
|
built
1940
15030 Polk St, Gulfport, MS 39501
$600
Cash flow
14.3%
Cash-on-Cash Return
14.7%
Cap rate
1.8%
Rent to Value Ratio

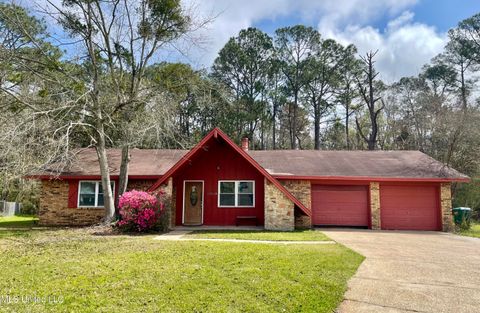
Active
$284,000
5
bds
|
4
ba
|
0
sqft
|
built
1968
2 Shady Side Cir, Gulfport, MS 39507
$447
Cash flow
8.2%
Cash-on-Cash Return
7.6%
Cap rate
1.0%
Rent to Value Ratio
329 out of 357 properties for sale in Gulfport, MS
Limited Results Shown
Create a free account, or log in to reveal all property listings and enjoy the complete experience.

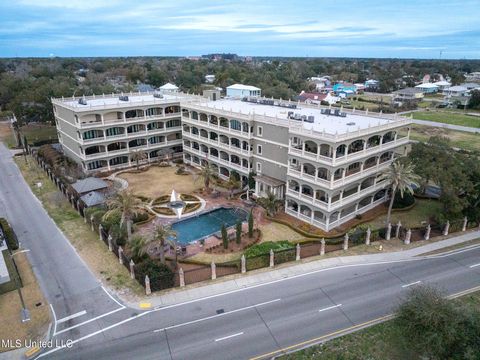
Active
$549,000
3
bds
|
3
ba
|
0
sqft
|
built
2005
4640 W Beach Blvd, Gulfport, MS 39501
$-1,553
Cash flow
-14.8%
Cash-on-Cash Return
2.3%
Cap rate
0.7%
Rent to Value Ratio

Active
$339,900
4
bds
|
4
ba
|
0
sqft
|
built
2020
10645 Chapelwood Dr, Gulfport, MS 39503
$-9
Cash flow
-0.1%
Cash-on-Cash Return
5.6%
Cap rate
0.8%
Rent to Value Ratio

Active
$377,277
4
bds
|
2
ba
|
0
sqft
|
built
2020
10485 E Landon Green Cir, Gulfport, MS 39503
$-360
Cash flow
-5.0%
Cash-on-Cash Return
4.5%
Cap rate
0.7%
Rent to Value Ratio
Active
$179,900
3
bds
|
3
ba
|
0
sqft
|
built
1978
15208 Cindy Cv, Gulfport, MS 39503
$251
Cash flow
7.3%
Cash-on-Cash Return
7.4%
Cap rate
1.0%
Rent to Value Ratio

Active
$560,000
4
bds
|
2
ba
|
0
sqft
|
built
2019
8776 Sundown Ln, Gulfport, MS 39503
$-781
Cash flow
-7.3%
Cash-on-Cash Return
4.0%
Cap rate
0.6%
Rent to Value Ratio

Active
$235,000
3
bds
|
3
ba
|
0
sqft
|
built
2007
1281 Century Oaks Dr, Gulfport, MS 39507
$-241
Cash flow
-5.4%
Cash-on-Cash Return
4.4%
Cap rate
0.7%
Rent to Value Ratio

Active
$1,120,000
4
bds
|
5
ba
|
0
sqft
|
built
2010
11534 Hillcrest Rd, Gulfport, MS 39503
$-2,697
Cash flow
-12.6%
Cash-on-Cash Return
2.8%
Cap rate
0.4%
Rent to Value Ratio
Active
$284,000
5
bds
|
4
ba
|
0
sqft
|
built
1968
2 Shady Side Cir, Gulfport, MS 39507
$447
Cash flow
8.2%
Cash-on-Cash Return
7.6%
Cap rate
1.0%
Rent to Value Ratio
Active
$155,000
3
bds
|
2
ba
|
0
sqft
|
built
1975
2501 Gulf Ave, Gulfport, MS 39501
$-72
Cash flow
-2.4%
Cash-on-Cash Return
5.1%
Cap rate
1.2%
Rent to Value Ratio
Active
$2,495,000
5
bds
|
4
ba
|
0
sqft
|
built
1990
9161 Ridge Rd, Gulfport, MS 39503
$-10,933
Cash flow
-22.9%
Cash-on-Cash Return
0.4%
Cap rate
0.1%
Rent to Value Ratio
Active
$49,000
3
bds
|
1
ba
|
0
sqft
|
built
1940
15030 Polk St, Gulfport, MS 39501
$600
Cash flow
14.3%
Cash-on-Cash Return
14.7%
Cap rate
1.8%
Rent to Value Ratio

Active
$288,000
3
bds
|
2
ba
|
0
sqft
|
built
1985
2414 Burke St, Gulfport, MS 39507
$155
Cash flow
2.8%
Cash-on-Cash Return
6.3%
Cap rate
0.8%
Rent to Value Ratio

Active
$120,000
3
bds
|
1
ba
|
0
sqft
|
built
1968
3907 Sierra Dr, Gulfport, MS 39501
$271
Cash flow
11.8%
Cash-on-Cash Return
8.4%
Cap rate
1.1%
Rent to Value Ratio
Active
$183,900
3
bds
|
2
ba
|
0
sqft
|
built
1975
2501 Gulf Ave, Gulfport, MS 39501
$-270
Cash flow
-7.7%
Cash-on-Cash Return
3.9%
Cap rate
1.0%
Rent to Value Ratio

Active
$443,000
4
bds
|
4
ba
|
0
sqft
|
built
2008
1480 Georgia Pl, Gulfport, MS 39507
$23
Cash flow
0.3%
Cash-on-Cash Return
5.7%
Cap rate
0.8%
Rent to Value Ratio

Active
$234,900
2
bds
|
1
ba
|
0
sqft
|
built
1950
801 Allendale Ave, Gulfport, MS 39501
$-94
Cash flow
-2.1%
Cash-on-Cash Return
5.2%
Cap rate
0.7%
Rent to Value Ratio

Active
$500,000
6
bds
|
5
ba
|
0
sqft
|
built
1972
13 Keyser Ln, Gulfport, MS 39507
$-584
Cash flow
-6.1%
Cash-on-Cash Return
4.3%
Cap rate
0.7%
Rent to Value Ratio

Active
$255,000
4
bds
|
2
ba
|
0
sqft
|
built
2021
14578 Canal Pl, Gulfport, MS 39503
$232
Cash flow
4.7%
Cash-on-Cash Return
6.8%
Cap rate
0.9%
Rent to Value Ratio

Active
$349,500
2
bds
|
2
ba
|
0
sqft
|
built
2006
2228 Beach Dr, Gulfport, MS 39507
$-723
Cash flow
-10.8%
Cash-on-Cash Return
3.2%
Cap rate
0.8%
Rent to Value Ratio
Active
$184,000
3
bds
|
2
ba
|
0
sqft
|
built
1959
1111 36th St, Gulfport, MS 39501
$37
Cash flow
1.0%
Cash-on-Cash Return
5.9%
Cap rate
0.9%
Rent to Value Ratio
Active
$185,900
3
bds
|
1
ba
|
0
sqft
|
built
1950
826 Township Rd, Gulfport, MS 39507
$253
Cash flow
7.1%
Cash-on-Cash Return
7.3%
Cap rate
1.0%
Rent to Value Ratio
Active
$489,900
3
bds
|
3
ba
|
0
sqft
|
built
2004
2230 Beach Dr, Gulfport, MS 39507
$-1,440
Cash flow
-15.3%
Cash-on-Cash Return
2.2%
Cap rate
0.7%
Rent to Value Ratio
Active
$432,000
2
bds
|
3
ba
|
0
sqft
|
built
2004
4640 W Beach Blvd, Gulfport, MS 39501
$-1,963
Cash flow
-23.7%
Cash-on-Cash Return
0.2%
Cap rate
0.5%
Rent to Value Ratio
Active
$1,195,000
4
bds
|
3
ba
|
0
sqft
|
built
2021
1507 Olive Ave, Gulfport, MS 39501
$-3,151
Cash flow
-13.8%
Cash-on-Cash Return
2.5%
Cap rate
0.3%
Rent to Value Ratio
Active
$218,500
3
bds
|
2
ba
|
0
sqft
|
built
1967
15314 Saint Charles St, Gulfport, MS 39503
$262
Cash flow
6.3%
Cash-on-Cash Return
7.1%
Cap rate
0.9%
Rent to Value Ratio
Active
$258,000
4
bds
|
2
ba
|
0
sqft
|
built
2016
14153 Anandale Cir, Gulfport, MS 39503
$15
Cash flow
0.3%
Cash-on-Cash Return
5.7%
Cap rate
0.8%
Rent to Value Ratio

Active
$352,500
2
bds
|
2
ba
|
0
sqft
|
built
2005
2230 Beach Dr, Gulfport, MS 39507
$-47
Cash flow
-0.7%
Cash-on-Cash Return
5.5%
Cap rate
0.8%
Rent to Value Ratio

Active
$369,000
3
bds
|
2
ba
|
0
sqft
|
built
2023
306 Cowan Rd, Gulfport, MS 39507
$-607
Cash flow
-8.6%
Cash-on-Cash Return
3.7%
Cap rate
0.5%
Rent to Value Ratio
Active
$1,100,000
27
bds
|
15
ba
|
0
sqft
|
built
1962
2520 Hewes Ave, Gulfport, MS 39507
$-5,187
Cash flow
-24.6%
Cash-on-Cash Return
0.6%
Cap rate
0.1%
Rent to Value Ratio
Active
$139,000
2
bds
|
3
ba
|
0
sqft
|
built
2007
1290 Tropical Cv, Gulfport, MS 39507
$197
Cash flow
7.4%
Cash-on-Cash Return
7.4%
Cap rate
1.0%
Rent to Value Ratio

Active
$419,000
4
bds
|
2
ba
|
0
sqft
|
built
2021
12052 Michael Grace Dr, Gulfport, MS 39503
$-212
Cash flow
-2.6%
Cash-on-Cash Return
5.1%
Cap rate
0.7%
Rent to Value Ratio

Active
$690,000
4
bds
|
3
ba
|
0
sqft
|
built
1993
12683 John Ross Rd, Gulfport, MS 39503
$-1,118
Cash flow
-8.5%
Cash-on-Cash Return
3.7%
Cap rate
0.5%
Rent to Value Ratio

Active
$147,700
3
bds
|
2
ba
|
0
sqft
|
built
2000
10589 Bay Tree Dr, Gulfport, MS 39503
$19
Cash flow
0.7%
Cash-on-Cash Return
5.8%
Cap rate
0.8%
Rent to Value Ratio

Active
$249,900
4
bds
|
2
ba
|
0
sqft
|
built
1960
2014 Saint James Blvd, Gulfport, MS 39507
$312
Cash flow
6.5%
Cash-on-Cash Return
7.2%
Cap rate
0.9%
Rent to Value Ratio
Active
$120,000
3
bds
|
2
ba
|
0
sqft
|
built
1965
204 N Wilson Blvd, Gulfport, MS 39503
$343
Cash flow
14.9%
Cash-on-Cash Return
9.1%
Cap rate
1.2%
Rent to Value Ratio
Active
$669,900
3
bds
|
3
ba
|
0
sqft
|
built
2023
116 E Beach Blvd, Gulfport, MS 39507
$-1,612
Cash flow
-12.6%
Cash-on-Cash Return
2.8%
Cap rate
0.5%
Rent to Value Ratio

Active
$230,000
2
bds
|
2
ba
|
0
sqft
|
built
1984
113 Sunridge Park, Gulfport, MS 39507
$131
Cash flow
3.0%
Cash-on-Cash Return
6.4%
Cap rate
0.9%
Rent to Value Ratio

Active
$485,000
3
bds
|
3
ba
|
0
sqft
|
built
2006
2228 Beach Dr, Gulfport, MS 39507
$-1,700
Cash flow
-18.3%
Cash-on-Cash Return
1.5%
Cap rate
0.7%
Rent to Value Ratio

Active
$260,000
2
bds
|
2
ba
|
0
sqft
|
built
2001
2252 Beach Dr, Gulfport, MS 39507
$-670
Cash flow
-13.4%
Cash-on-Cash Return
2.6%
Cap rate
0.8%
Rent to Value Ratio

Active
$170,000
4
bds
|
2
ba
|
0
sqft
|
built
1940
717 Watkins Ave, Gulfport, MS 39507
$251
Cash flow
7.7%
Cash-on-Cash Return
7.4%
Cap rate
1.0%
Rent to Value Ratio