Gulfport, MS Investment Properties for Sale
Browse homes for sale and investment properties in Gulfport, MS. Refine your search by price, property type, or more.
Best cash flowing properties in Gulfport, MS

Active
$49,500
3
bds
|
2
ba
|
0
sqft
|
built
1950
2409 Joan Ave, Gulfport, MS 39501
$963
Cash flow
22.7%
Cash-on-Cash Return
23.3%
Cap rate
3.0%
Rent to Value Ratio
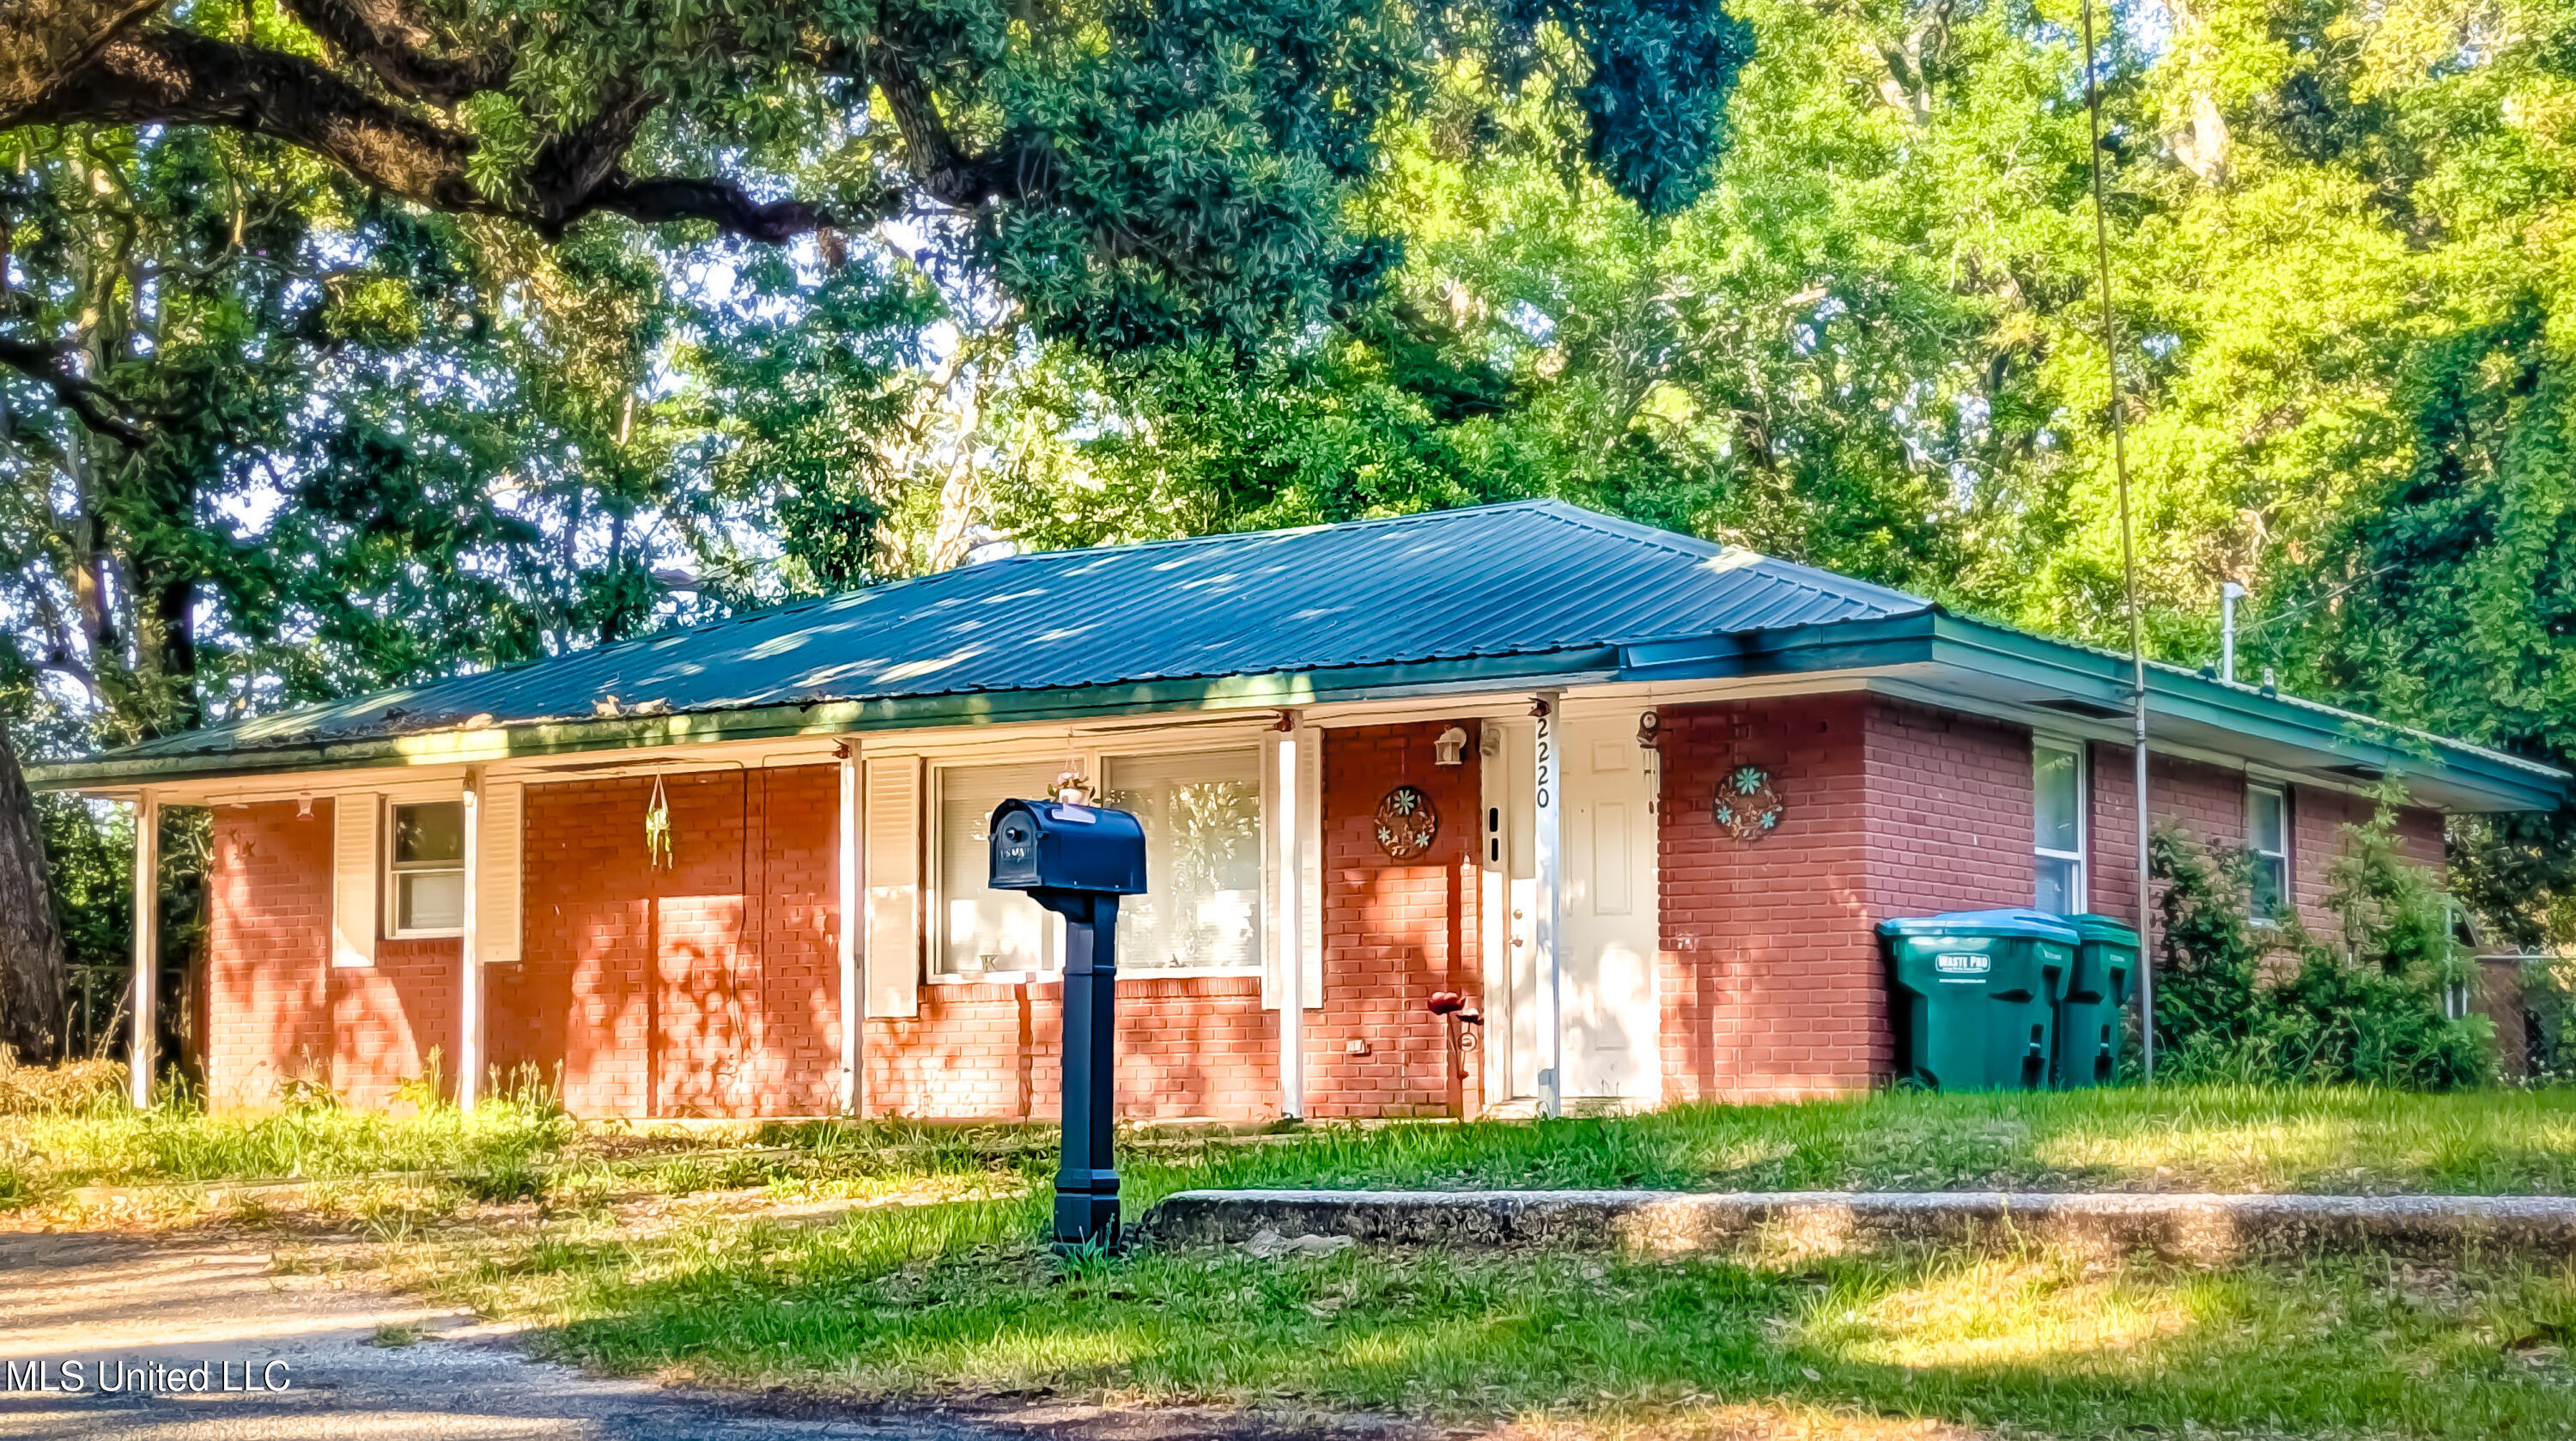
Active under contract
$125,000
3
bds
|
1
ba
|
0
sqft
|
built
1968
2220 18th Ave, Gulfport, MS 39501
$425
Cash flow
17.7%
Cash-on-Cash Return
9.8%
Cap rate
1.3%
Rent to Value Ratio
298 out of 325 properties for sale in Gulfport, MS
Limited Results Shown
Create a free account, or log in to reveal all property listings and enjoy the complete experience.
Active
$169,500
5
bds
|
2
ba
|
0
sqft
|
built
1958
3008 Papania Ln, Gulfport, MS 39501
$397
Cash flow
12.2%
Cash-on-Cash Return
8.5%
Cap rate
1.2%
Rent to Value Ratio
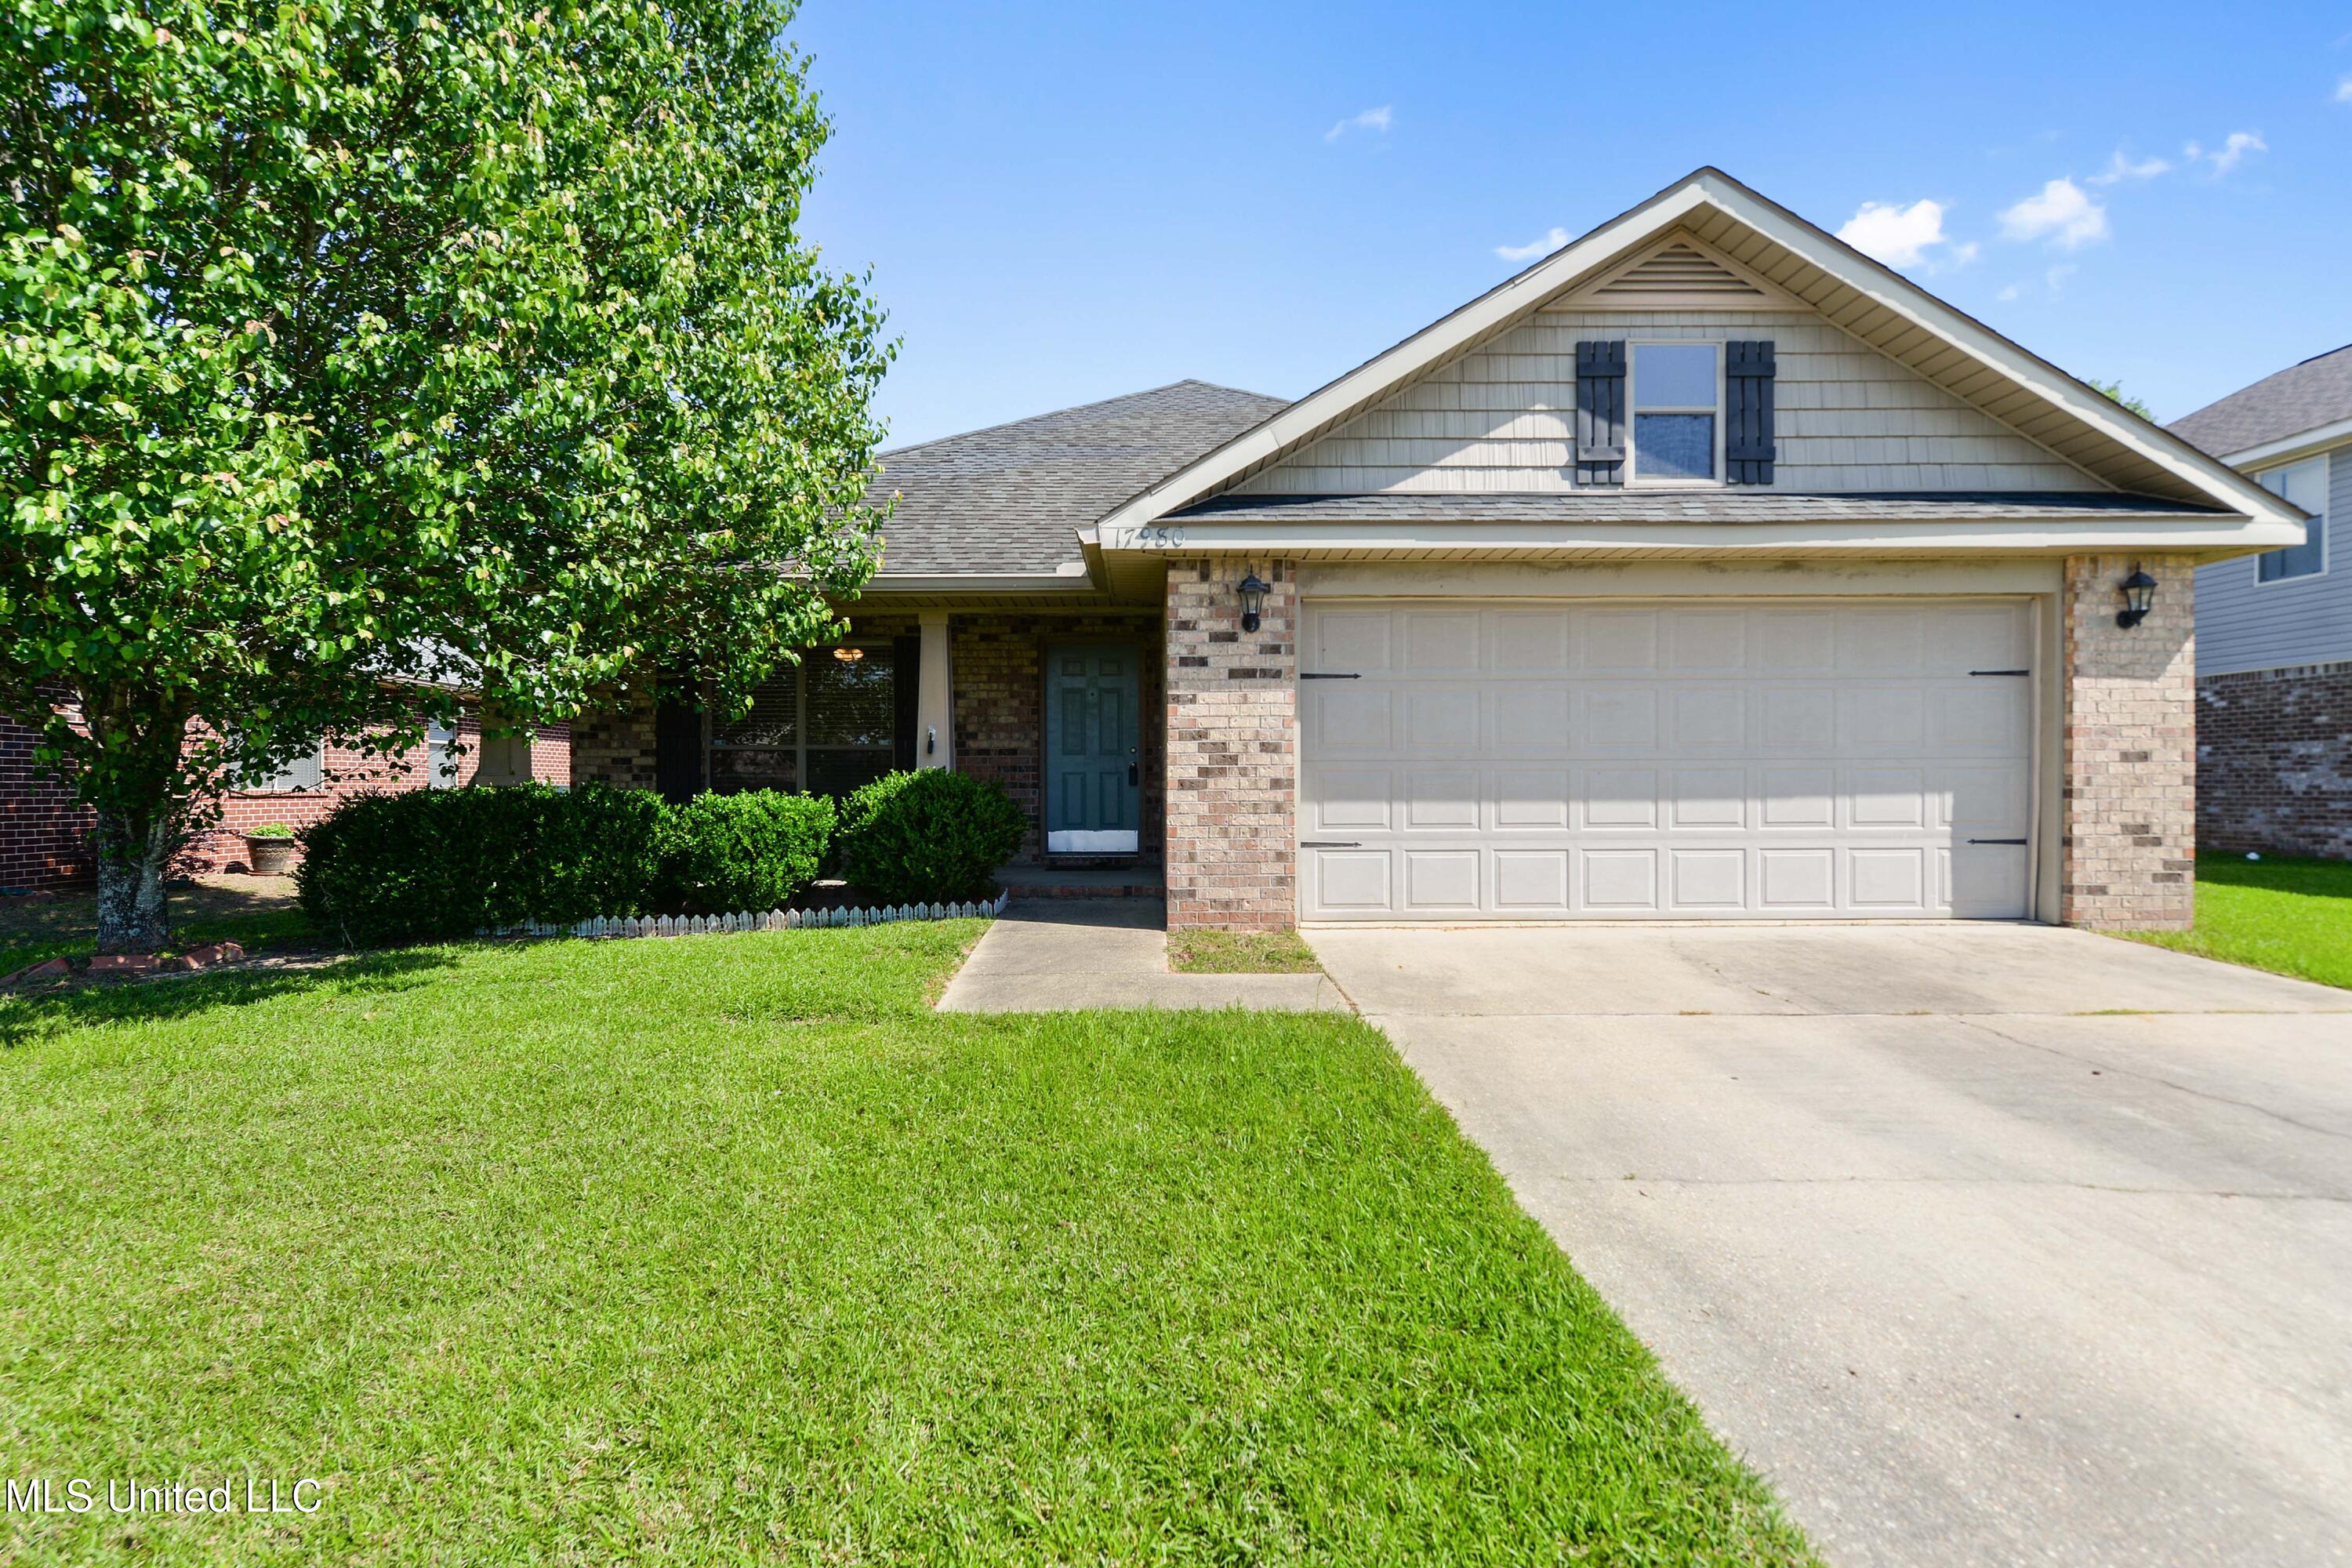
Pending
$255,000
3
bds
|
2
ba
|
0
sqft
|
built
2010
17980 Restoration Cir, Gulfport, MS 39503
$171
Cash flow
3.5%
Cash-on-Cash Return
6.5%
Cap rate
0.9%
Rent to Value Ratio

Active
$389,900
4
bds
|
3
ba
|
0
sqft
|
built
2020
10620 Chapelwood Dr, Gulfport, MS 39503
$-91
Cash flow
-1.2%
Cash-on-Cash Return
5.4%
Cap rate
0.7%
Rent to Value Ratio
Active
$156,900
2
bds
|
2
ba
|
0
sqft
|
built
1940
1821 19th Ave, Gulfport, MS 39501
$300
Cash flow
10.0%
Cash-on-Cash Return
8.0%
Cap rate
1.0%
Rent to Value Ratio
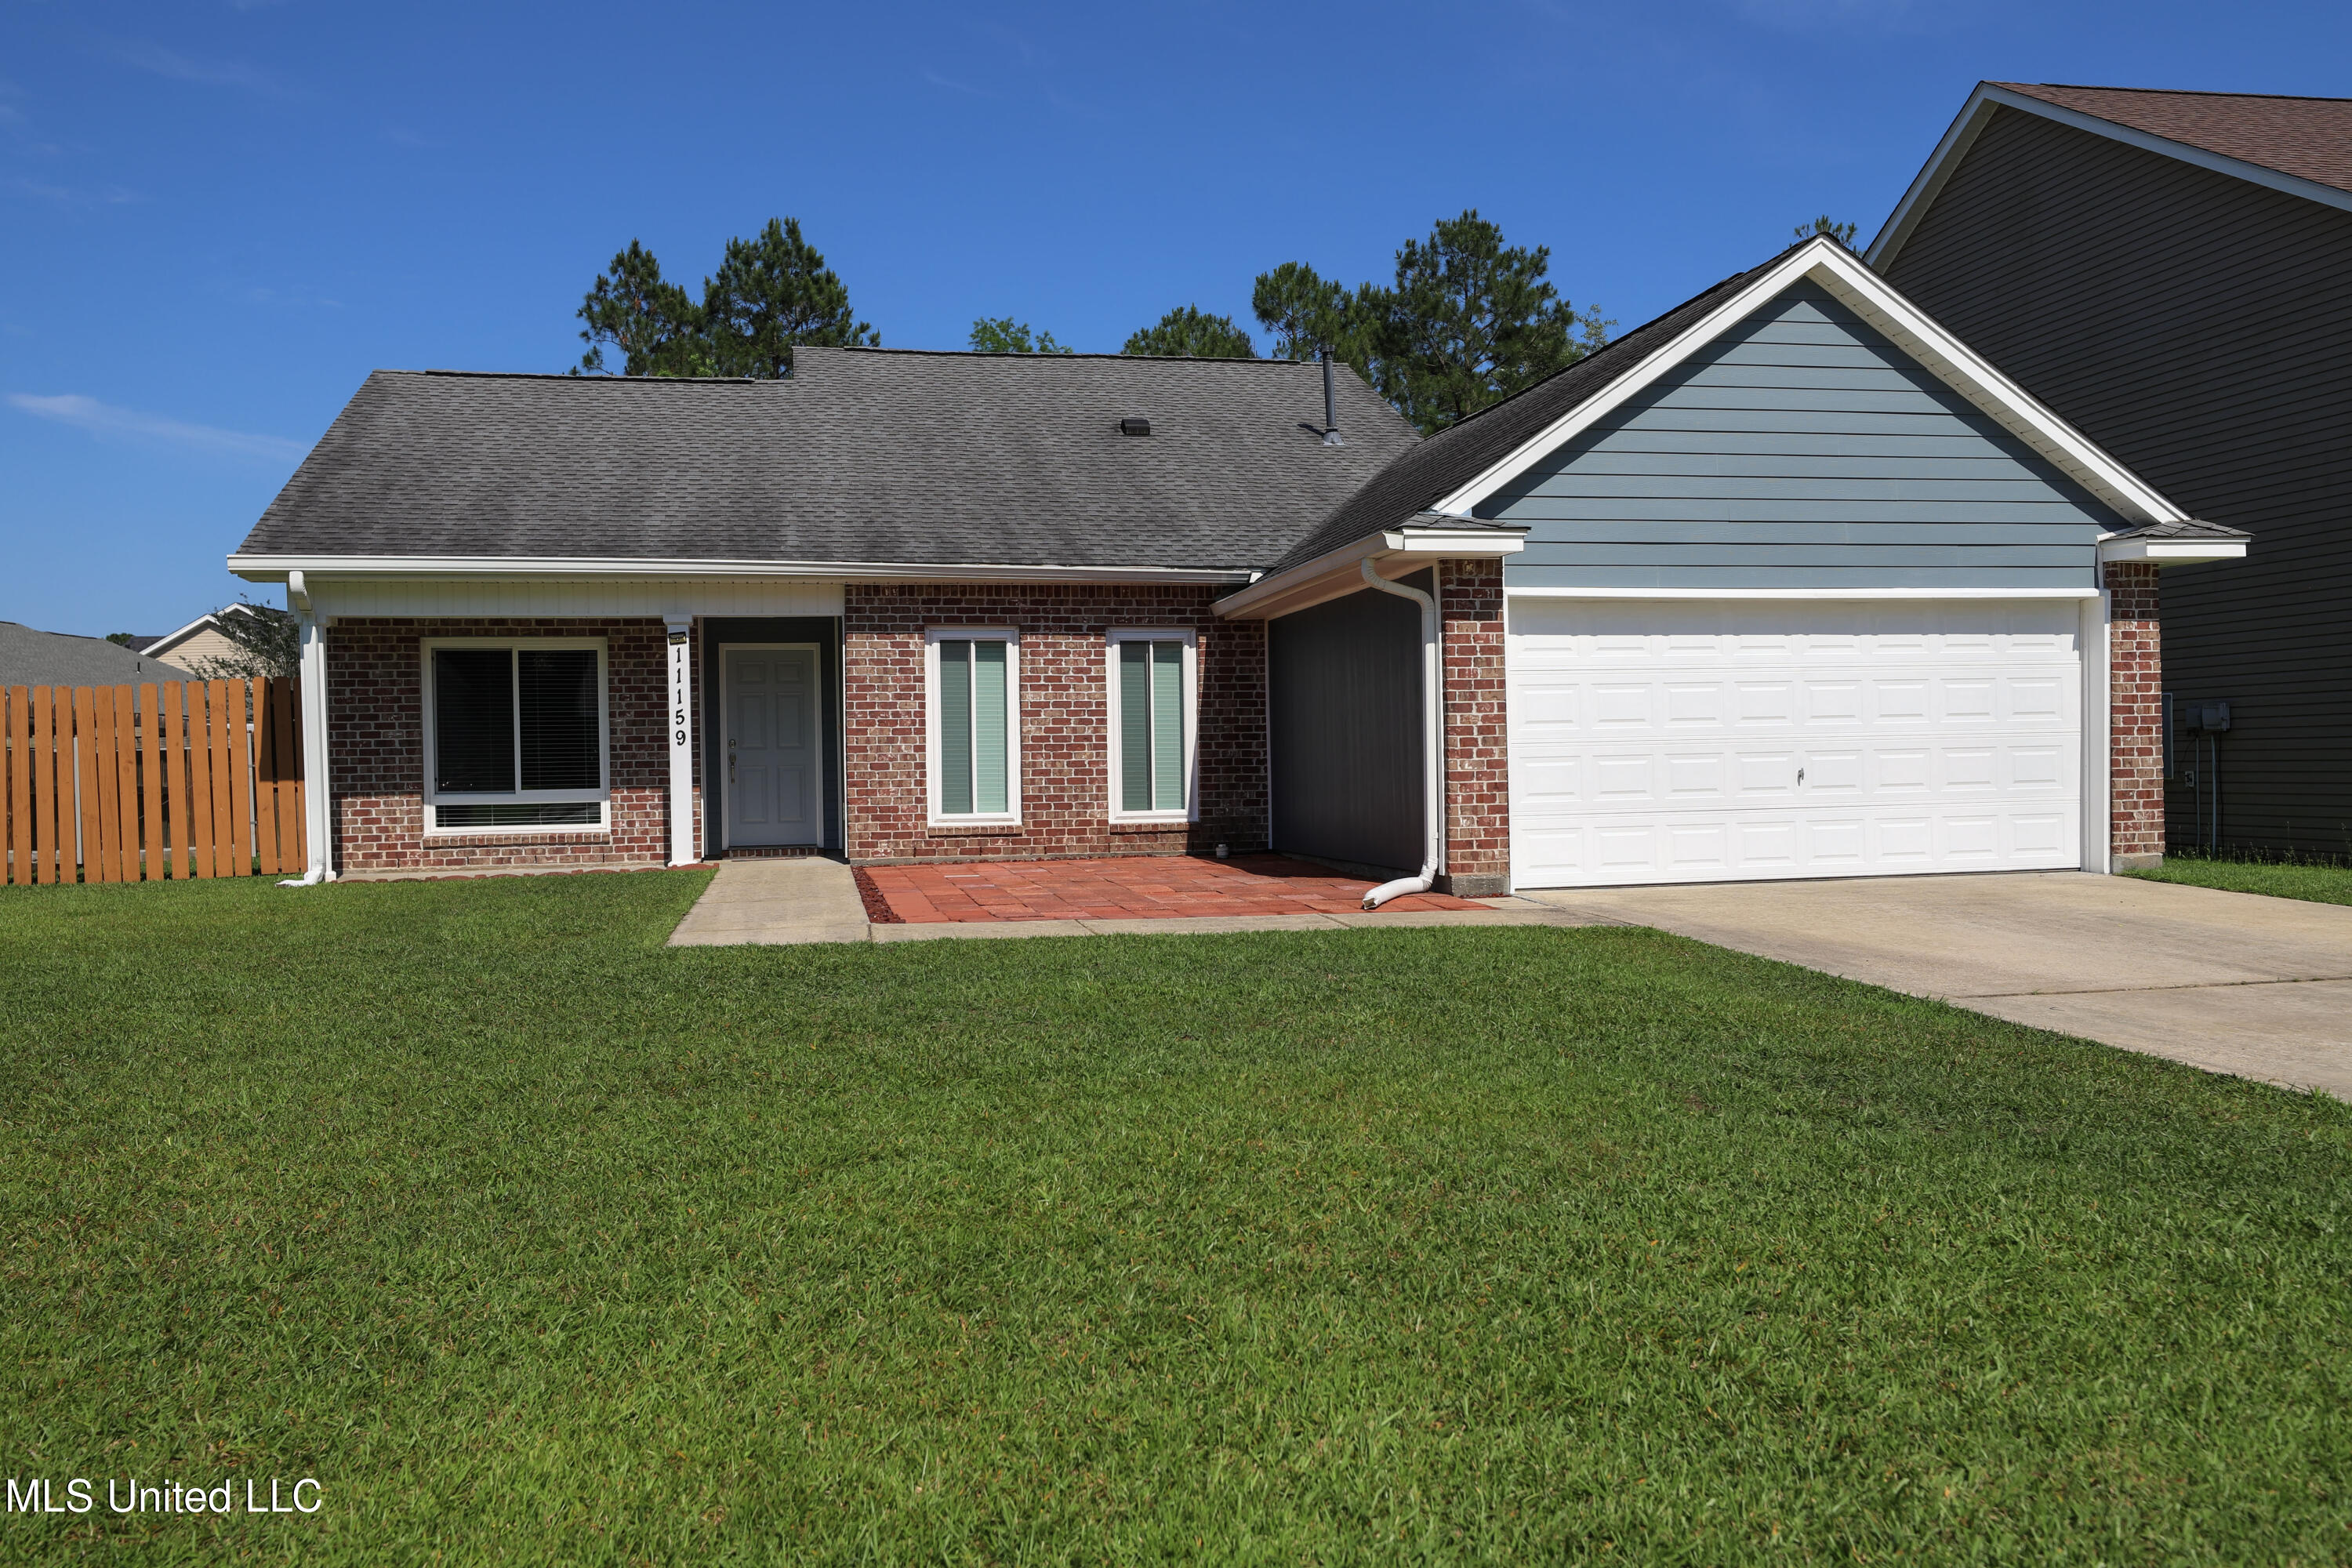
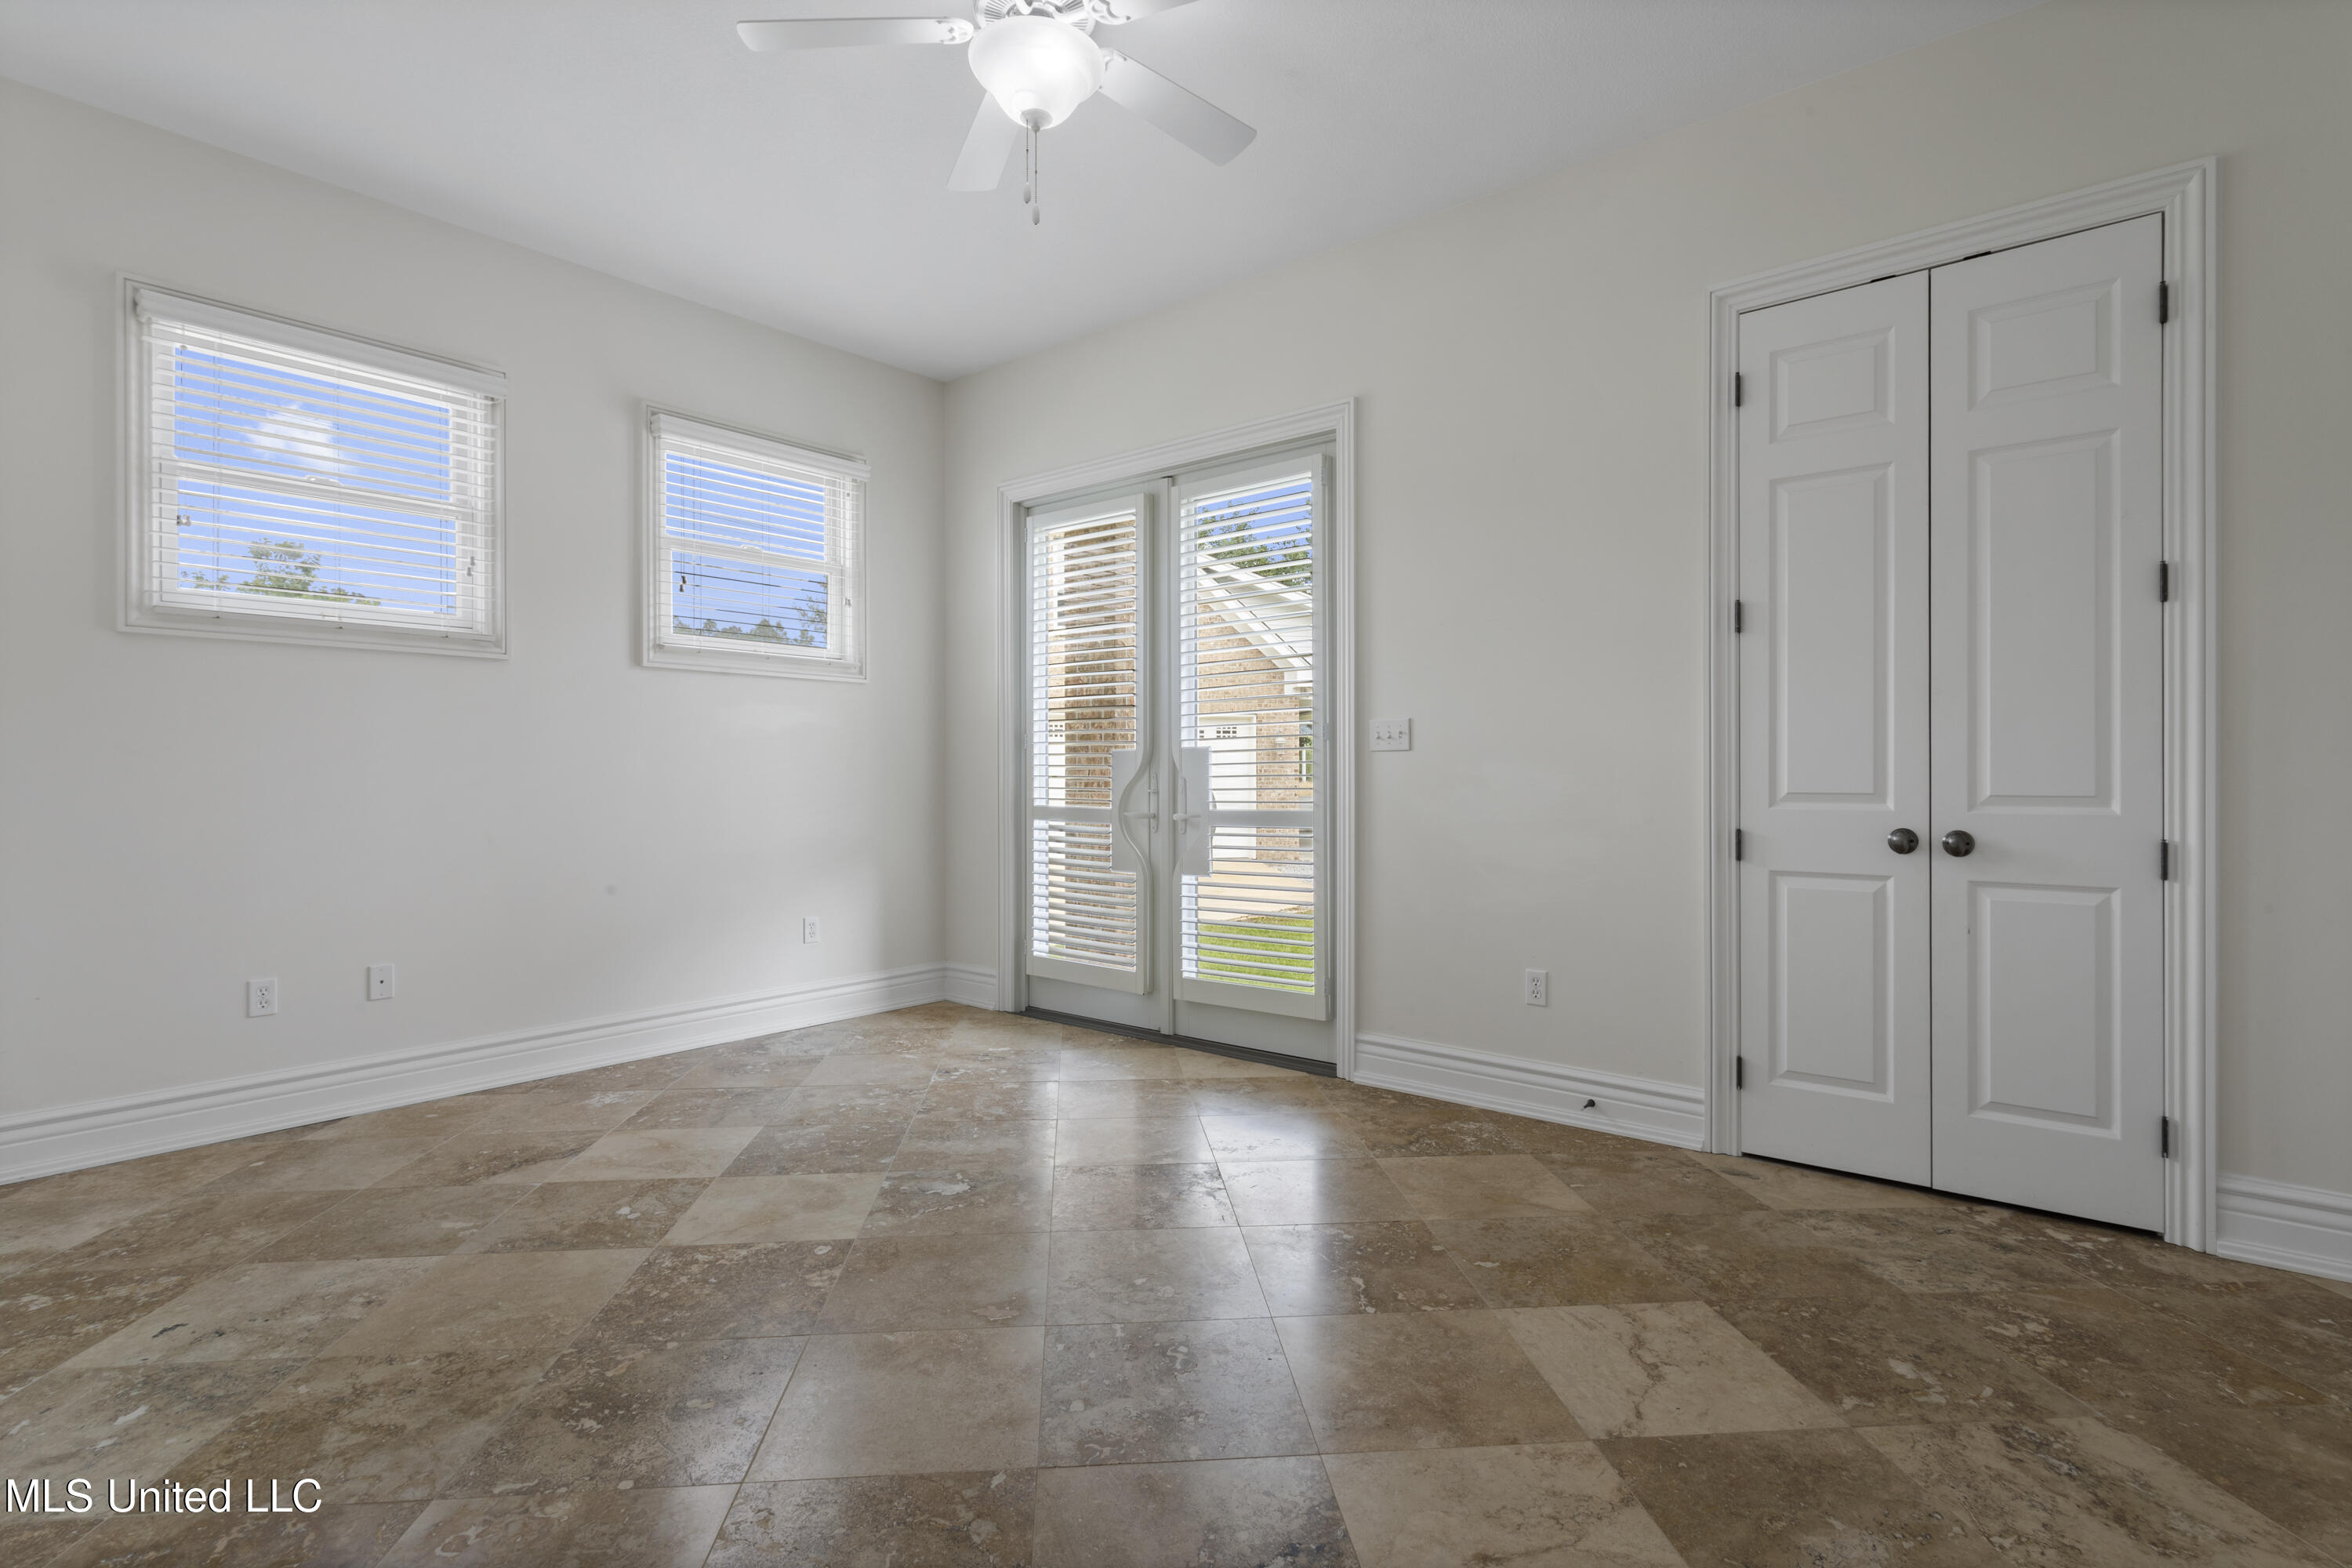
Active
$279,900
4
bds
|
2
ba
|
0
sqft
|
built
2004
11159 River Bend Dr, Gulfport, MS 39503
$-37
Cash flow
-0.7%
Cash-on-Cash Return
5.5%
Cap rate
0.7%
Rent to Value Ratio

Active
$135,000
3
bds
|
1
ba
|
0
sqft
|
built
1998
10621 Sharp Blvd, Gulfport, MS 39503
$238
Cash flow
9.2%
Cash-on-Cash Return
7.8%
Cap rate
1.0%
Rent to Value Ratio

Active
$84,000
5
bds
|
2
ba
|
0
sqft
|
built
1950
1710 Eastward Dr, Gulfport, MS 39501
$396
Cash flow
24.6%
Cash-on-Cash Return
11.3%
Cap rate
1.5%
Rent to Value Ratio
Active
$750,000
4
bds
|
4
ba
|
0
sqft
|
built
2006
12240 Lake Forest Dr, Gulfport, MS 39503
$-2,400
Cash flow
-16.7%
Cash-on-Cash Return
1.8%
Cap rate
0.3%
Rent to Value Ratio
Active
$355,000
4
bds
|
3
ba
|
0
sqft
|
built
2009
13239 Tyler Ln, Gulfport, MS 39503
$99
Cash flow
1.5%
Cash-on-Cash Return
6.0%
Cap rate
0.8%
Rent to Value Ratio
Active
$135,000
3
bds
|
1
ba
|
0
sqft
|
built
1998
10557 Sharp Blvd, Gulfport, MS 39503
$238
Cash flow
9.2%
Cash-on-Cash Return
7.8%
Cap rate
1.0%
Rent to Value Ratio

Active
$325,000
4
bds
|
3
ba
|
0
sqft
|
built
2001
11295 Peyton Dr, Gulfport, MS 39503
$-70
Cash flow
-1.1%
Cash-on-Cash Return
5.4%
Cap rate
0.7%
Rent to Value Ratio
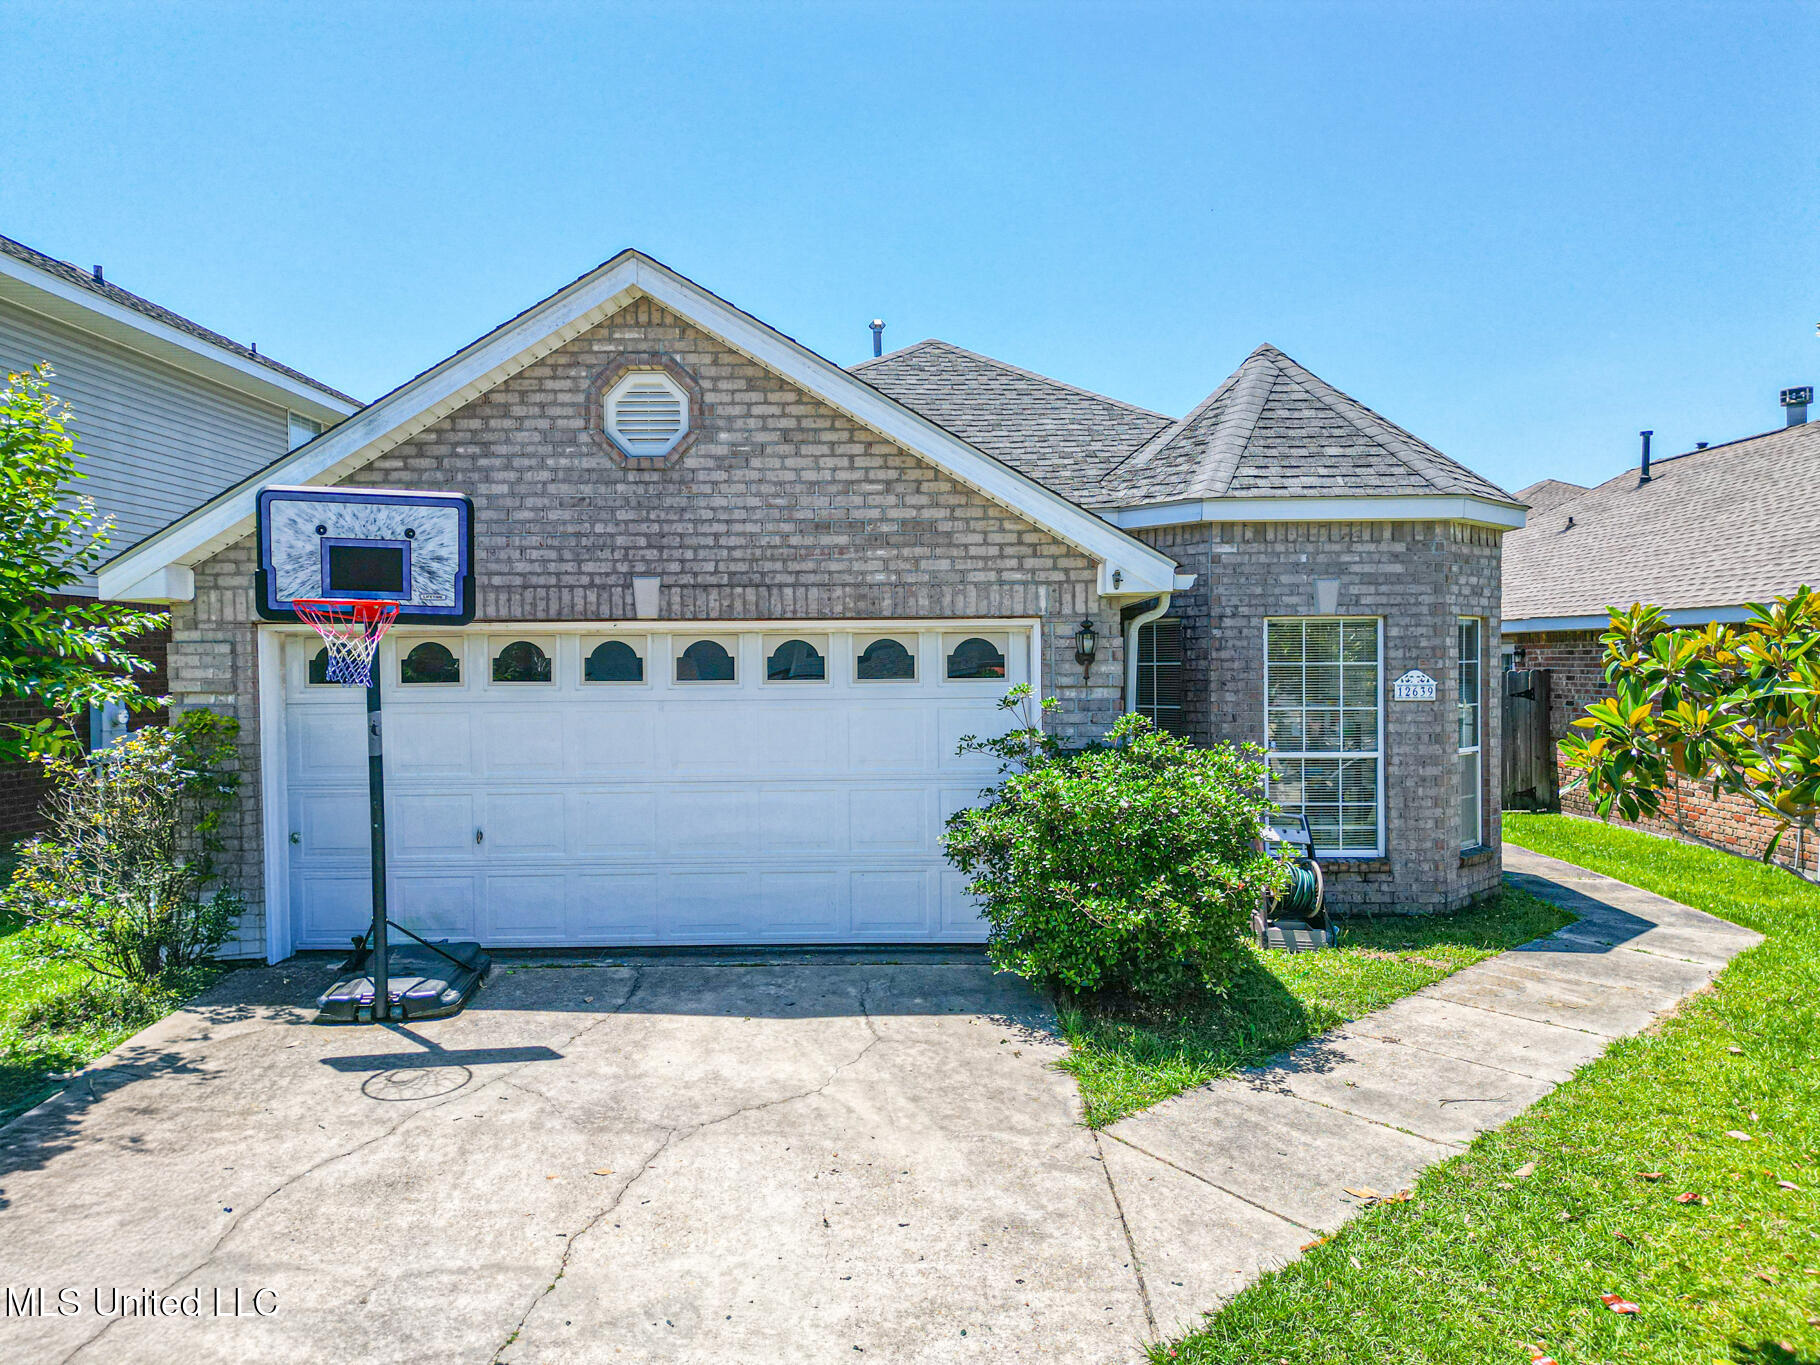
Active
$225,000
3
bds
|
2
ba
|
0
sqft
|
built
1999
12639 Cody Dr, Gulfport, MS 39503
$-29
Cash flow
-0.7%
Cash-on-Cash Return
5.5%
Cap rate
0.8%
Rent to Value Ratio
Active
$274,000
3
bds
|
2
ba
|
0
sqft
|
built
1968
17329 Perkins Rd, Gulfport, MS 39503
$341
Cash flow
6.5%
Cash-on-Cash Return
7.2%
Cap rate
0.9%
Rent to Value Ratio
Active
$339,000
3
bds
|
3
ba
|
0
sqft
|
built
1969
26 Bayou View Dr, Gulfport, MS 39507
$-73
Cash flow
-1.1%
Cash-on-Cash Return
5.4%
Cap rate
0.8%
Rent to Value Ratio
Active
$87,000
1
bds
|
1
ba
|
0
sqft
|
built
1998
828 Oakleigh Ave, Gulfport, MS 39507
$-63
Cash flow
-3.8%
Cash-on-Cash Return
4.8%
Cap rate
1.3%
Rent to Value Ratio

Active
$232,000
3
bds
|
4
ba
|
0
sqft
|
built
1982
14026 Gladys St, Gulfport, MS 39503
$66
Cash flow
1.5%
Cash-on-Cash Return
6.0%
Cap rate
0.8%
Rent to Value Ratio

Active
$265,000
4
bds
|
2
ba
|
0
sqft
|
built
2019
18224 Big Leaf Dr, Gulfport, MS 39503
$189
Cash flow
3.7%
Cash-on-Cash Return
6.5%
Cap rate
0.9%
Rent to Value Ratio

Active
$180,000
3
bds
|
4
ba
|
0
sqft
|
built
1984
429 San Souci Dr, Gulfport, MS 39507
$155
Cash flow
4.5%
Cash-on-Cash Return
6.7%
Cap rate
0.9%
Rent to Value Ratio
Active
$87,900
1
bds
|
1
ba
|
0
sqft
|
built
1998
828 Oakleigh Ave, Gulfport, MS 39507
$-113
Cash flow
-6.7%
Cash-on-Cash Return
4.1%
Cap rate
1.3%
Rent to Value Ratio
Active
$189,900
1
bds
|
1
ba
|
0
sqft
|
built
2001
2252 Beach Dr, Gulfport, MS 39507
$-325
Cash flow
-8.9%
Cash-on-Cash Return
3.6%
Cap rate
0.9%
Rent to Value Ratio

Active
$1,500,000
5
bds
|
6
ba
|
0
sqft
|
built
1987
11352 Palm Valley Cv, Gulfport, MS 39503
$-5,682
Cash flow
-19.8%
Cash-on-Cash Return
1.1%
Cap rate
0.2%
Rent to Value Ratio
Active
$172,000
3
bds
|
2
ba
|
0
sqft
|
built
1985
2309 Cottonwood Dr, Gulfport, MS 39503
$-94
Cash flow
-2.9%
Cash-on-Cash Return
5.0%
Cap rate
0.7%
Rent to Value Ratio
Active
$218,900
3
bds
|
2
ba
|
0
sqft
|
built
1975
2410 E Birch Dr, Gulfport, MS 39503
$213
Cash flow
5.1%
Cash-on-Cash Return
6.8%
Cap rate
0.9%
Rent to Value Ratio
Active under contract
$125,000
3
bds
|
1
ba
|
0
sqft
|
built
1968
2220 18th Ave, Gulfport, MS 39501
$425
Cash flow
17.7%
Cash-on-Cash Return
9.8%
Cap rate
1.3%
Rent to Value Ratio
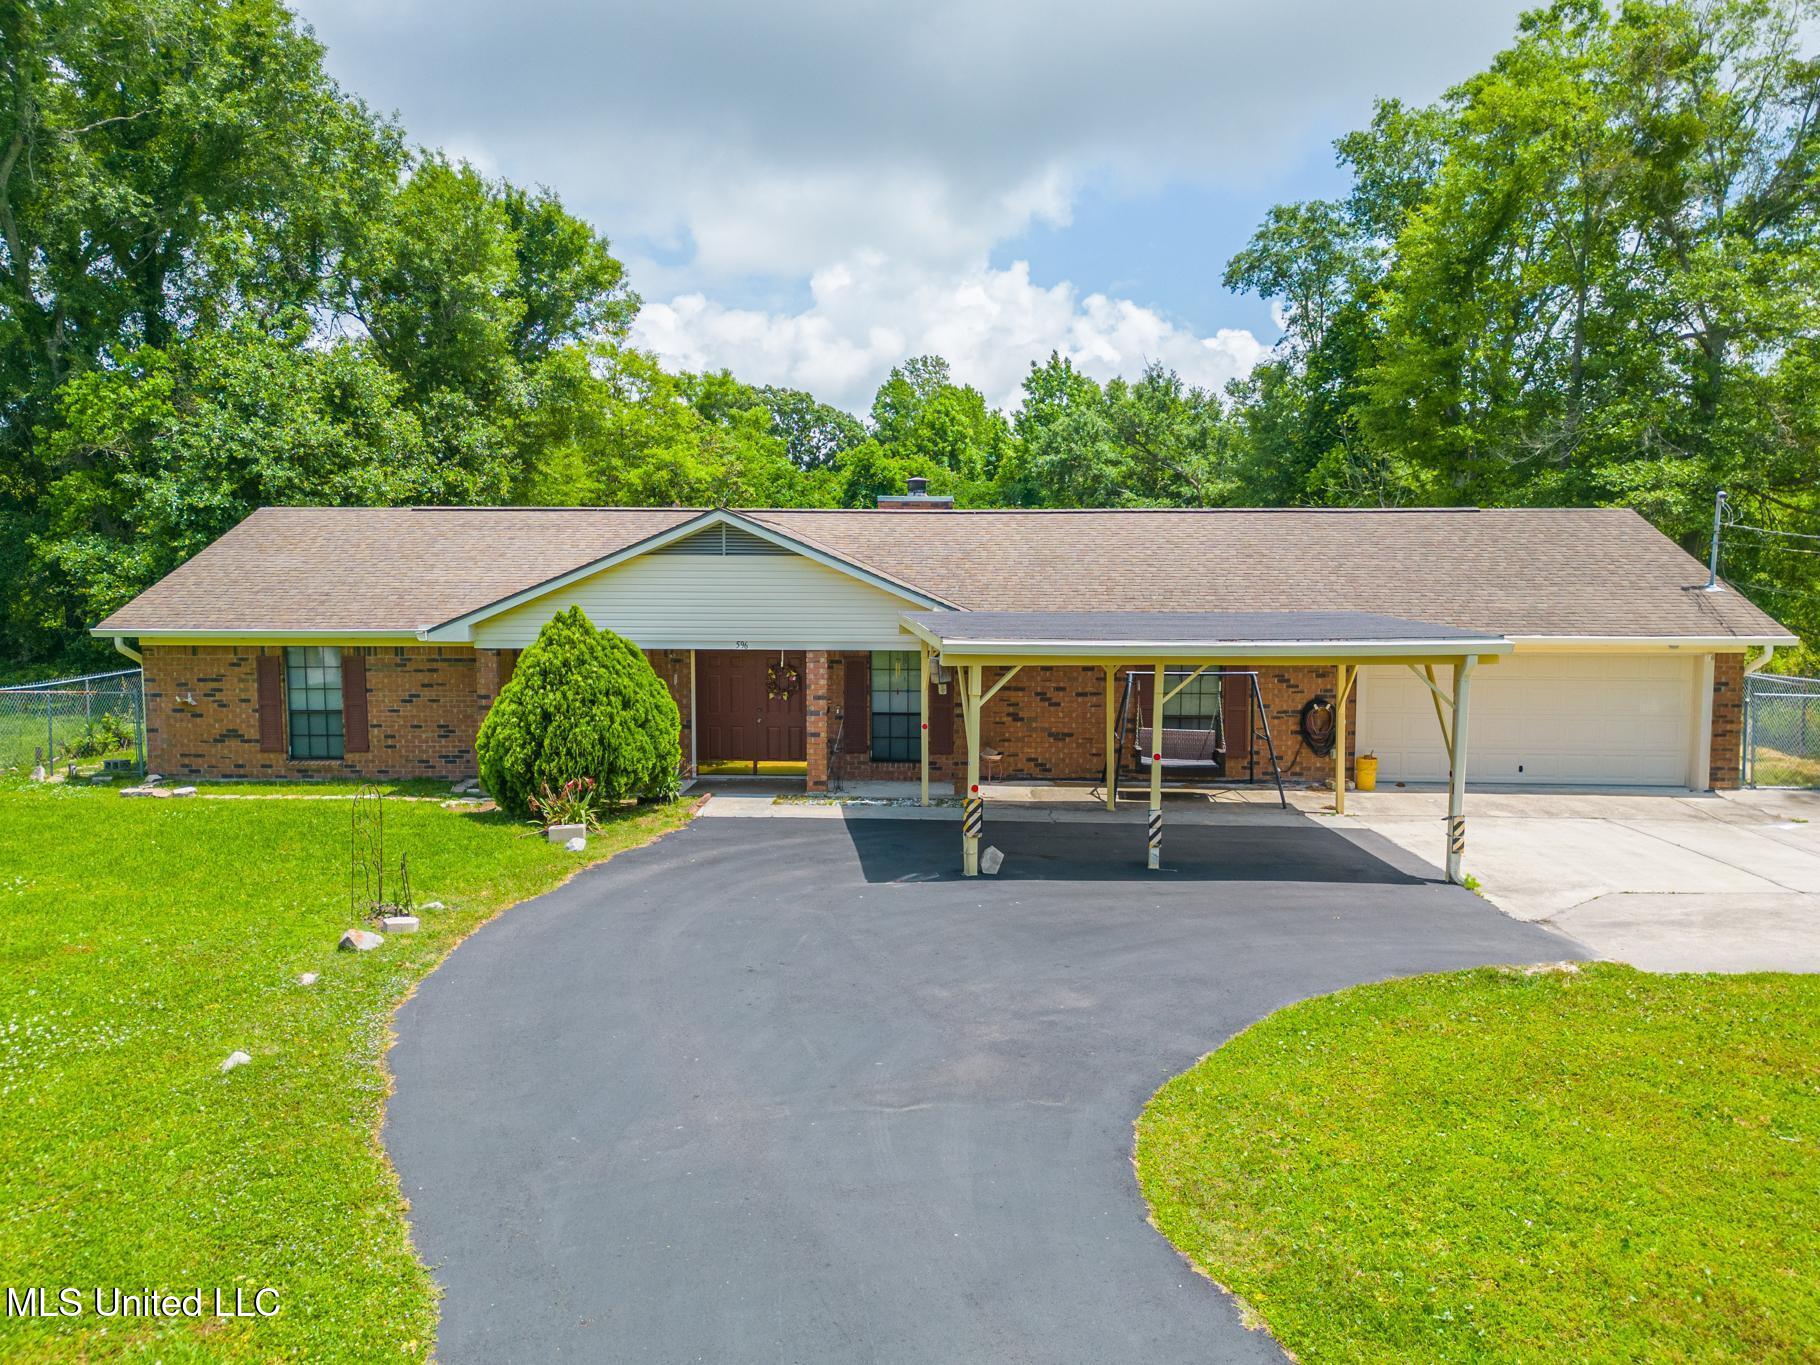
Active
$275,000
3
bds
|
2
ba
|
0
sqft
|
built
1988
596 Tegarden Rd, Gulfport, MS 39507
$39
Cash flow
0.7%
Cash-on-Cash Return
5.8%
Cap rate
0.7%
Rent to Value Ratio
Active
$49,500
3
bds
|
2
ba
|
0
sqft
|
built
1950
2409 Joan Ave, Gulfport, MS 39501
$963
Cash flow
22.7%
Cash-on-Cash Return
23.3%
Cap rate
3.0%
Rent to Value Ratio

Pending
$349,900
3
bds
|
2
ba
|
0
sqft
|
built
1975
14162 E Marcie Rd, Gulfport, MS 39503
$-181
Cash flow
-2.7%
Cash-on-Cash Return
5.1%
Cap rate
0.6%
Rent to Value Ratio

Active
$354,000
3
bds
|
3
ba
|
0
sqft
|
built
2015
14420 N Swan Rd, Gulfport, MS 39503
$50
Cash flow
0.7%
Cash-on-Cash Return
5.8%
Cap rate
0.7%
Rent to Value Ratio
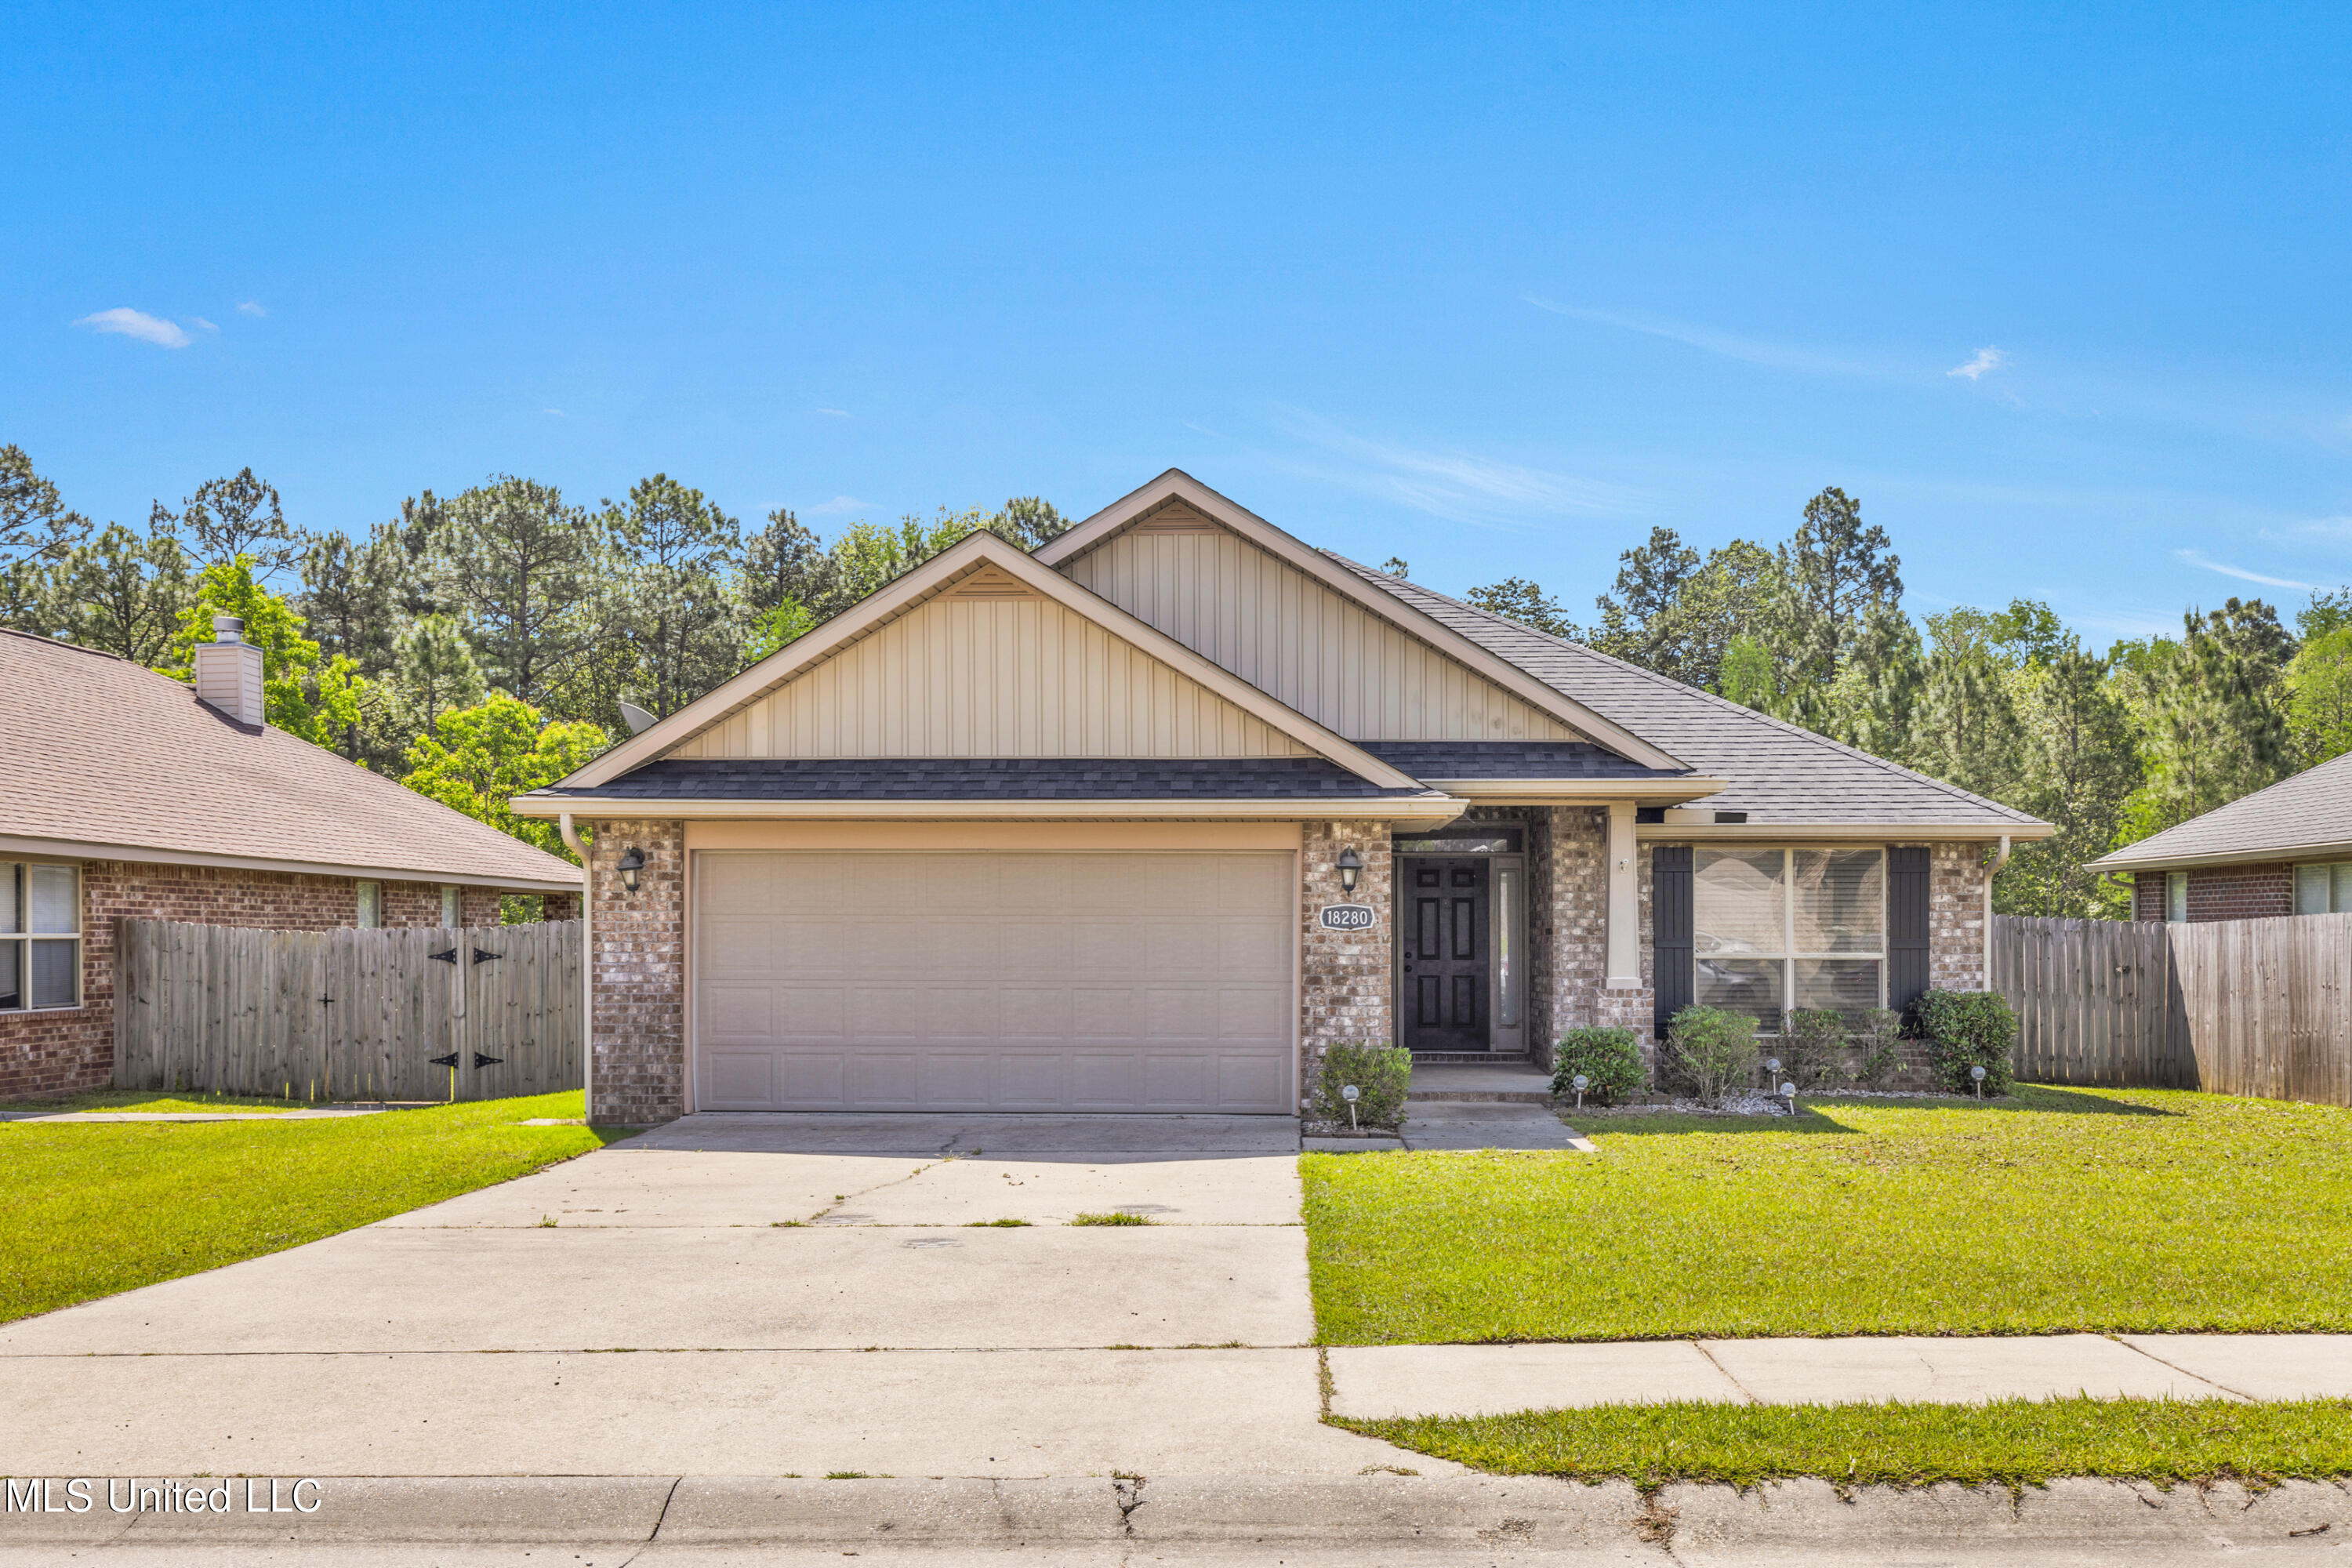
Active
$259,440
4
bds
|
2
ba
|
0
sqft
|
built
2014
18280 Cardinal Ln, Gulfport, MS 39503
$33
Cash flow
0.7%
Cash-on-Cash Return
5.8%
Cap rate
0.8%
Rent to Value Ratio
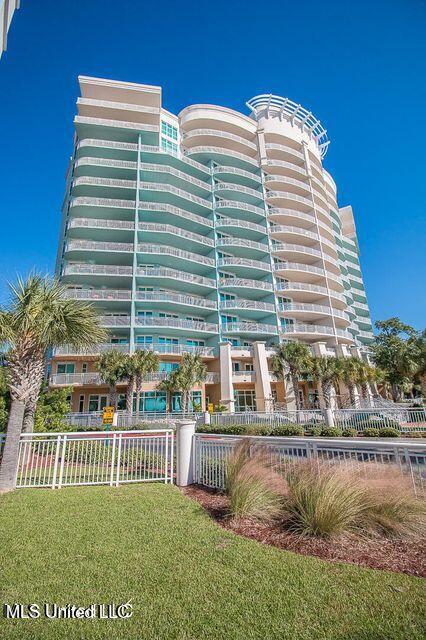
Active
$489,000
3
bds
|
3
ba
|
0
sqft
|
built
2005
2230 Beach Dr, Gulfport, MS 39507
$-1,498
Cash flow
-16.0%
Cash-on-Cash Return
2.0%
Cap rate
0.7%
Rent to Value Ratio

Active
$930,000
5
bds
|
4
ba
|
0
sqft
|
built
2020
4832 W Beach Blvd, Gulfport, MS 39501
$-1,309
Cash flow
-7.3%
Cash-on-Cash Return
4.0%
Cap rate
0.5%
Rent to Value Ratio
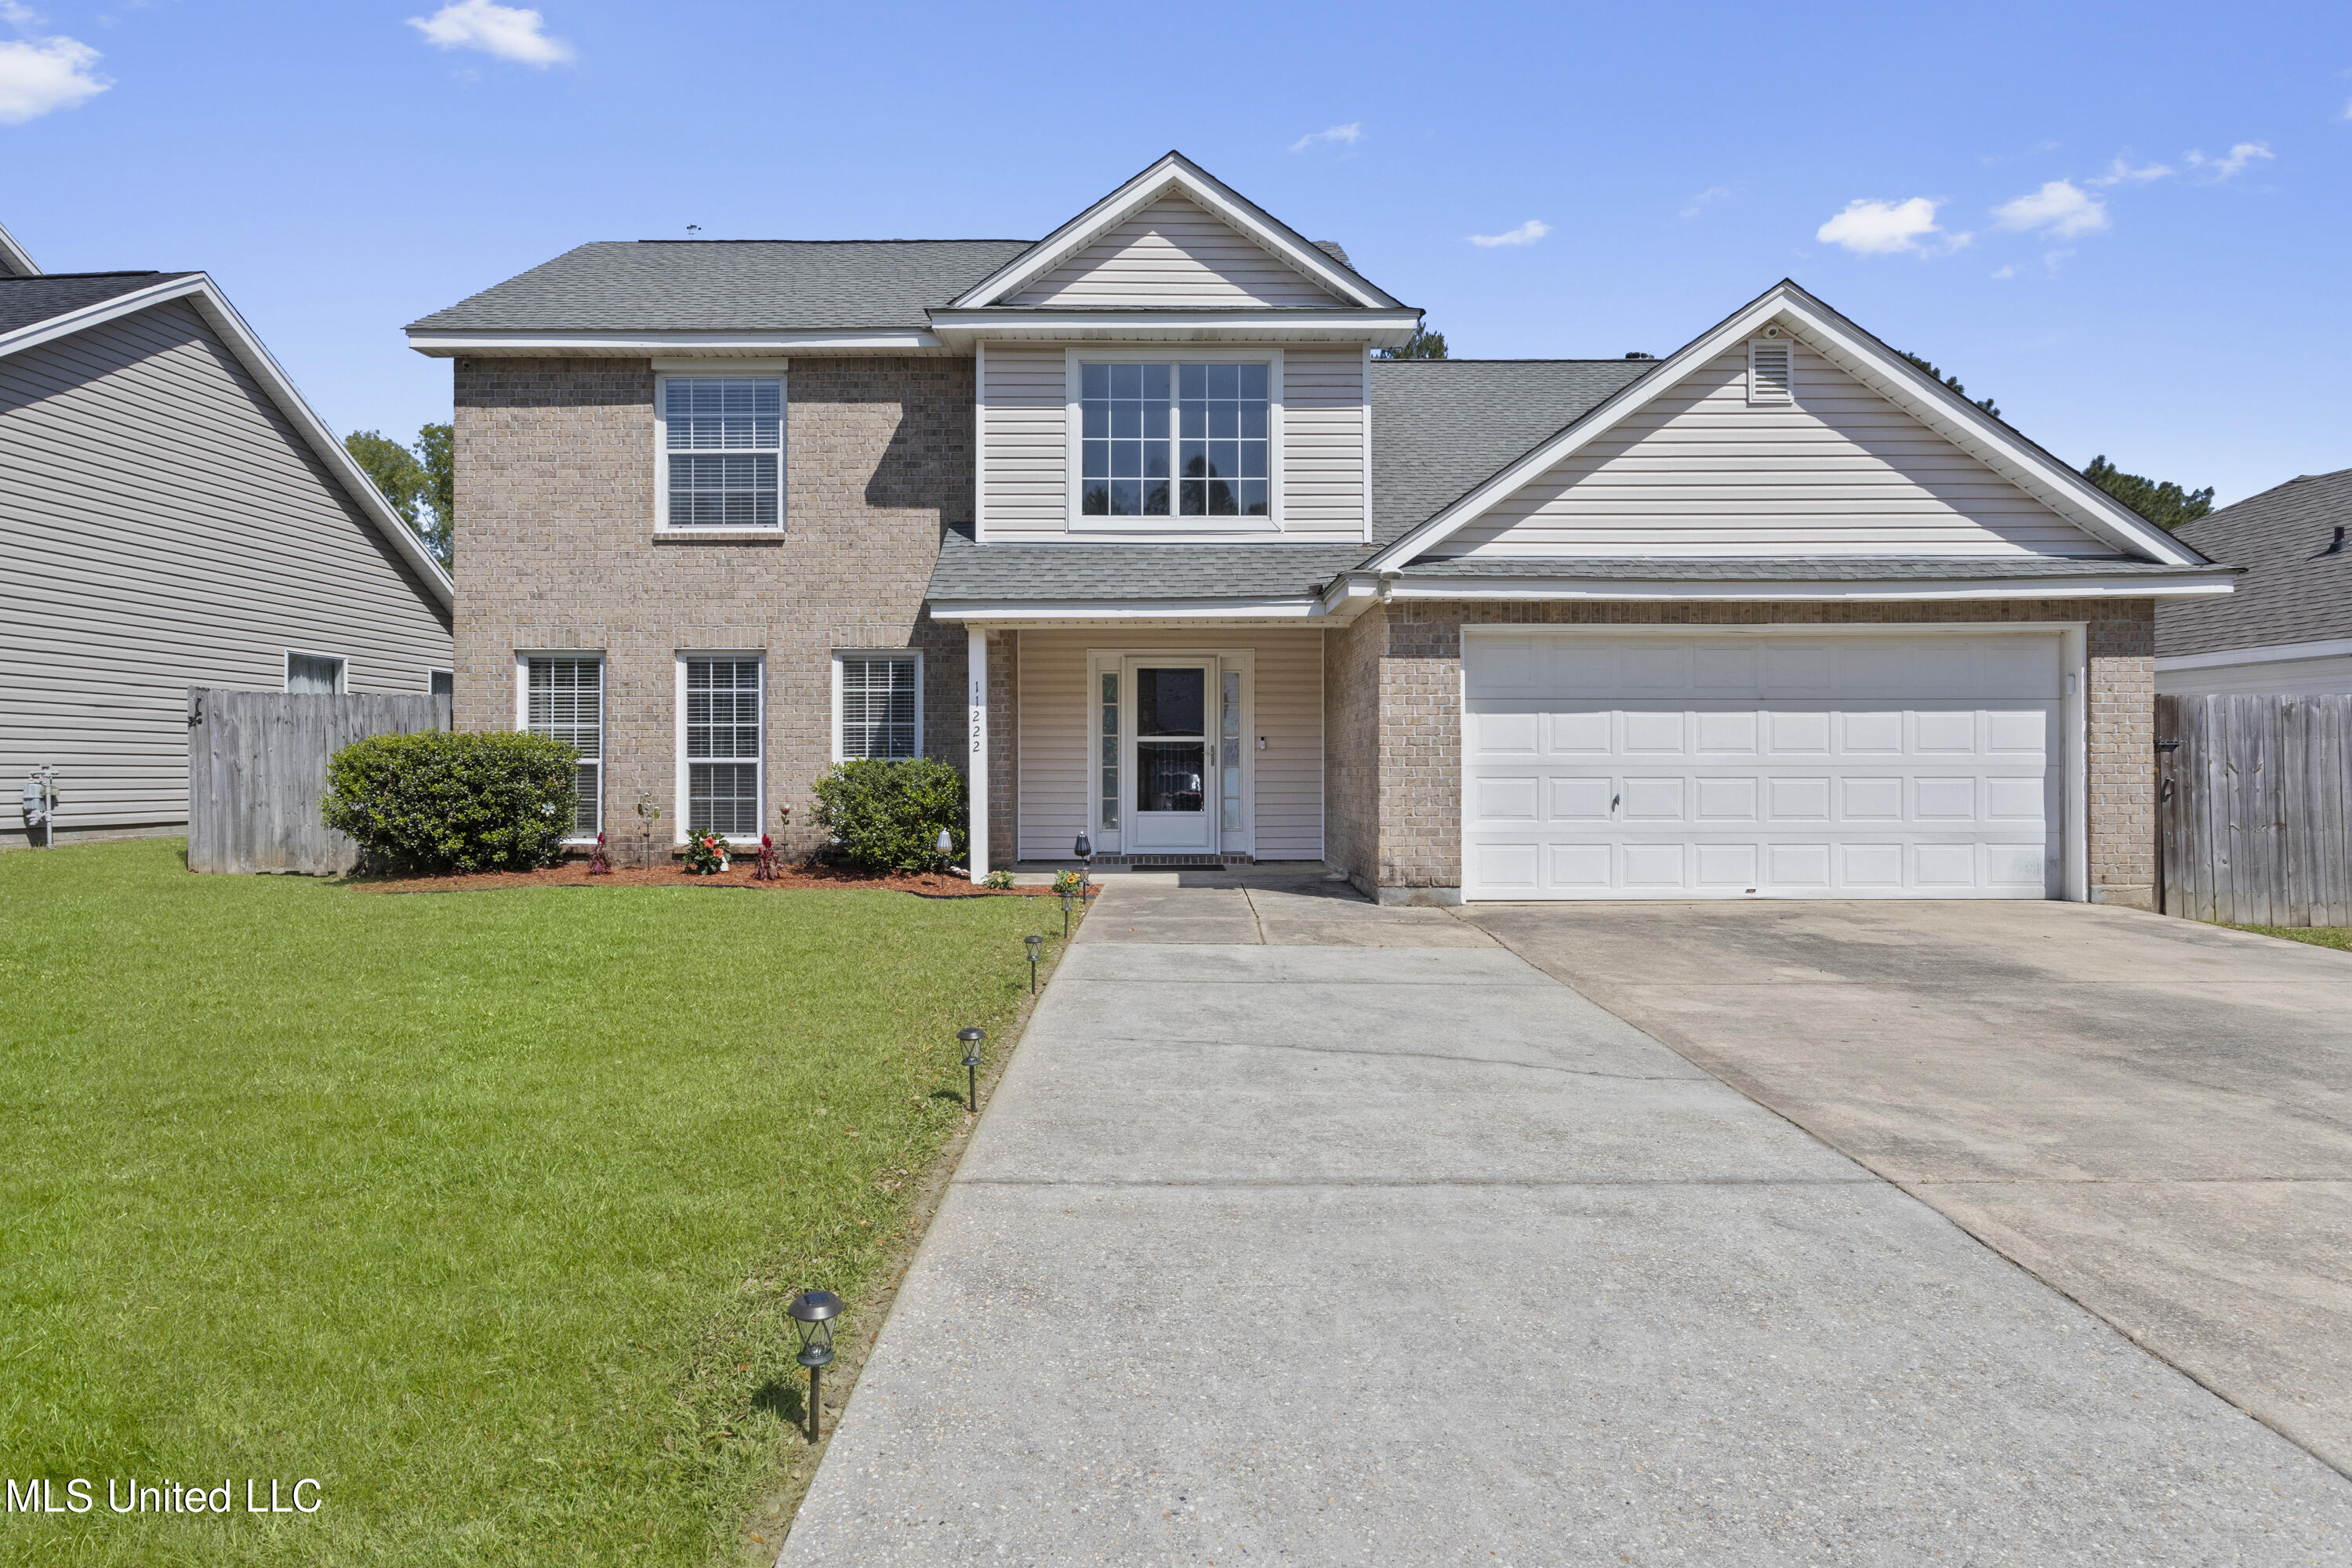
Active
$274,000
3
bds
|
3
ba
|
0
sqft
|
built
2002
11222 Cypress Bayou Dr, Gulfport, MS 39503
$-92
Cash flow
-1.8%
Cash-on-Cash Return
5.3%
Cap rate
0.7%
Rent to Value Ratio
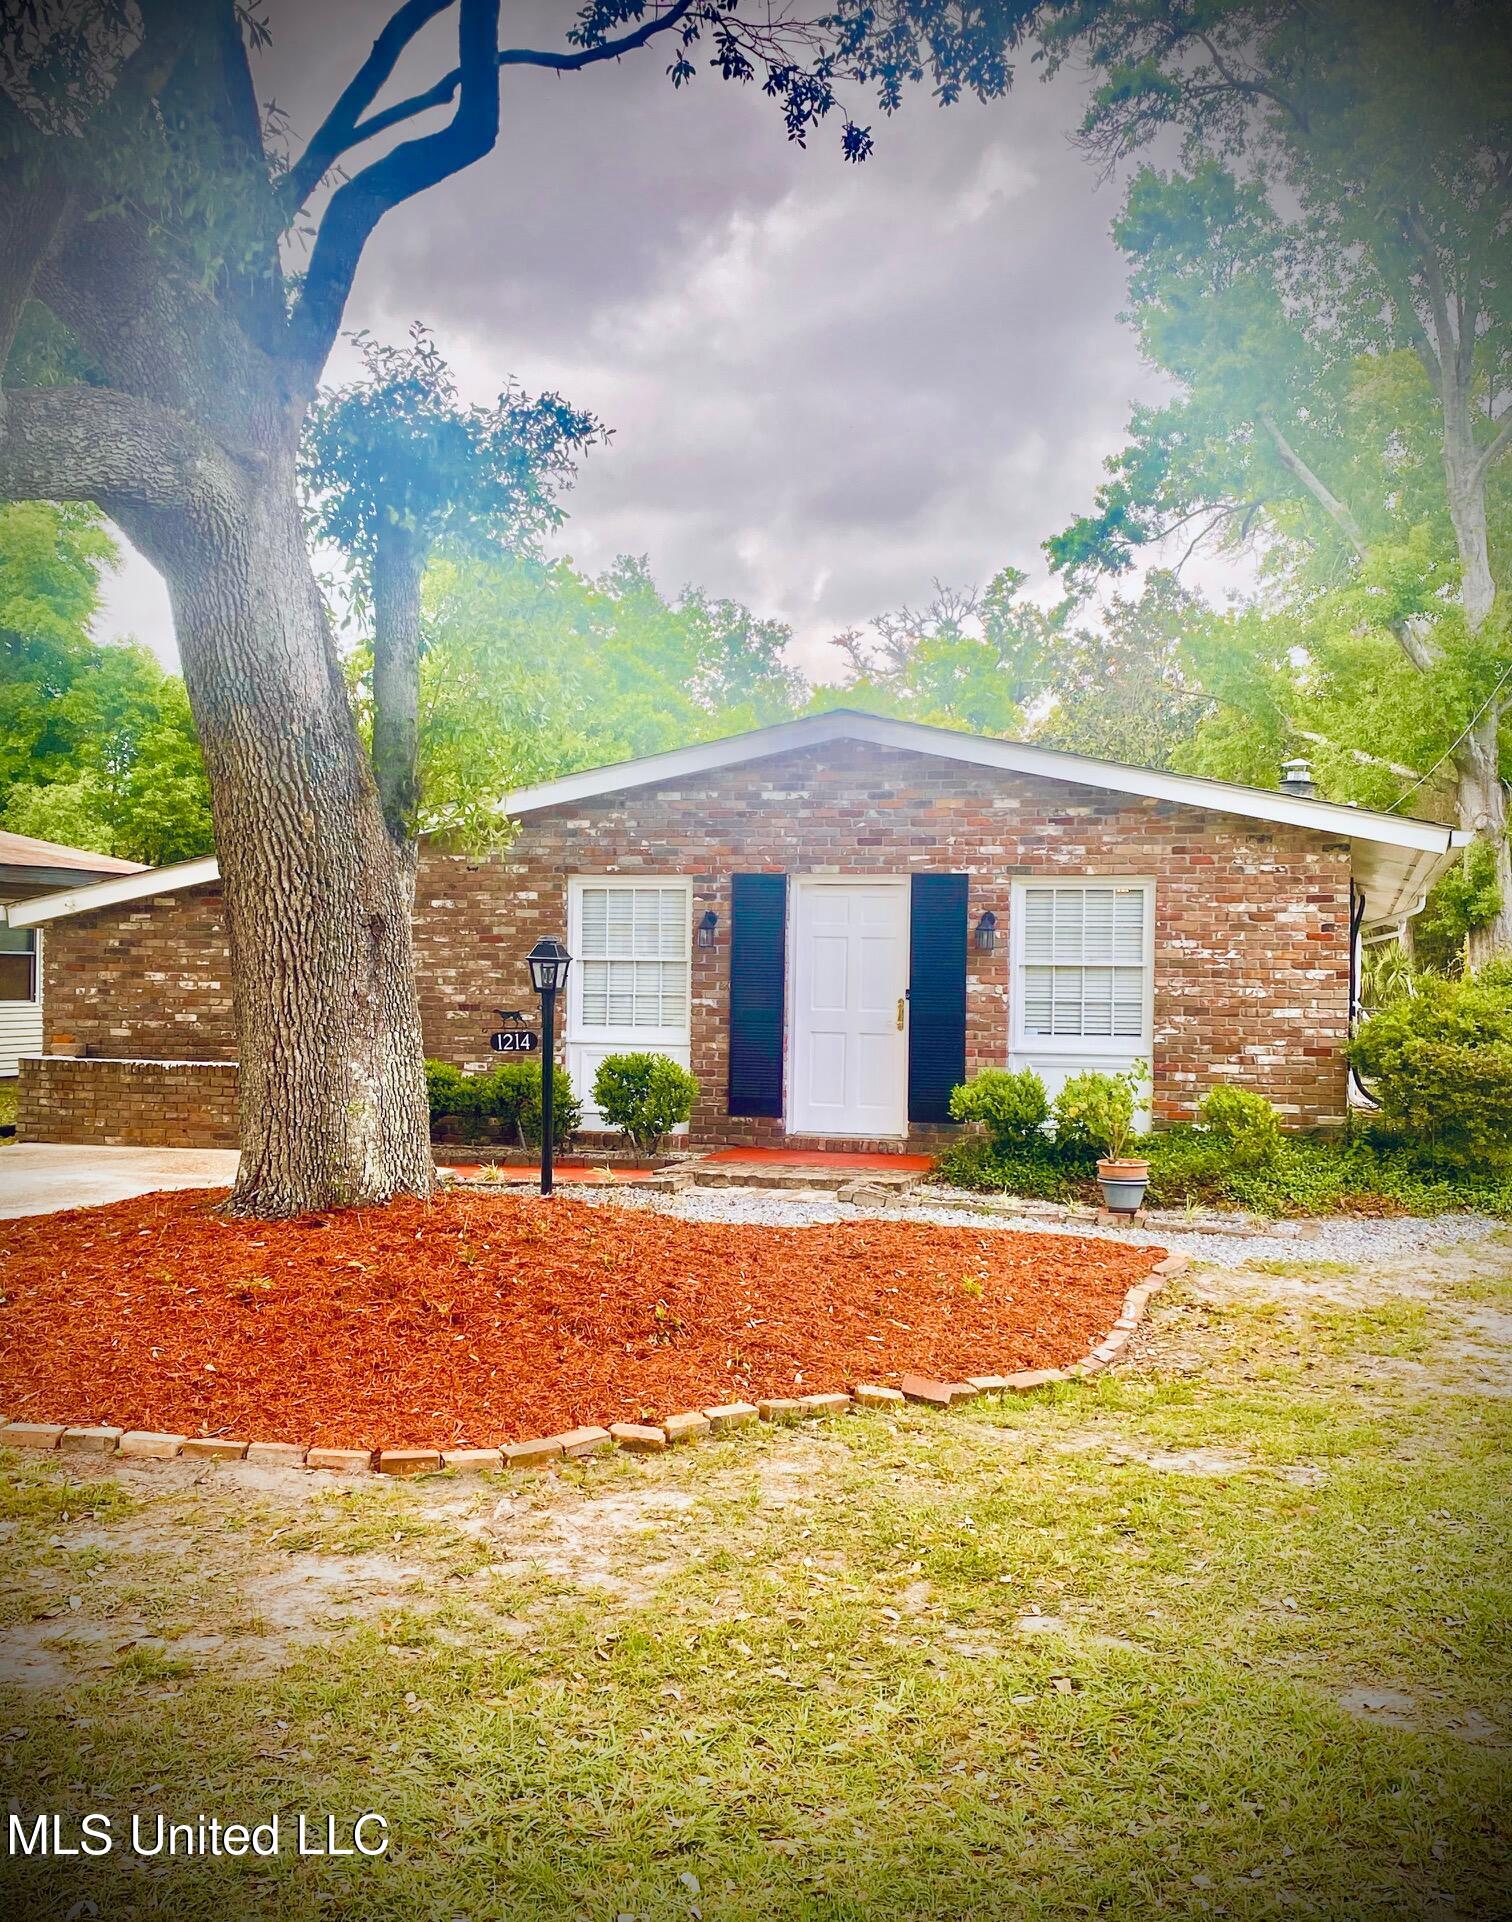
Active
$209,000
3
bds
|
3
ba
|
0
sqft
|
built
1963
1214 22nd St, Gulfport, MS 39501
$384
Cash flow
9.6%
Cash-on-Cash Return
7.9%
Cap rate
1.0%
Rent to Value Ratio

Active
$675,000
4
bds
|
4
ba
|
0
sqft
|
built
2014
1117 2nd St, Gulfport, MS 39501
$-1,440
Cash flow
-11.1%
Cash-on-Cash Return
3.1%
Cap rate
0.5%
Rent to Value Ratio

Active
$415,000
5
bds
|
3
ba
|
0
sqft
|
built
1904
1116 32nd Ave, Gulfport, MS 39501
$-3
Cash flow
0.0%
Cash-on-Cash Return
5.7%
Cap rate
0.7%
Rent to Value Ratio

Active
$339,900
3
bds
|
3
ba
|
0
sqft
|
built
2014
14093 Old Mossy Trl, Gulfport, MS 39503
$-321
Cash flow
-4.9%
Cash-on-Cash Return
4.5%
Cap rate
0.6%
Rent to Value Ratio

Active
$489,000
5
bds
|
3
ba
|
0
sqft
|
built
1987
14221 Country Wood Dr, Gulfport, MS 39503
$-898
Cash flow
-9.6%
Cash-on-Cash Return
3.5%
Cap rate
0.5%
Rent to Value Ratio
Active
$89,000
3
bds
|
1
ba
|
0
sqft
|
built
1950
2020 41st Ave, Gulfport, MS 39501
$387
Cash flow
22.7%
Cash-on-Cash Return
10.9%
Cap rate
1.5%
Rent to Value Ratio
Active
$210,000
3
bds
|
3
ba
|
0
sqft
|
built
1981
12384 Crestview Ct, Gulfport, MS 39503
$313
Cash flow
7.8%
Cash-on-Cash Return
7.5%
Cap rate
1.0%
Rent to Value Ratio
Active
$696,000
6
bds
|
5
ba
|
0
sqft
|
built
1994
12918 Coles Cv, Gulfport, MS 39503
$-1,879
Cash flow
-14.1%
Cash-on-Cash Return
2.4%
Cap rate
0.5%
Rent to Value Ratio