Gulfport, MS Investment Properties for Sale
Browse homes for sale and investment properties in Gulfport, MS. Refine your search by price, property type, or more.
Best cash flowing properties in Gulfport, MS
Active
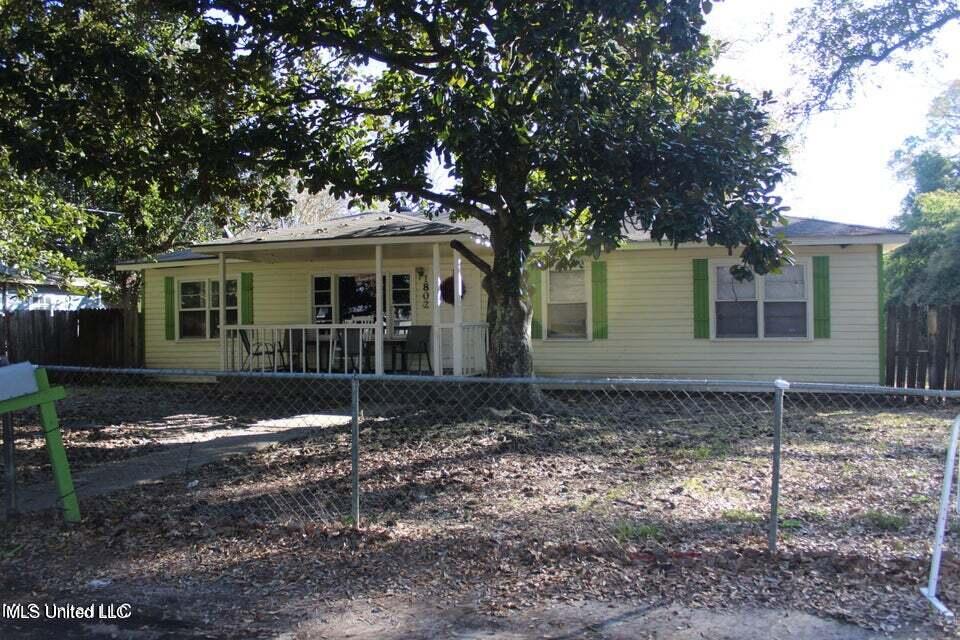
$90,000
4
bds
|
2
ba
|
0
sqft
|
built
1960
1802 41st Ave, Gulfport, MS 39501
$350
Cash flow
20.3%
Cash-on-Cash Return
10.9%
Cap rate
1.4%
Rent to Value Ratio
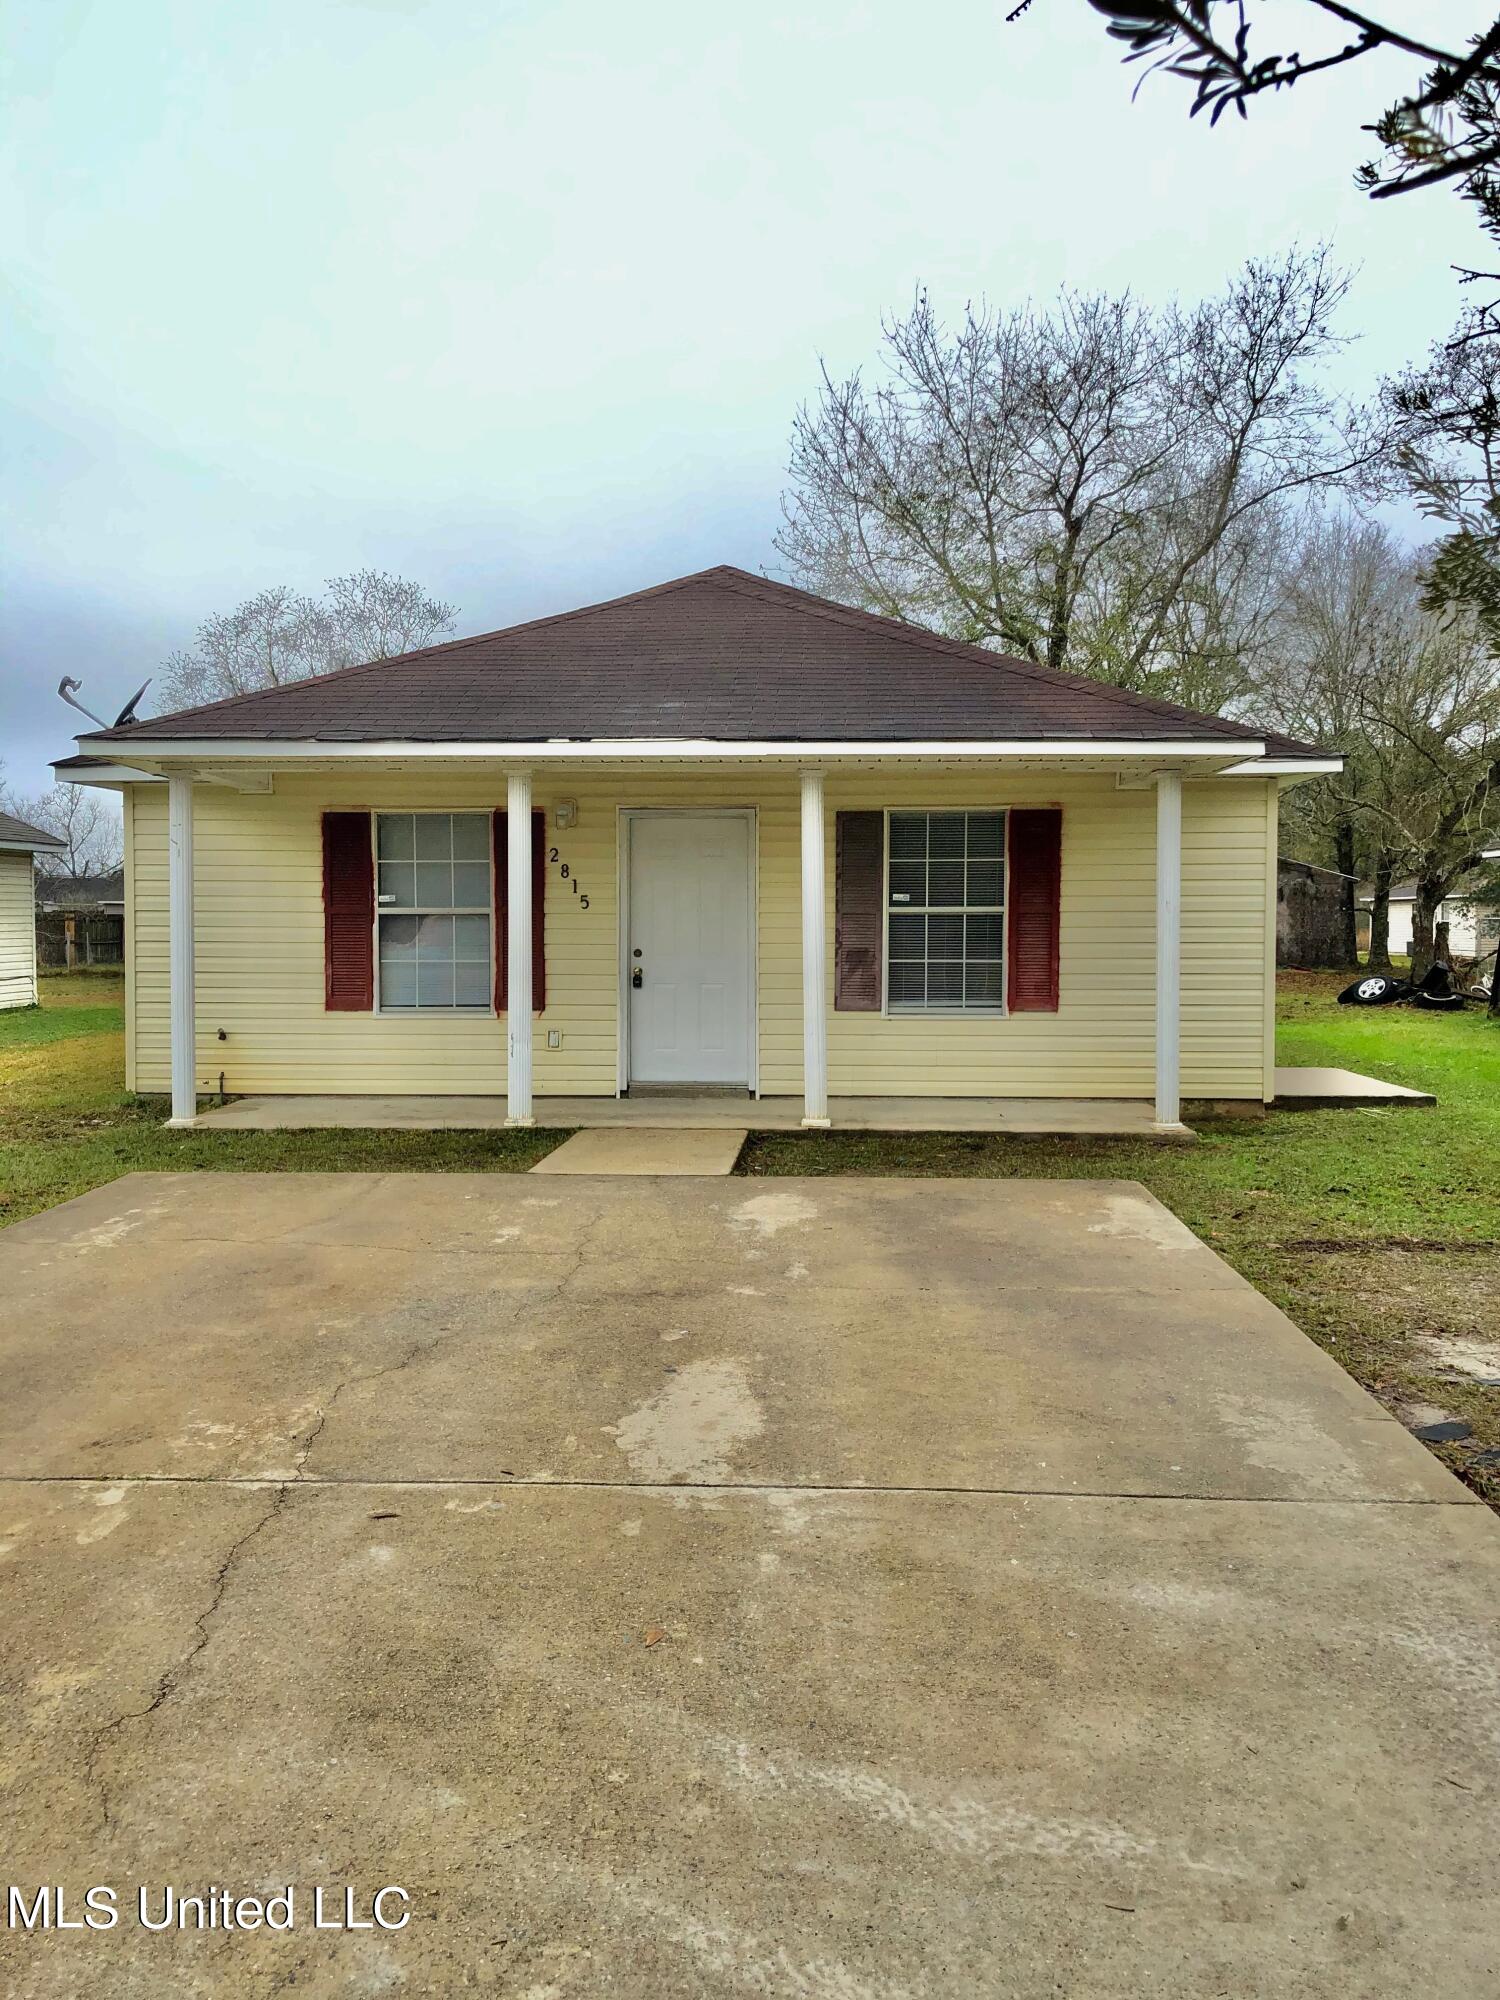
Active
$125,000
3
bds
|
2
ba
|
0
sqft
|
built
2000
2815 57th Ave, Gulfport, MS 39501
$225
Cash flow
9.4%
Cash-on-Cash Return
8.4%
Cap rate
1.1%
Rent to Value Ratio
298 out of 325 properties for sale in Gulfport, MS
Limited Results Shown
Create a free account, or log in to reveal all property listings and enjoy the complete experience.
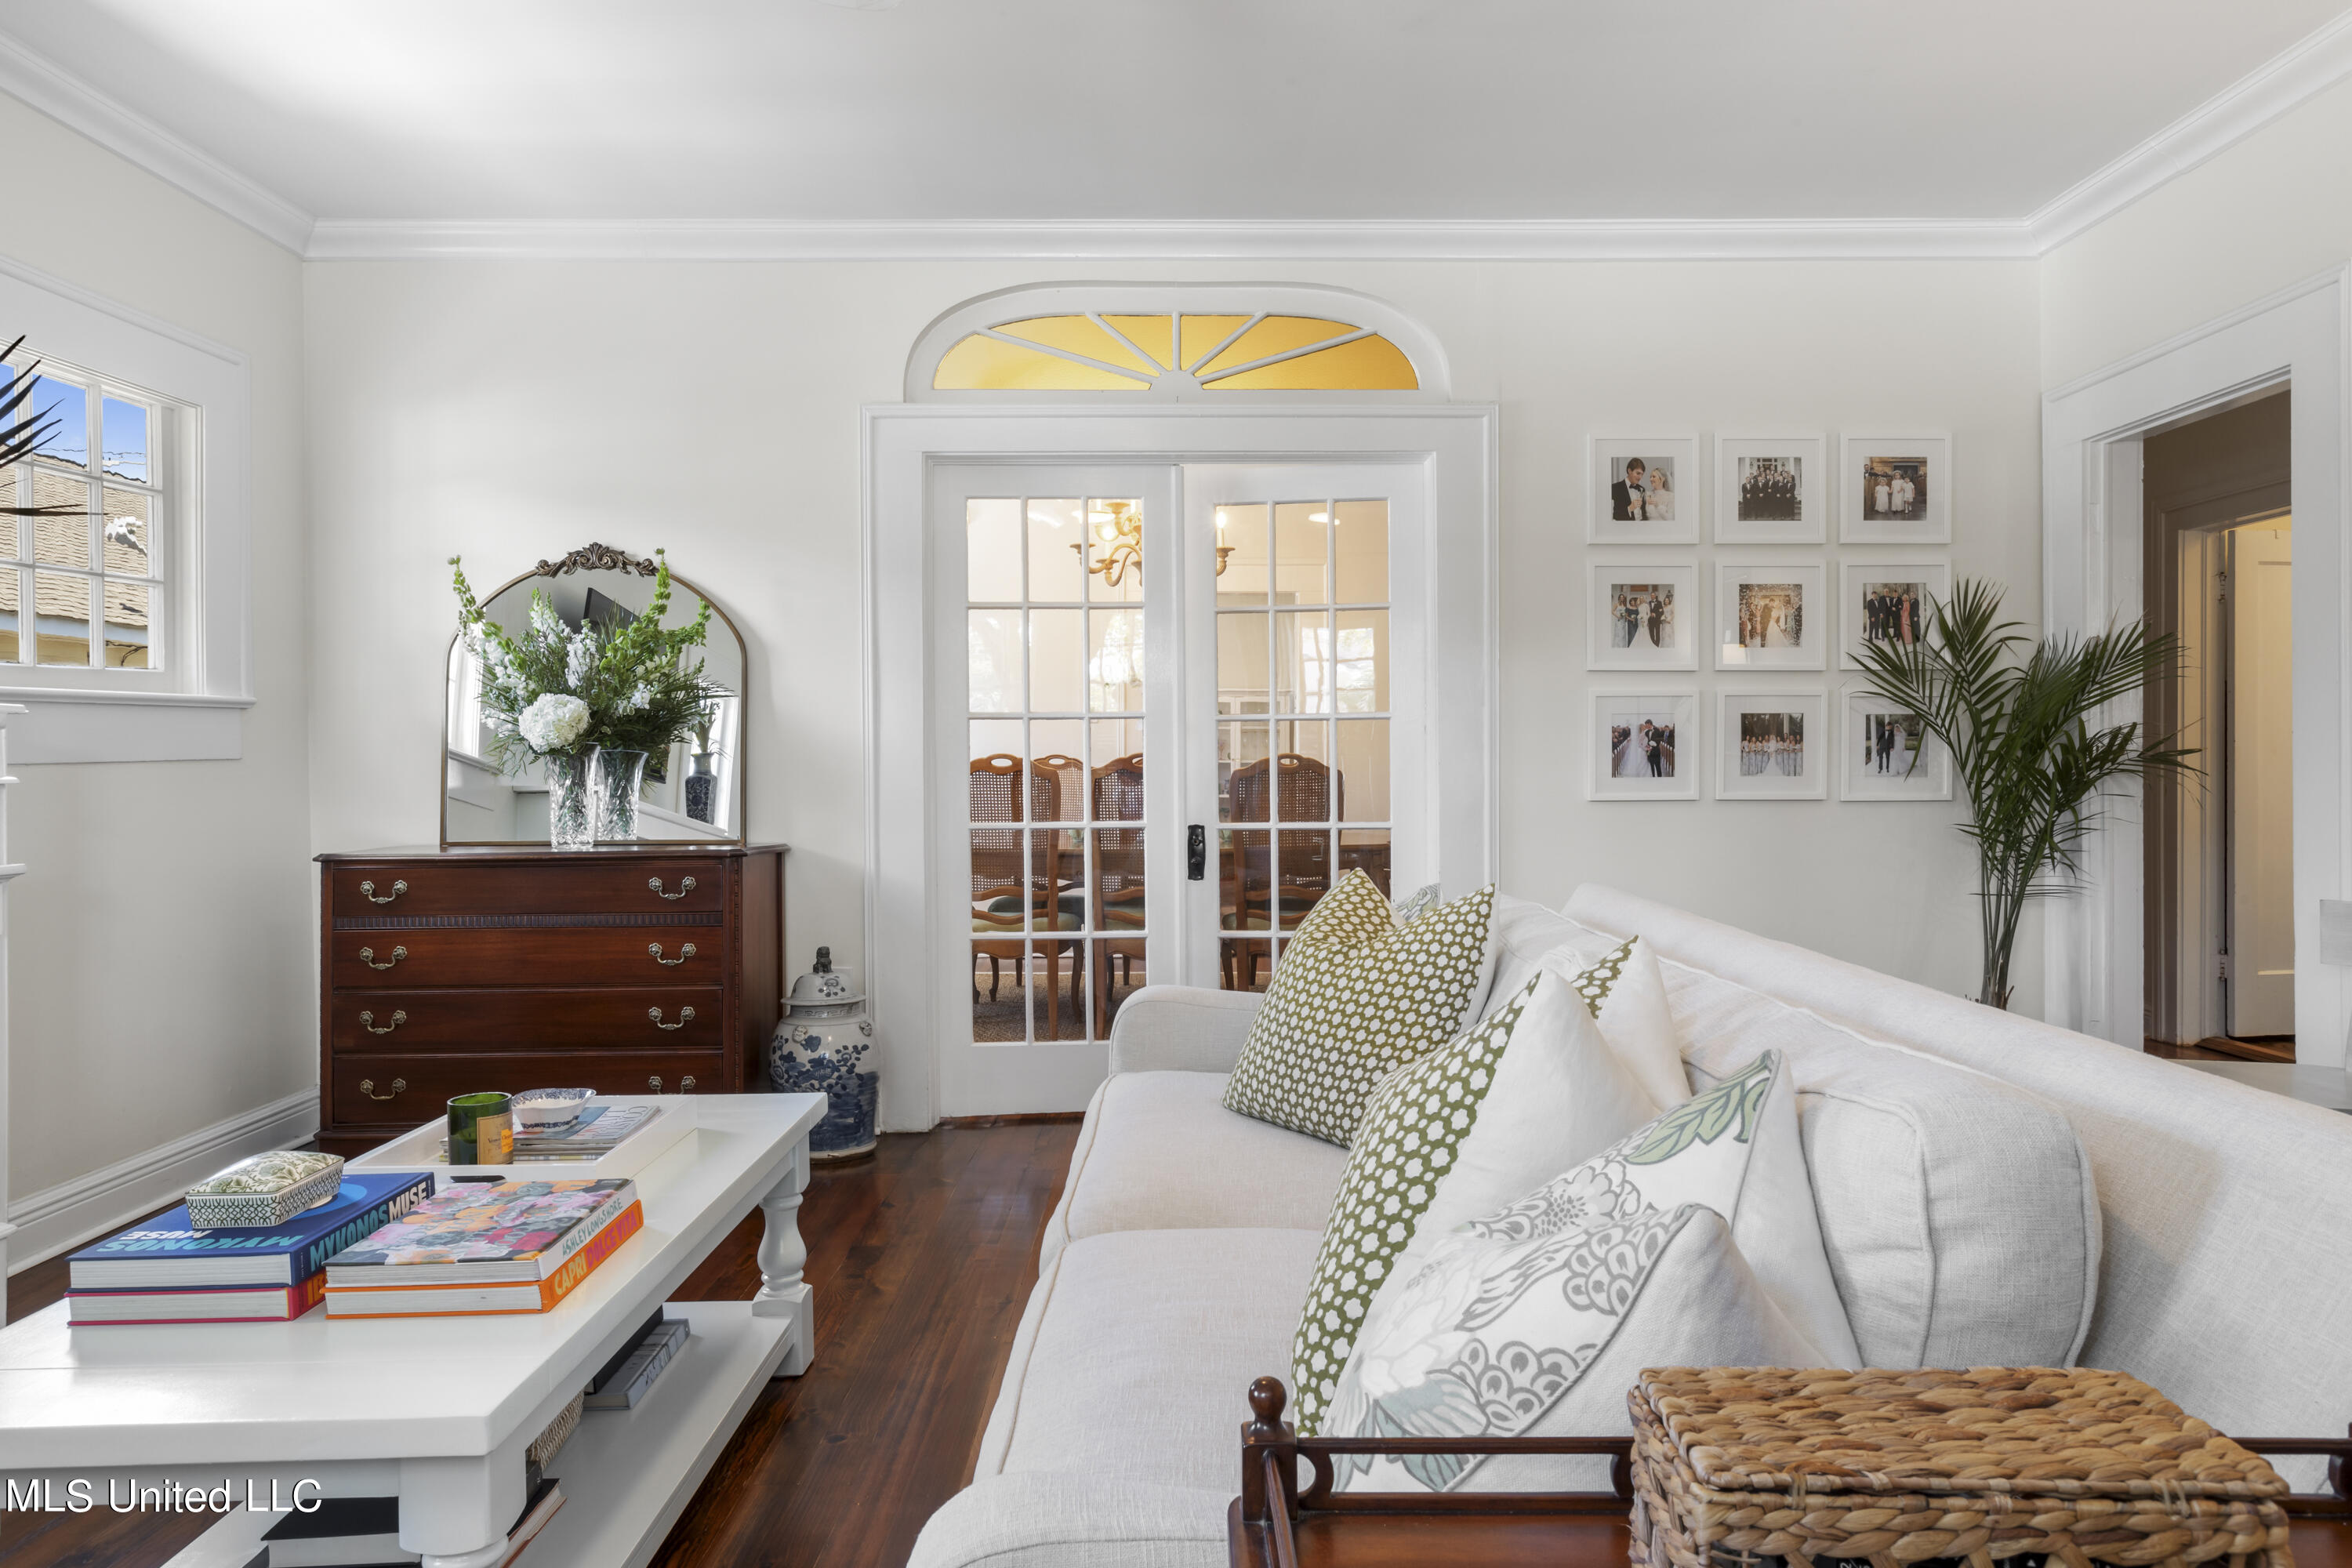
Active
$440,000
3
bds
|
3
ba
|
0
sqft
|
built
1922
1442 2nd St, Gulfport, MS 39501
$-146
Cash flow
-1.7%
Cash-on-Cash Return
5.9%
Cap rate
0.8%
Rent to Value Ratio
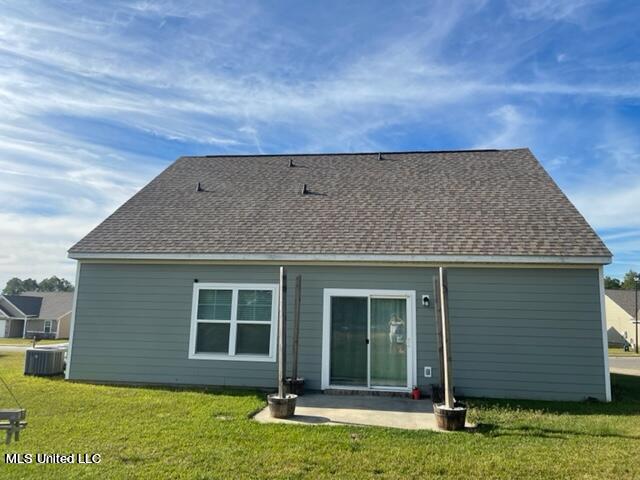
Active
$250,990
3
bds
|
3
ba
|
0
sqft
|
built
2021
14799 Audubon Lake Blvd, Gulfport, MS 39503
$-151
Cash flow
-3.1%
Cash-on-Cash Return
5.6%
Cap rate
0.8%
Rent to Value Ratio
Active
$330,000
4
bds
|
2
ba
|
0
sqft
|
built
1966
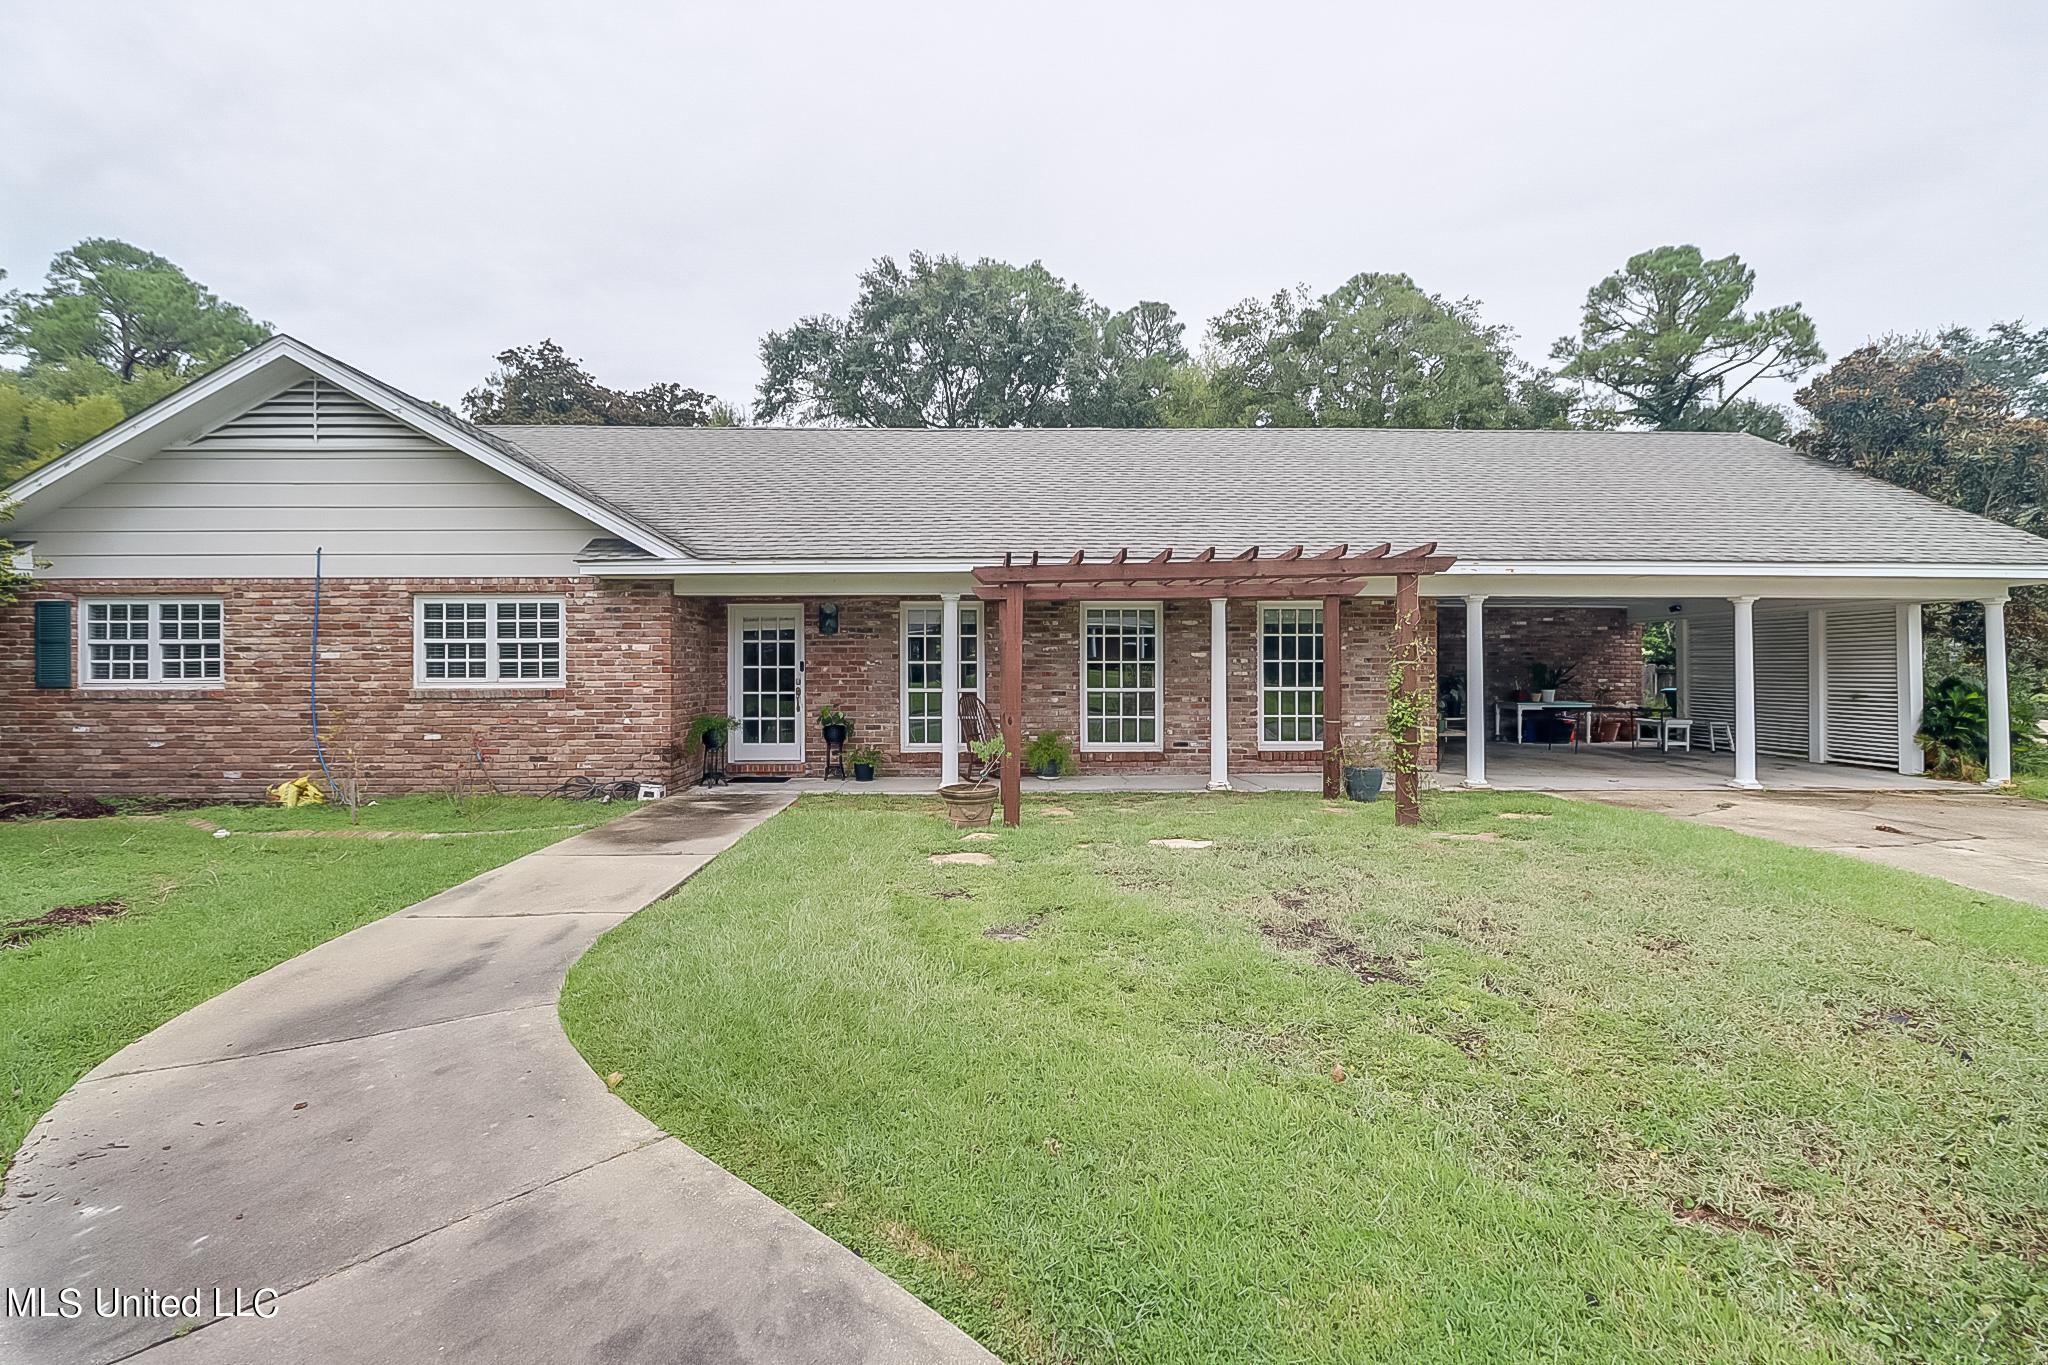
1 Bayou View Dr, Gulfport, MS 39507
$23
Cash flow
0.4%
Cash-on-Cash Return
6.4%
Cap rate
0.8%
Rent to Value Ratio
Active
$438,000
4
bds
|
3
ba
|
0
sqft
|
built
1900
1632 2nd St, Gulfport, MS 39501
$-326
Cash flow
-3.9%
Cash-on-Cash Return
5.4%
Cap rate
0.7%
Rent to Value Ratio
Active
$90,000
4
bds
|
2
ba
|
0
sqft
|
built
1960
1802 41st Ave, Gulfport, MS 39501
$350
Cash flow
20.3%
Cash-on-Cash Return
10.9%
Cap rate
1.4%
Rent to Value Ratio
Active
$265,900
3
bds
|
3
ba
|
0
sqft
|
built
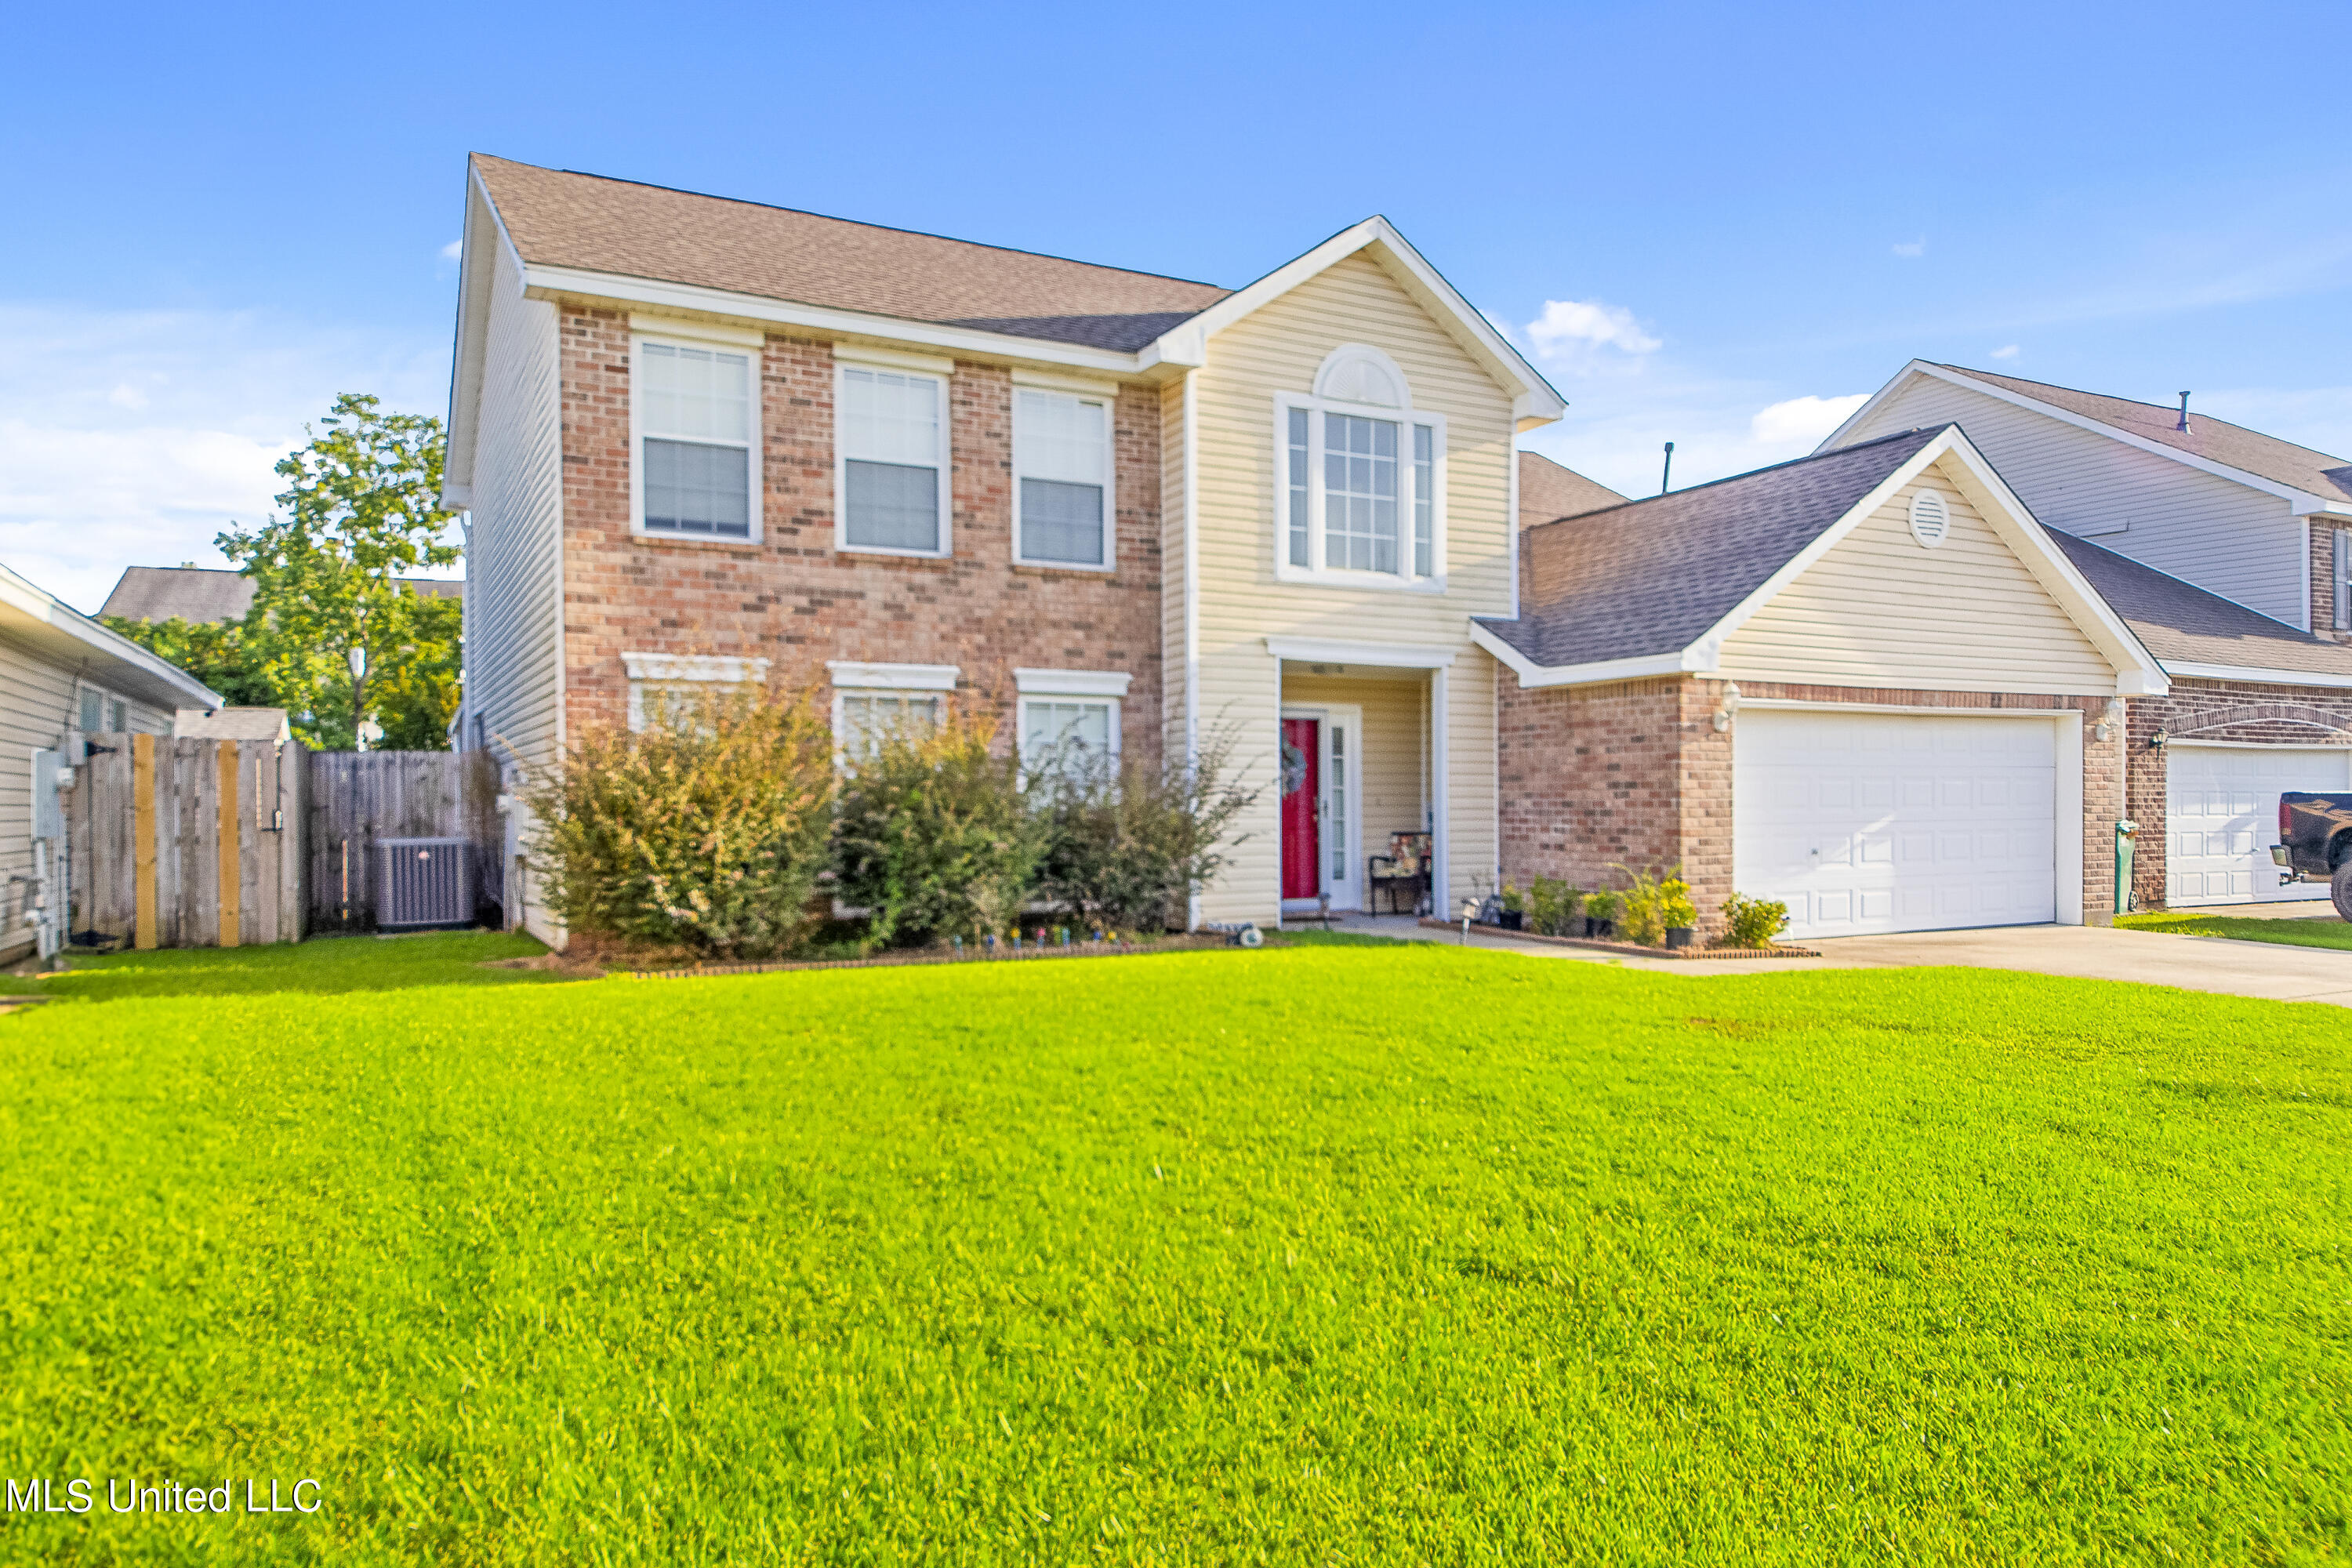
2004
18123 Lake Vista Dr, Gulfport, MS 39503
$20
Cash flow
0.4%
Cash-on-Cash Return
6.4%
Cap rate
0.9%
Rent to Value Ratio
Active
$149,900
3
bds
|
1
ba
|
0
sqft
|
built
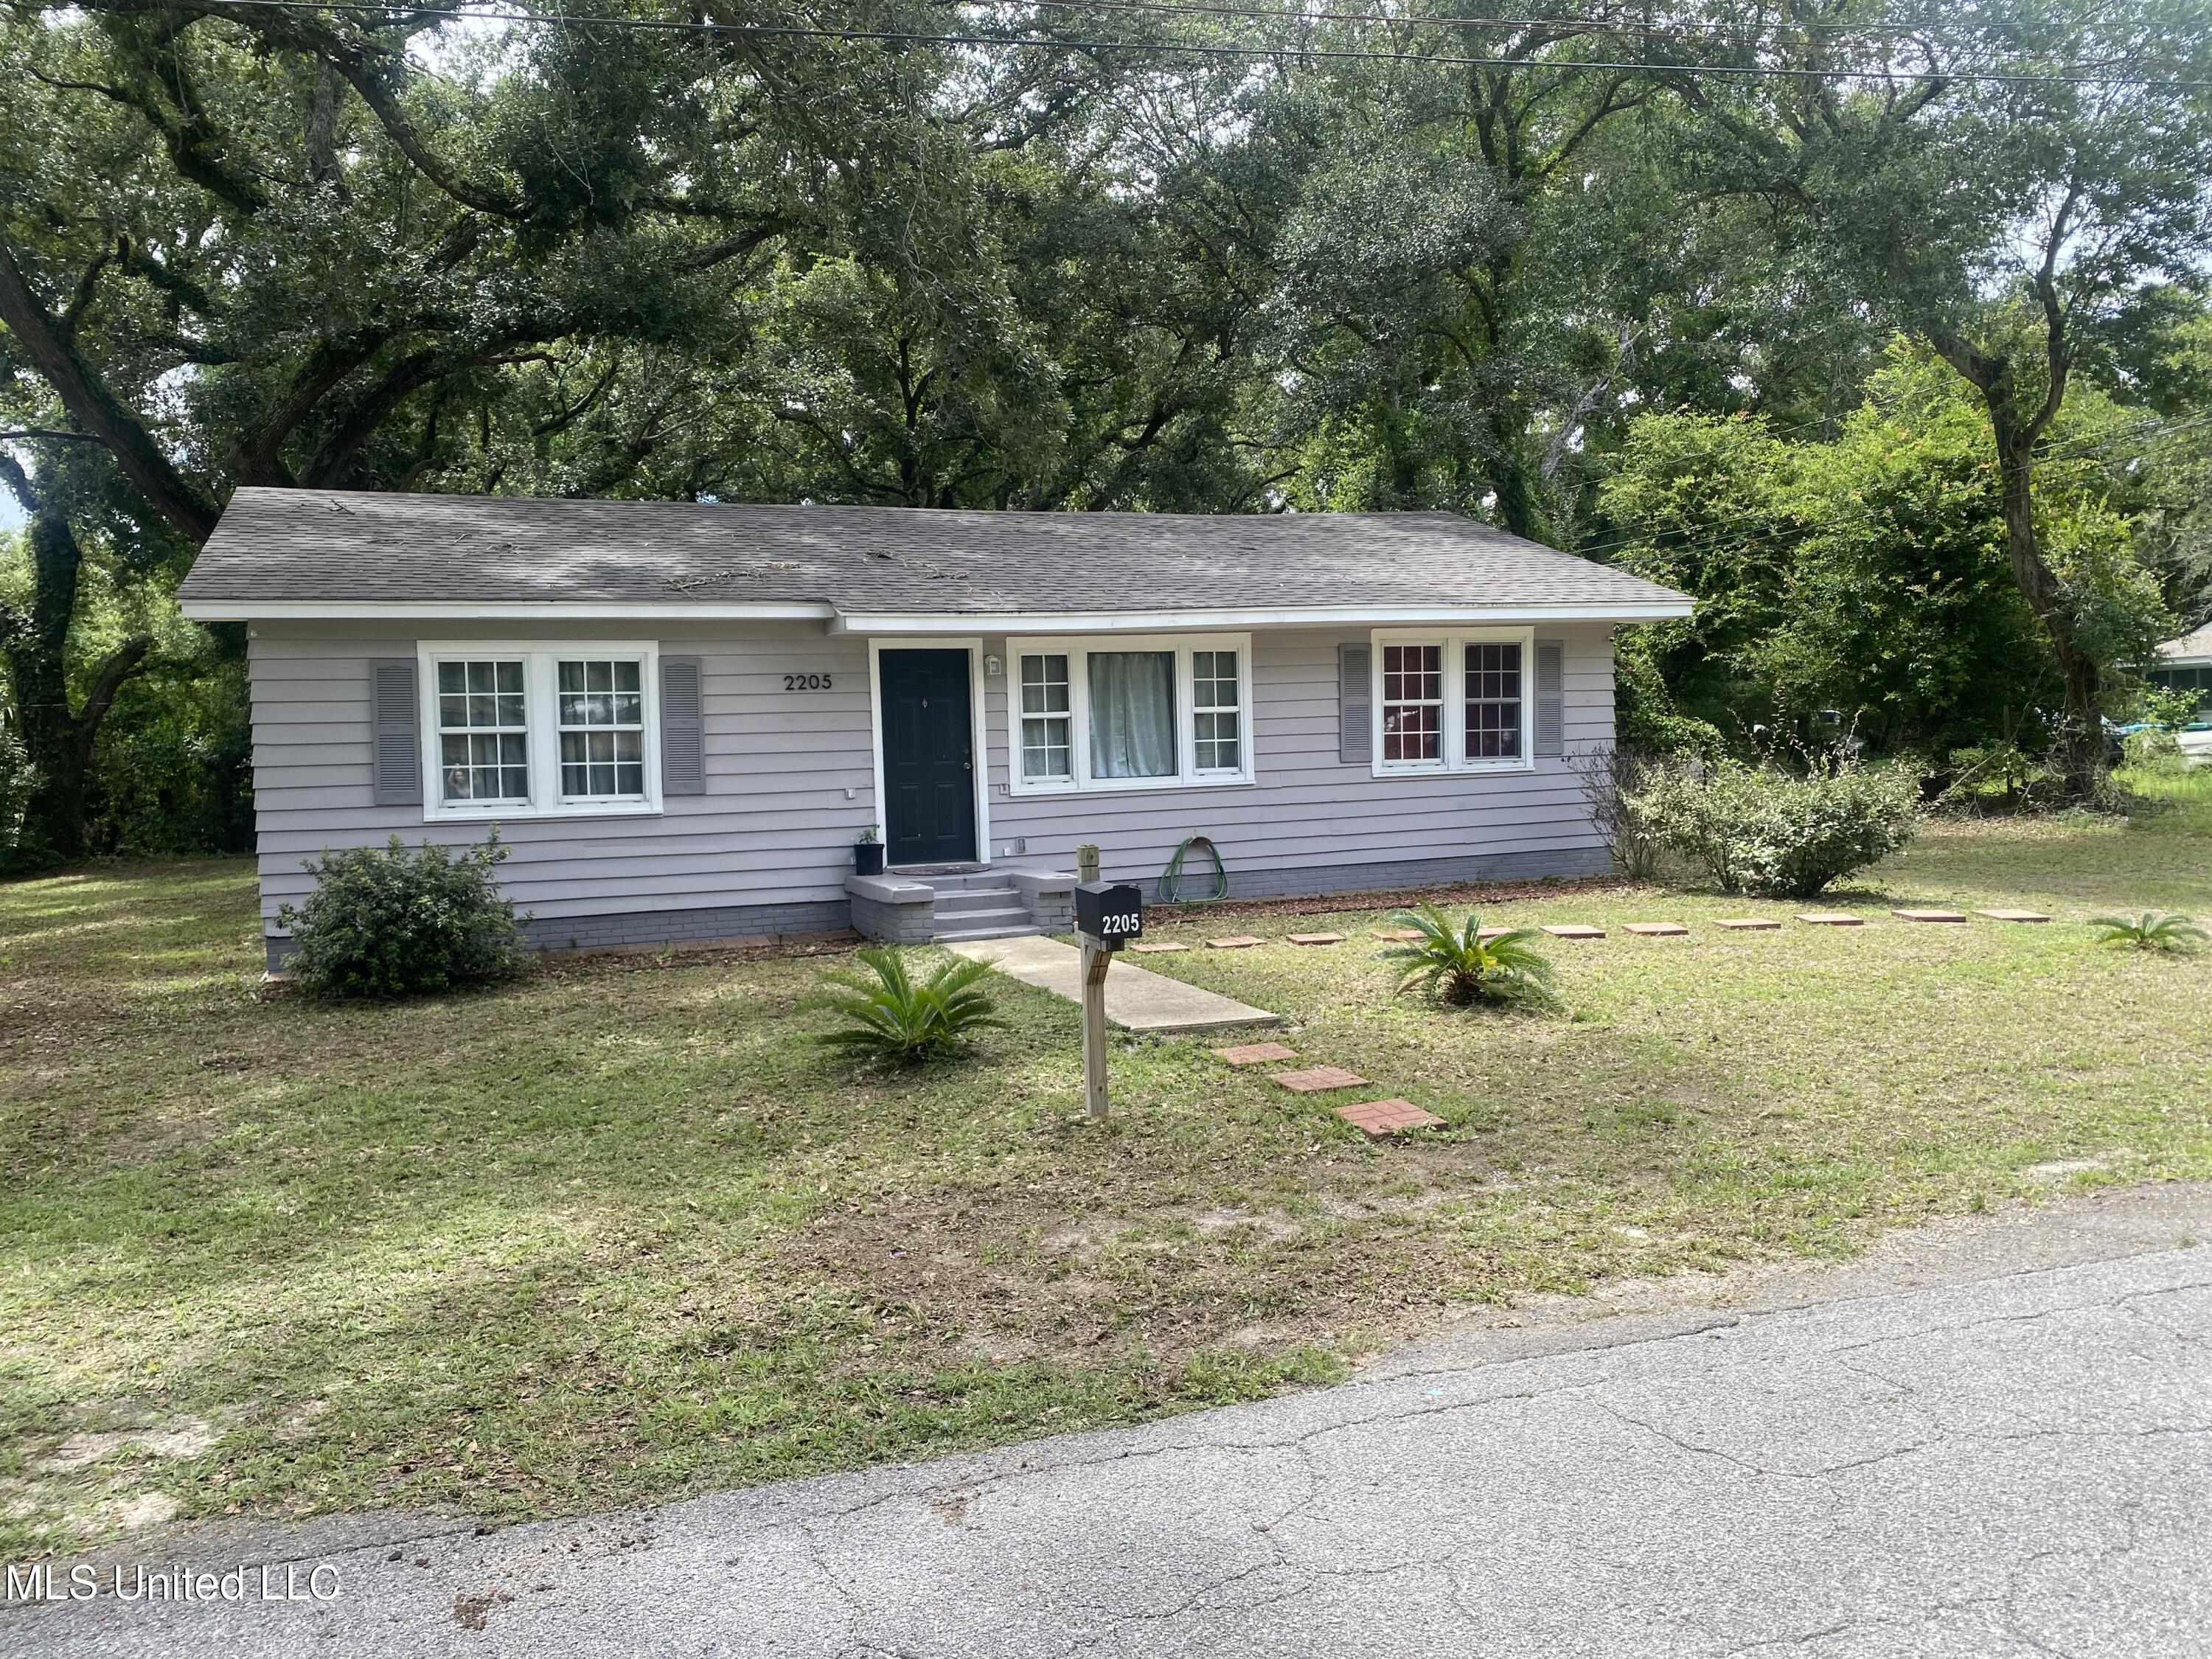
1956
2205 Oak Ave, Gulfport, MS 39507
$218
Cash flow
7.6%
Cash-on-Cash Return
8.0%
Cap rate
1.1%
Rent to Value Ratio
Active
$2,490,000
3
bds
|
4
ba
|
0
sqft
|
built
2019
922 E Beach Blvd, Gulfport, MS 39501
$-9,507
Cash flow
-19.9%
Cash-on-Cash Return
1.7%
Cap rate
0.3%
Rent to Value Ratio
Active
$125,000
3
bds
|
2
ba
|
0
sqft
|
built
2000
2815 57th Ave, Gulfport, MS 39501
$225
Cash flow
9.4%
Cash-on-Cash Return
8.4%
Cap rate
1.1%
Rent to Value Ratio
Active
$419,900
3
bds
|
2
ba
|
0
sqft
|
built
2021
156 Markham Dr, Gulfport, MS 39507
$-30
Cash flow
-0.4%
Cash-on-Cash Return
6.2%
Cap rate
0.8%
Rent to Value Ratio
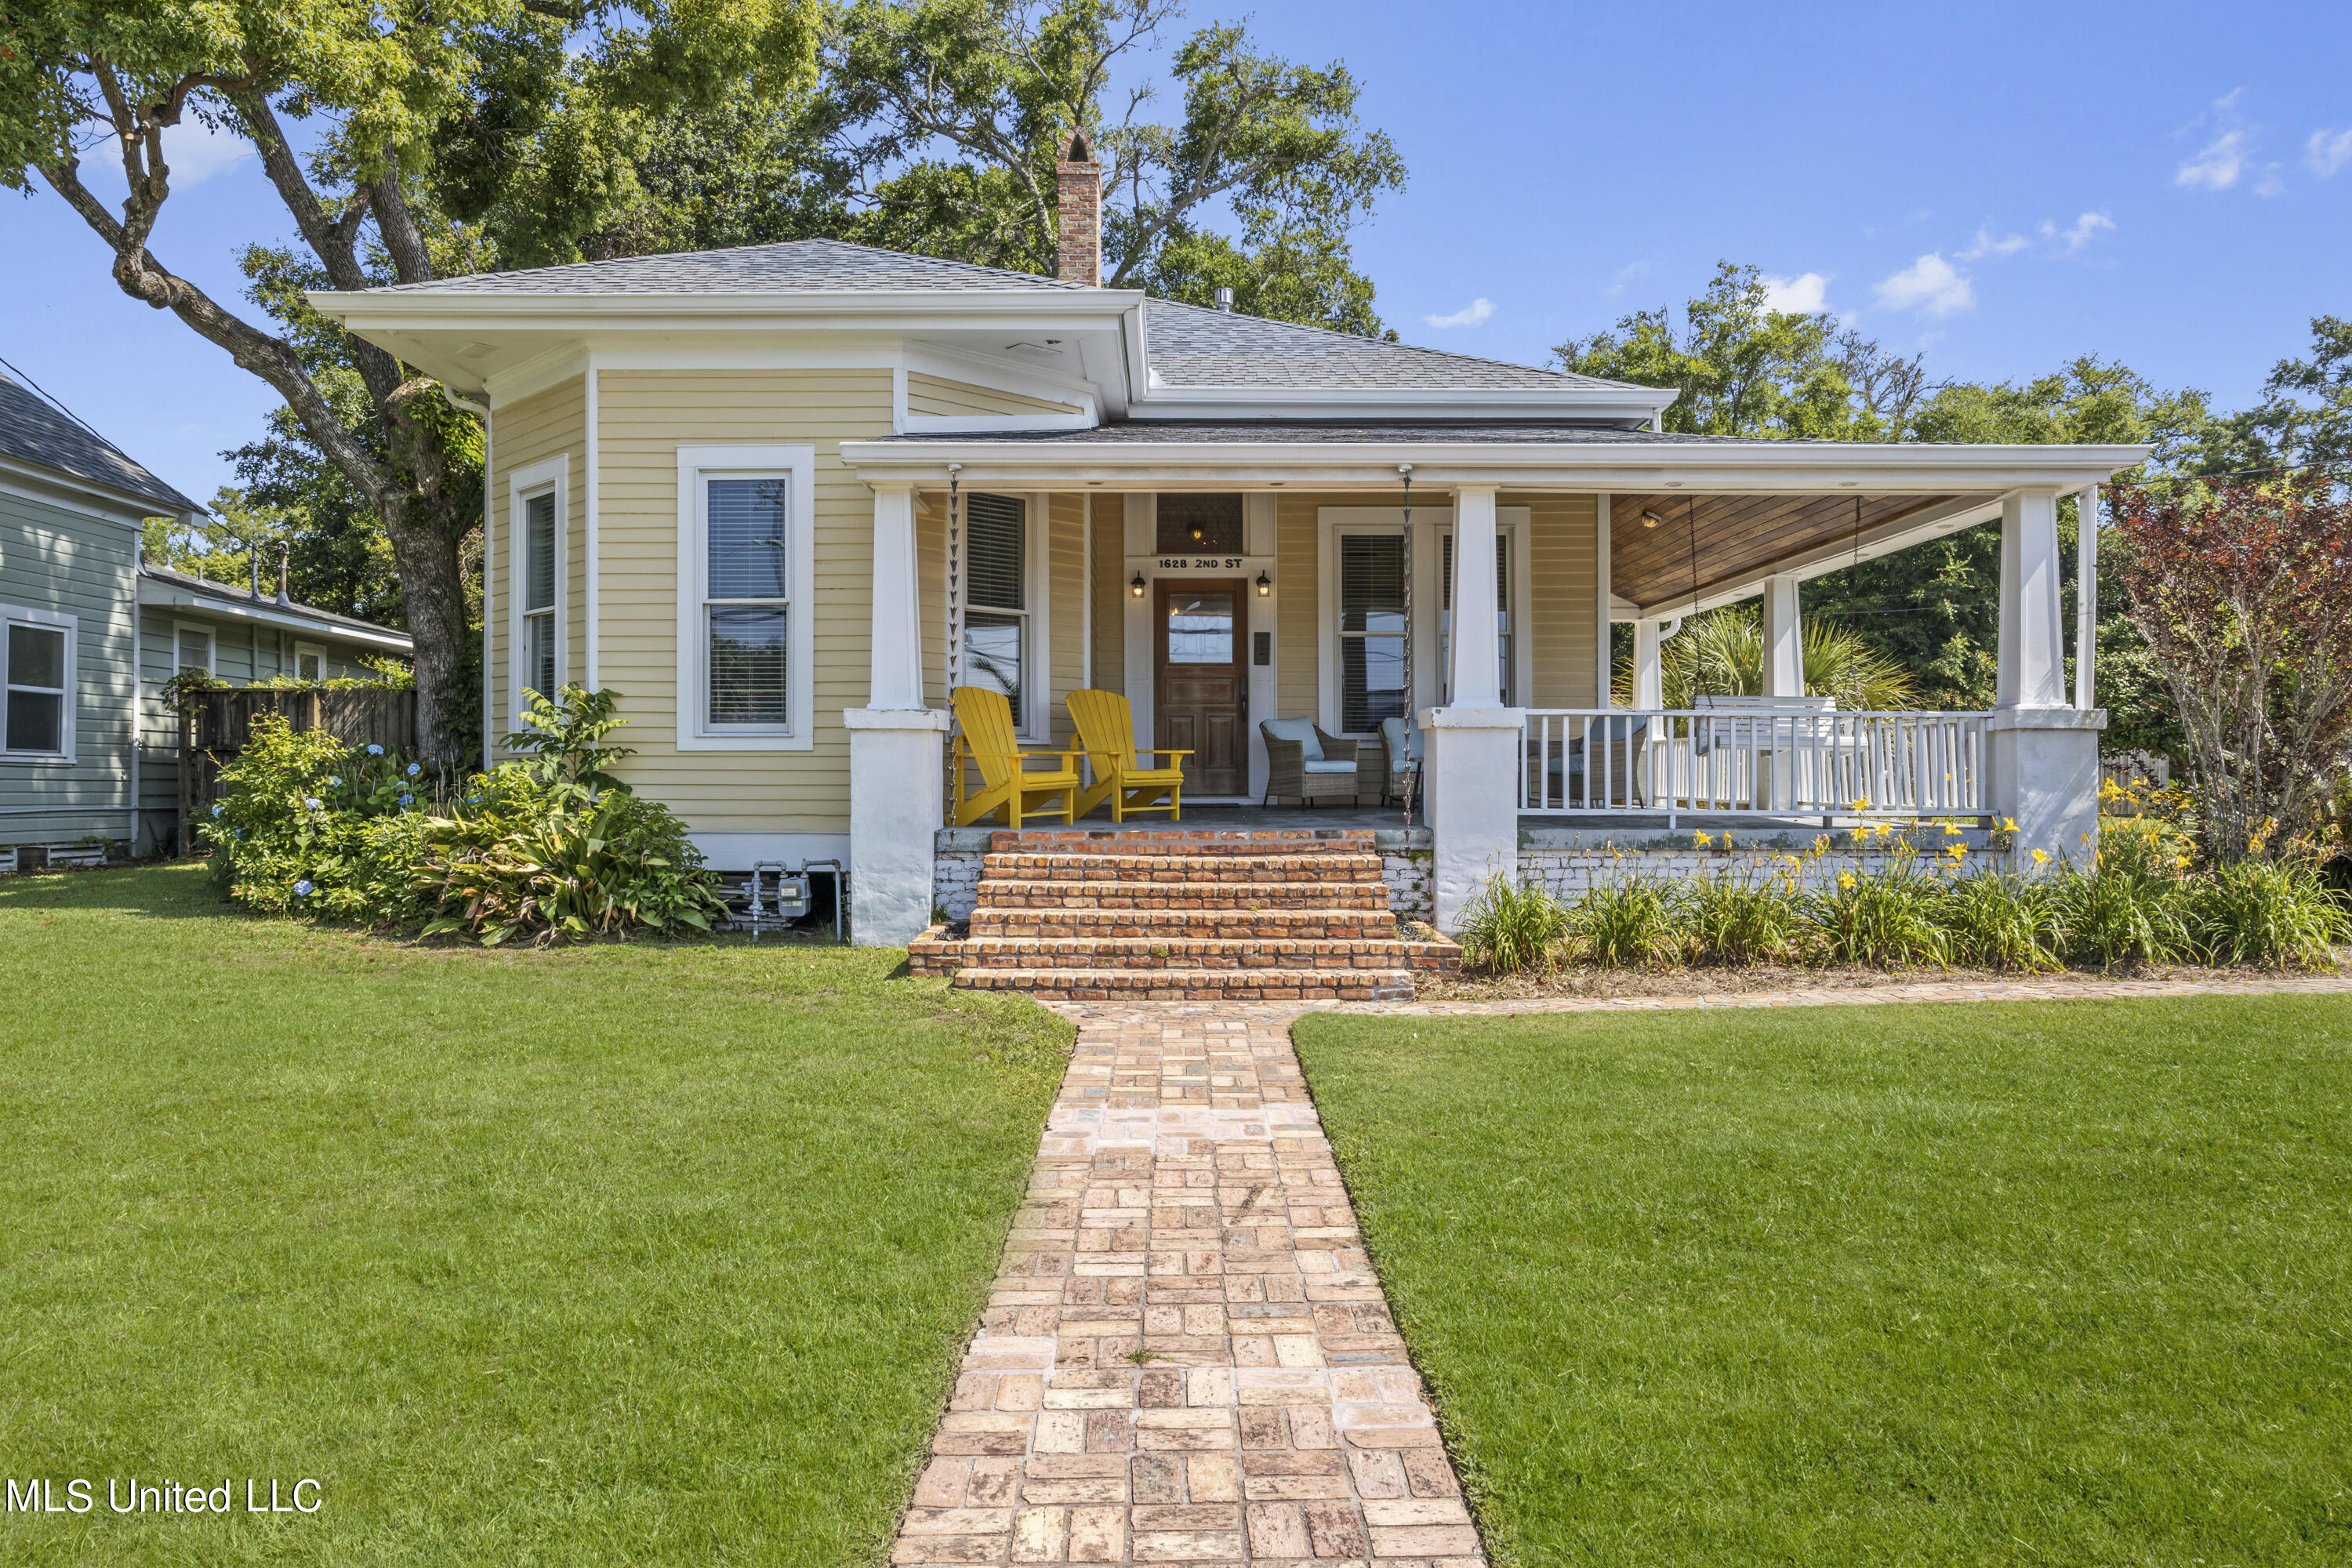
Active
$498,500
3
bds
|
3
ba
|
0
sqft
|
built
1901
1628 2nd St, Gulfport, MS 39501
$-558
Cash flow
-5.8%
Cash-on-Cash Return
4.9%
Cap rate
0.7%
Rent to Value Ratio
Active
$345,000
4
bds
|
3
ba
|
0
sqft
|
built
1980
69 Bayou Cir, Gulfport, MS 39507
$-346
Cash flow
-5.2%
Cash-on-Cash Return
5.1%
Cap rate
0.8%
Rent to Value Ratio
Active
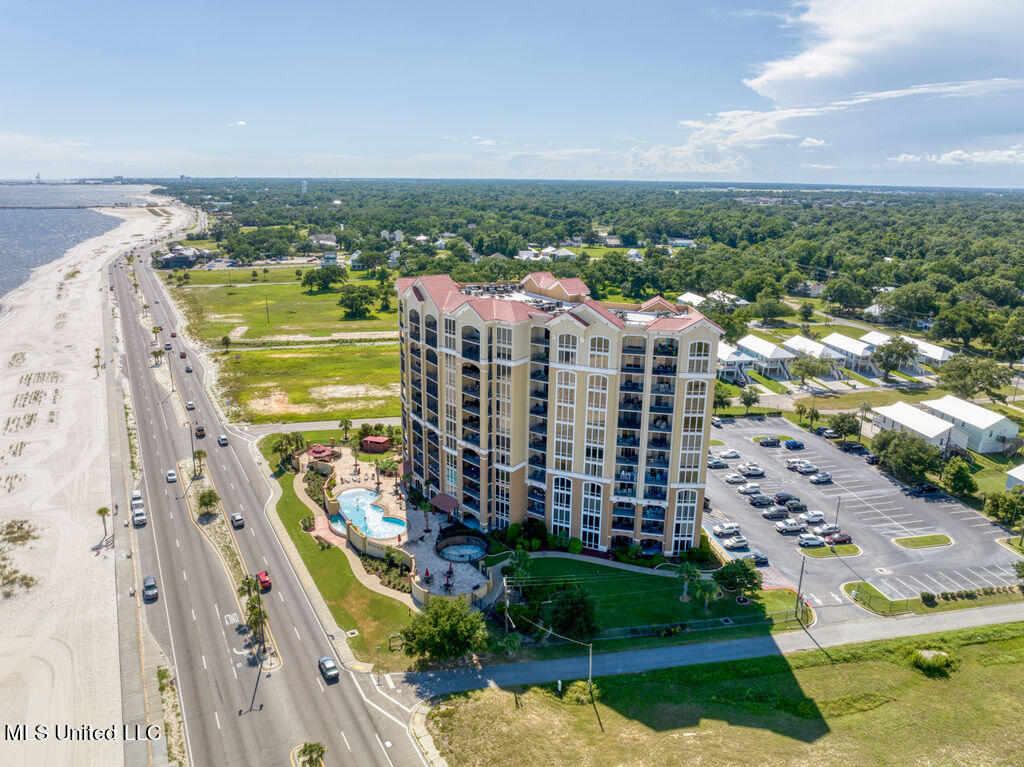
$349,500
2
bds
|
2
ba
|
0
sqft
|
built
2007
1200 Beach Dr, Gulfport, MS 39507
$-1,192
Cash flow
-17.8%
Cash-on-Cash Return
2.2%
Cap rate
0.8%
Rent to Value Ratio
Active
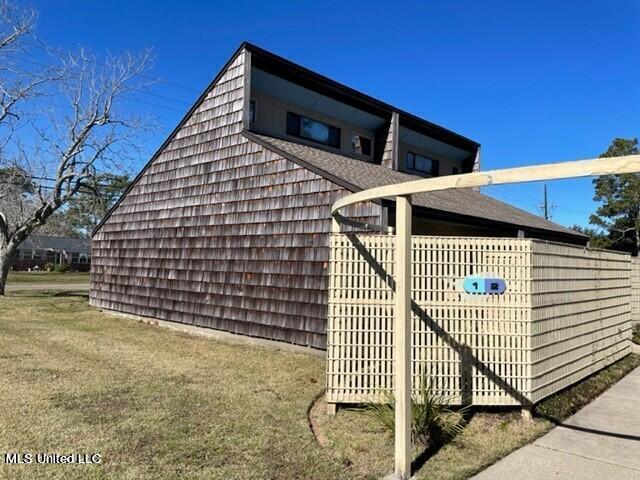
$113,000
1
bds
|
1
ba
|
0
sqft
|
built
1998
828 Oakleigh Ave, Gulfport, MS 39507
$-270
Cash flow
-12.5%
Cash-on-Cash Return
3.4%
Cap rate
0.9%
Rent to Value Ratio
Active
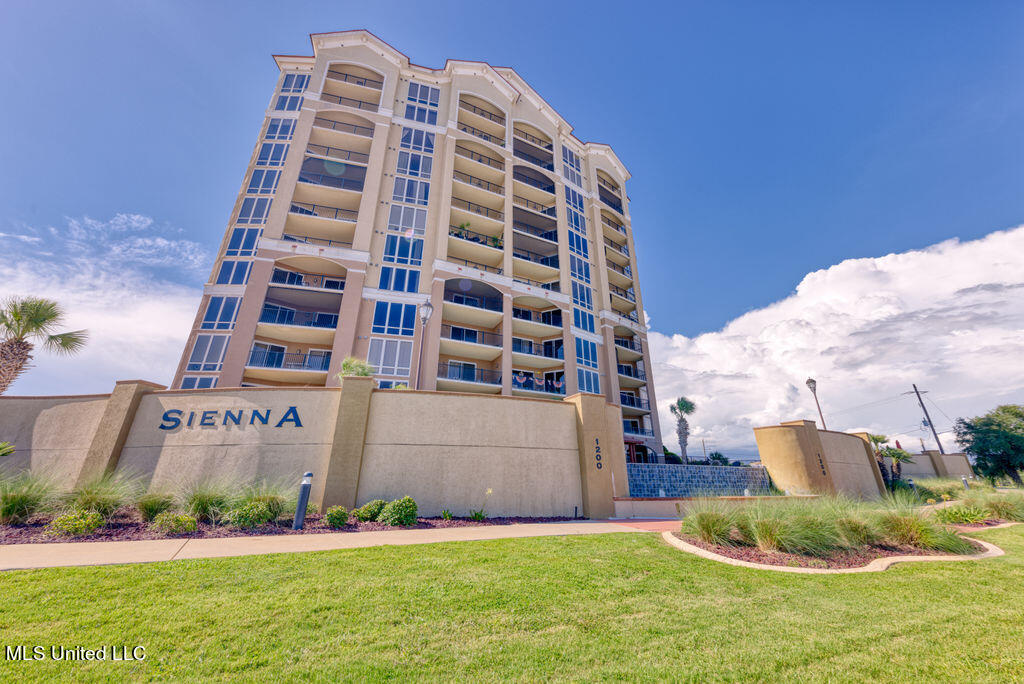
$299,900
2
bds
|
2
ba
|
0
sqft
|
built
2007
1200 Beach Dr, Gulfport, MS 39507
$-944
Cash flow
-16.4%
Cash-on-Cash Return
2.5%
Cap rate
0.9%
Rent to Value Ratio

Active
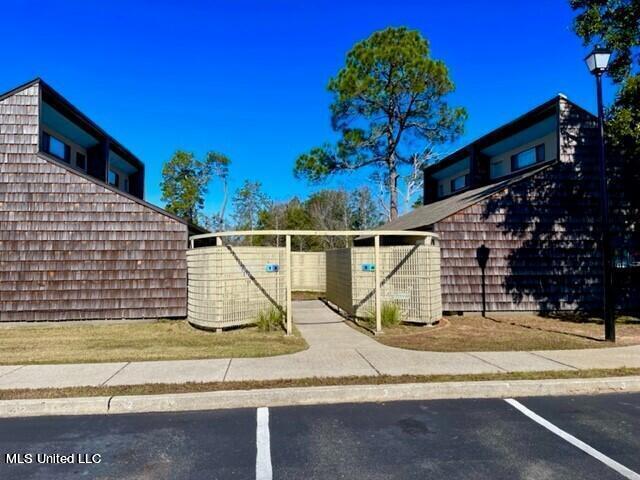
$113,000
1
bds
|
1
ba
|
0
sqft
|
built
1998
828 Oakleigh Ave, Gulfport, MS 39507
$-268
Cash flow
-12.4%
Cash-on-Cash Return
3.4%
Cap rate
0.9%
Rent to Value Ratio
Active
$113,000
1
bds
|
1
ba
|
0
sqft
|
built
1998
828 Oakleigh Ave, Gulfport, MS 39507
$-199
Cash flow
-9.2%
Cash-on-Cash Return
4.2%
Cap rate
1.0%
Rent to Value Ratio
Active
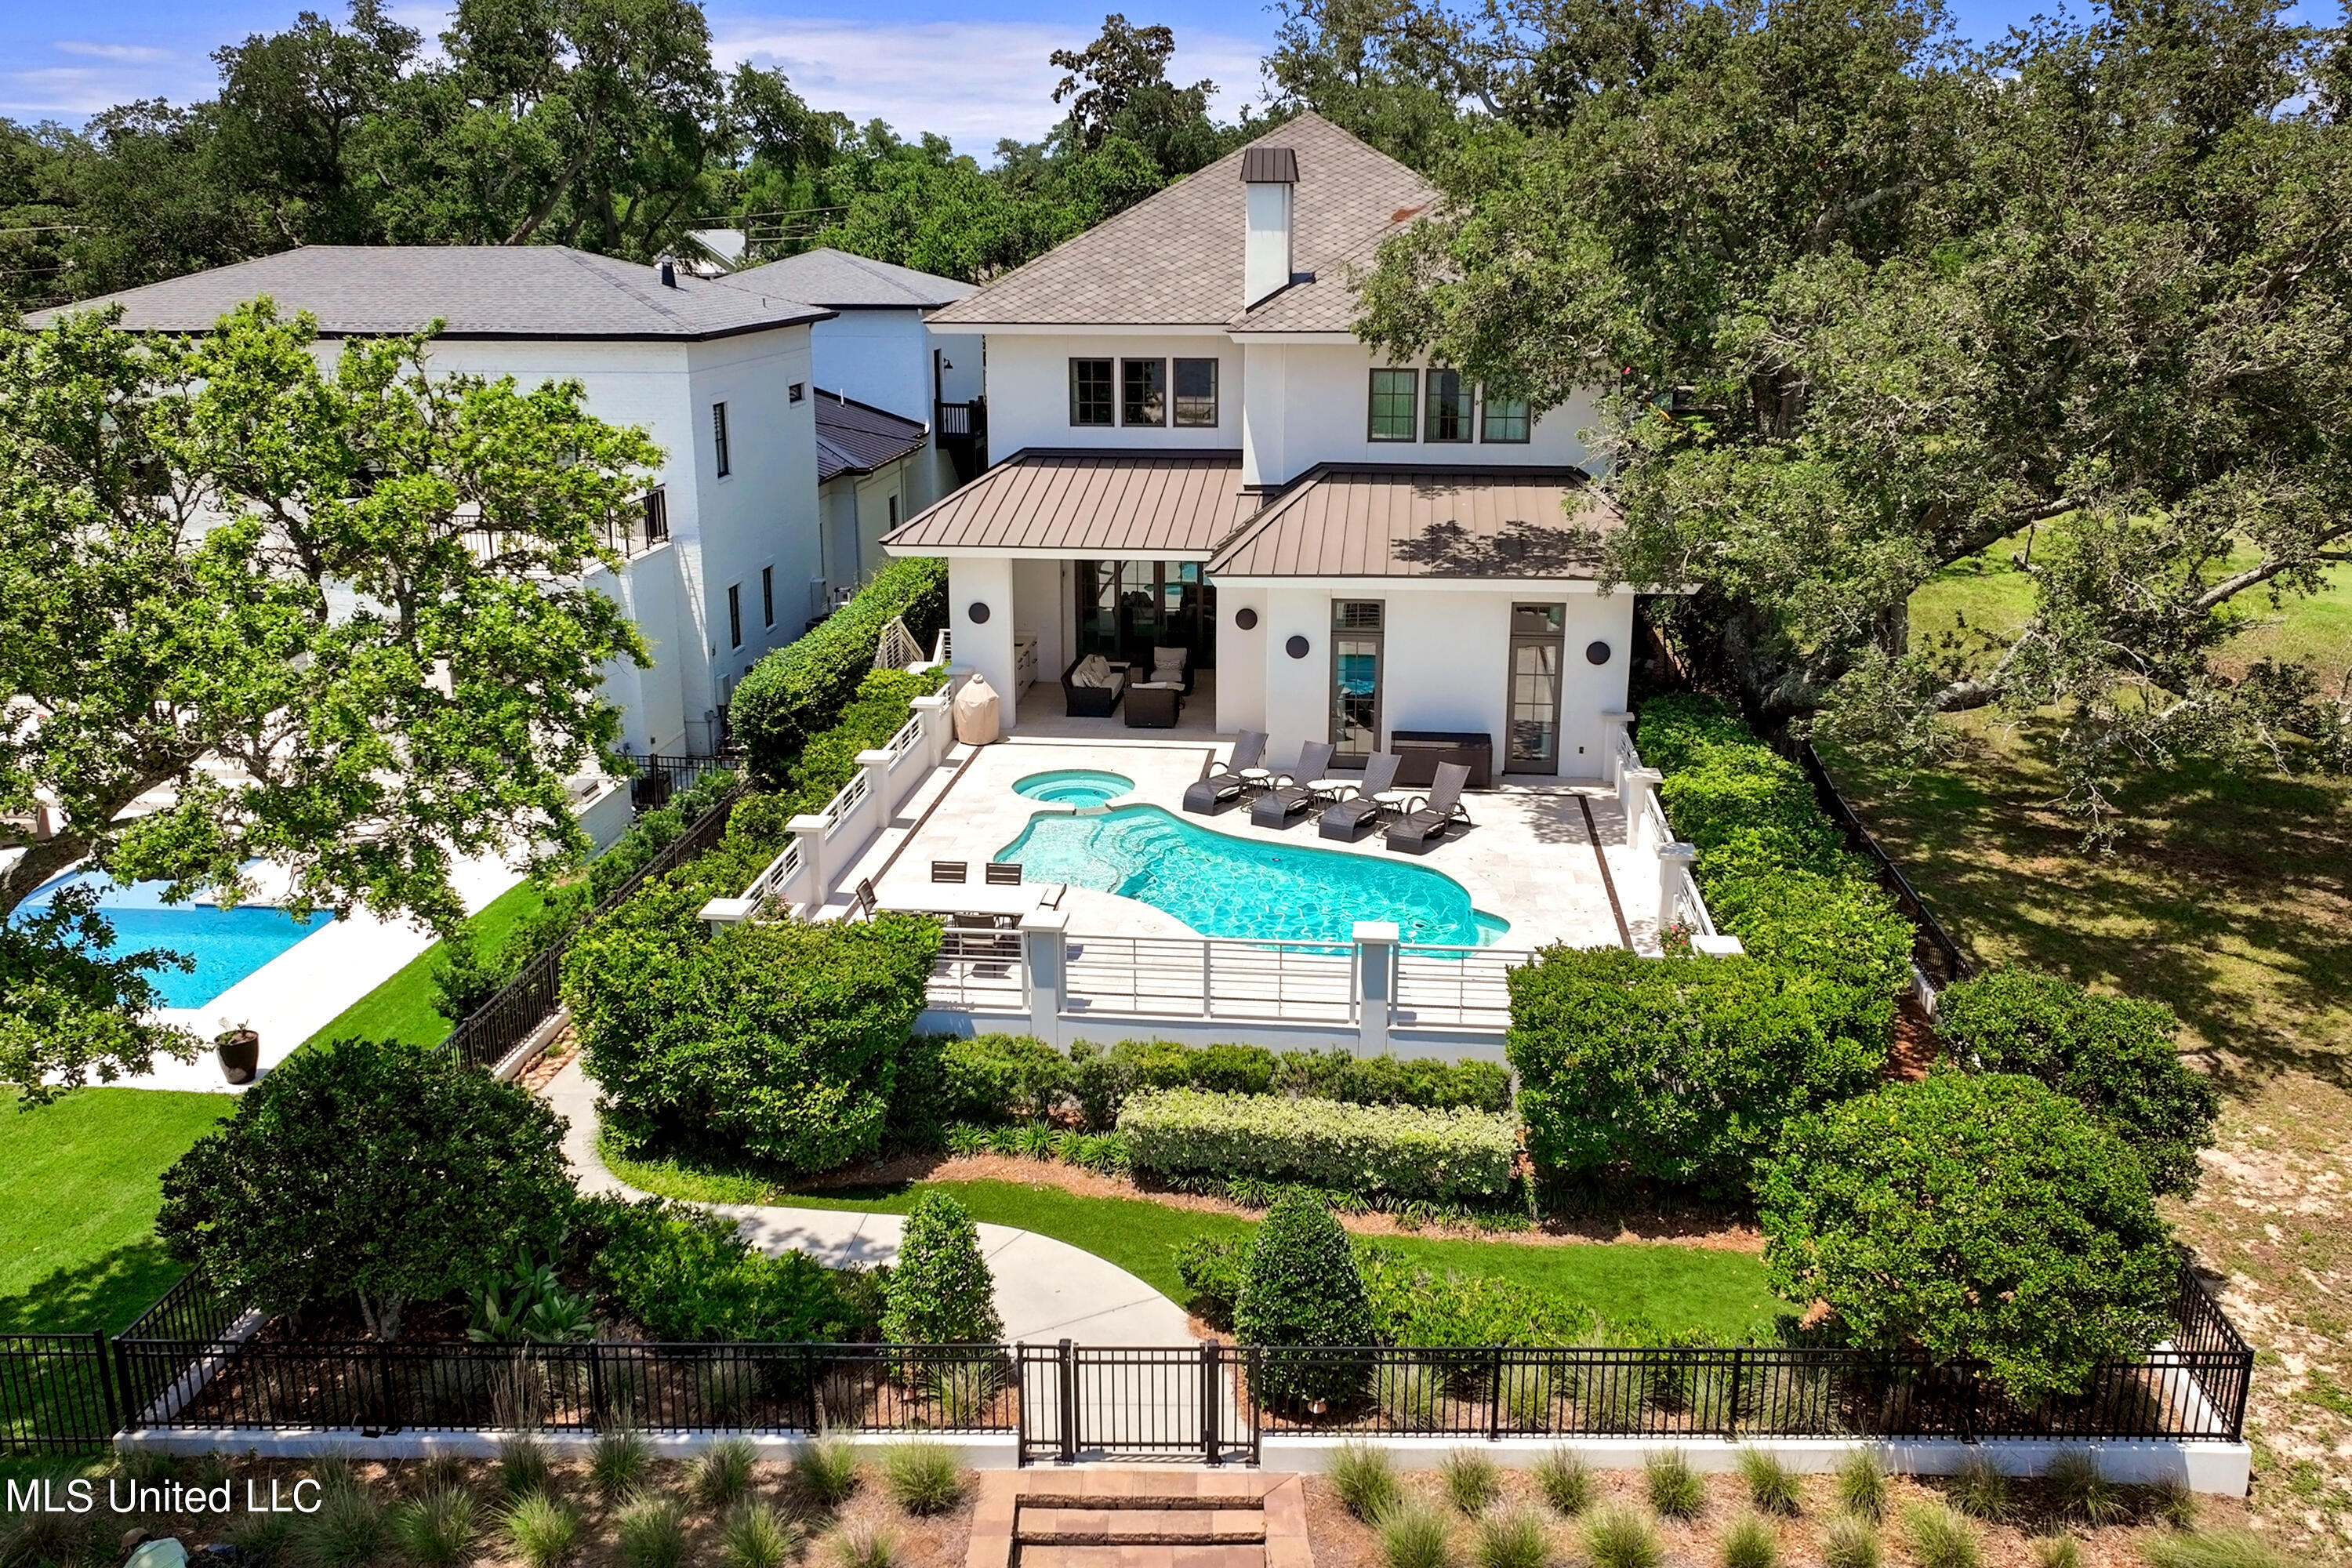
$1,525,000
5
bds
|
5
ba
|
0
sqft
|
built
1999
10745 Plantation Ln, Gulfport, MS 39503
$-5,417
Cash flow
-18.5%
Cash-on-Cash Return
2.0%
Cap rate
0.3%
Rent to Value Ratio