Houston, TX Investment Properties for Sale
Browse homes for sale and investment properties in Houston, TX. Refine your search by price, property type, or more.
Best cash flowing properties in Houston, TX

Active
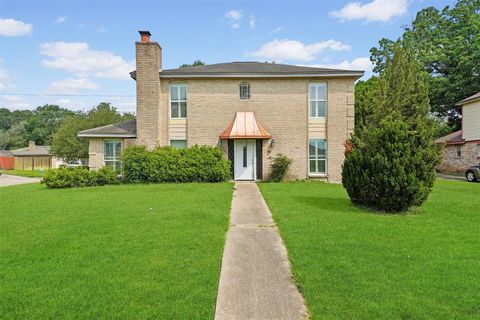
$135,000
2
bds
|
0
ba
|
1,002
sqft
|
built
1952
5622 Beldart St, Houston, TX 77033
$77
Cash flow
3.0%
Cash-on-Cash Return
7.0%
Cap rate
1.1%
Rent to Value Ratio
Active
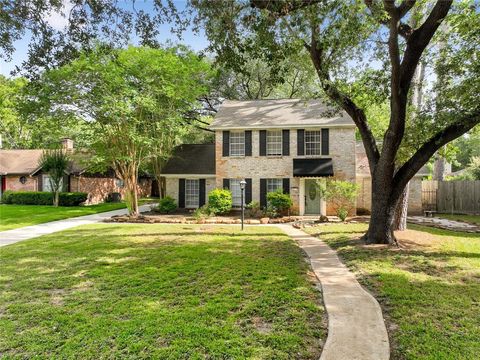
$190,000
4
bds
|
0
ba
|
1,563
sqft
|
built
1952
3915 Florinda St, Houston, TX 77021
$6
Cash flow
0.2%
Cash-on-Cash Return
6.3%
Cap rate
1.2%
Rent to Value Ratio
7,302 out of 7,684 properties for sale in Houston, TX
Limited Results Shown
Create a free account, or log in to reveal all property listings and enjoy the complete experience.
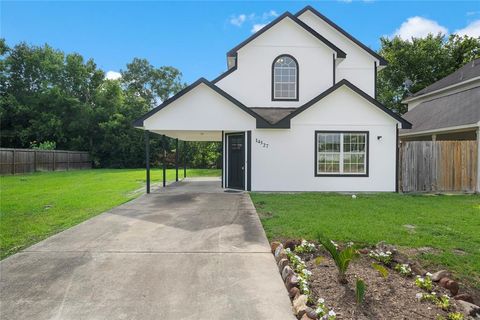
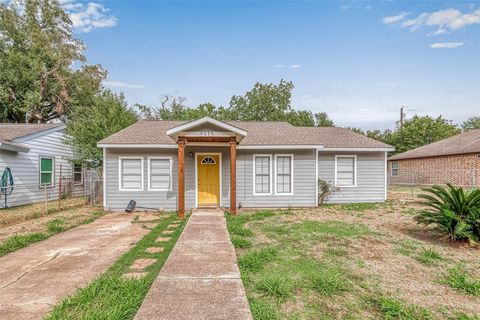
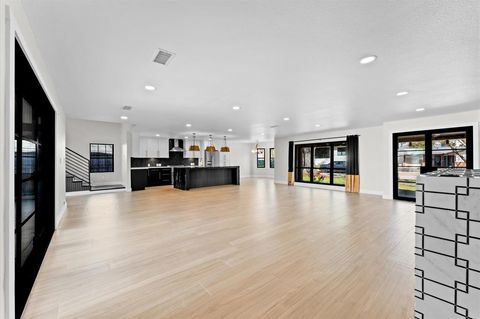
Active
$215,000
3
bds
|
0
ba
|
1,125
sqft
|
built
2004
14527 Polo St, Houston, TX 77085
$-230
Cash flow
-5.6%
Cash-on-Cash Return
5.0%
Cap rate
0.7%
Rent to Value Ratio
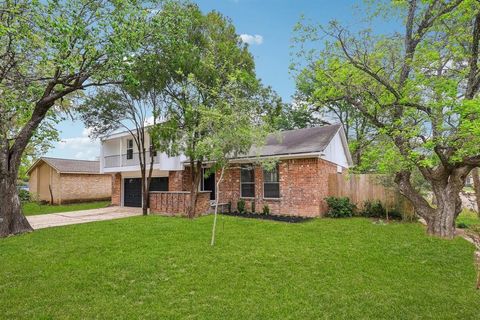
Active
$660,000
4
bds
|
0
ba
|
3,181
sqft
|
built
1960
4907 Wigton Dr, Houston, TX 77096
$-1,627
Cash flow
-12.9%
Cash-on-Cash Return
3.3%
Cap rate
0.7%
Rent to Value Ratio

Active
$450,000
3
bds
|
0
ba
|
1,710
sqft
|
built
1920
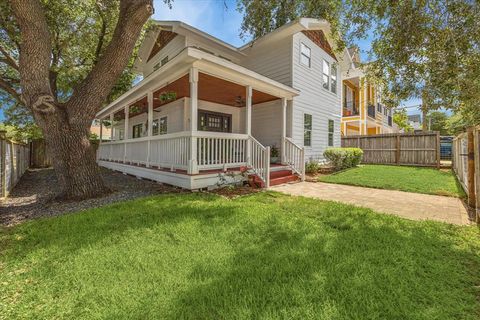
803 Vincent St, Houston, TX 77009
$-1,346
Cash flow
-15.6%
Cash-on-Cash Return
2.7%
Cap rate
0.6%
Rent to Value Ratio
Active
$289,900
3
bds
|
0
ba
|
2,186
sqft
|
built
1978
4031 Rushcroft Dr, Houston, TX 77082
$-610
Cash flow
-11.0%
Cash-on-Cash Return
3.7%
Cap rate
0.7%
Rent to Value Ratio
Active
$729,000
3
bds
|
0
ba
|
1,827
sqft
|
built
1930
529 Fugate St, Houston, TX 77009
$-2,475
Cash flow
-17.7%
Cash-on-Cash Return
2.2%
Cap rate
0.5%
Rent to Value Ratio
Active
$345,000
4
bds
|
0
ba
|
2,789
sqft
|
built
1973
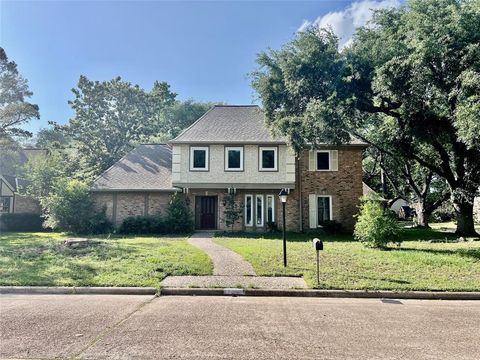
13719 Foxmoor Ln, Houston, TX 77069
$-676
Cash flow
-10.2%
Cash-on-Cash Return
3.9%
Cap rate
0.8%
Rent to Value Ratio
Active
$225,000
3
bds
|
0
ba
|
1,433
sqft
|
built
1950
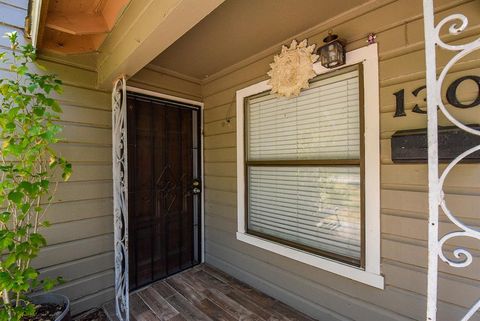
130 Ben Dr, Houston, TX 77022
$-198
Cash flow
-4.6%
Cash-on-Cash Return
5.2%
Cap rate
0.8%
Rent to Value Ratio
Active
$777,000
4
bds
|
0
ba
|
4,571
sqft
|
built
1973
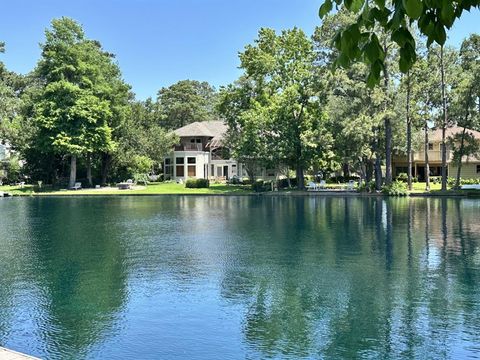
13106 Lookout Mountain Ct, Houston, TX 77069
$-2,944
Cash flow
-19.8%
Cash-on-Cash Return
1.7%
Cap rate
0.4%
Rent to Value Ratio
Active
$789,000
4
bds
|
0
ba
|
2,989
sqft
|
built
1955
9382 Livernois Rd, Houston, TX 77080
$-2,668
Cash flow
-17.6%
Cash-on-Cash Return
2.2%
Cap rate
0.4%
Rent to Value Ratio
Active
$460,000
3
bds
|
0
ba
|
3,312
sqft
|
built
2009
2415 Goodloe St, Houston, TX 77093
$-1,470
Cash flow
-16.7%
Cash-on-Cash Return
2.4%
Cap rate
0.5%
Rent to Value Ratio
Active
$305,000
4
bds
|
0
ba
|
2,757
sqft
|
built
2006
1802 Dominic Ln, Houston, TX 77049
$-550
Cash flow
-9.4%
Cash-on-Cash Return
4.1%
Cap rate
0.8%
Rent to Value Ratio
Active
$259,000
3
bds
|
0
ba
|
2,085
sqft
|
built
1983
15314 Cedar Ridge Dr, Houston, TX 77082
$-465
Cash flow
-9.4%
Cash-on-Cash Return
4.1%
Cap rate
0.8%
Rent to Value Ratio
Active
$325,000
5
bds
|
0
ba
|
2,740
sqft
|
built
1978
4522 Geneva Dr, Houston, TX 77066
$-468
Cash flow
-7.5%
Cash-on-Cash Return
4.5%
Cap rate
0.8%
Rent to Value Ratio
Active
$475,000
3
bds
|
0
ba
|
2,439
sqft
|
built
2012
4132 Bonner View Ln, Houston, TX 77007
$-472
Cash flow
-5.2%
Cash-on-Cash Return
5.1%
Cap rate
0.7%
Rent to Value Ratio
Active
$305,000
4
bds
|
0
ba
|
2,123
sqft
|
built
1973
8214 Camborne Ln, Houston, TX 77070
$-528
Cash flow
-9.0%
Cash-on-Cash Return
4.2%
Cap rate
0.8%
Rent to Value Ratio

Active
$475,000
3
bds
|
0
ba
|
2,225
sqft
|
built
2000
1605 Mc Donald St, Houston, TX 77007
$-1,168
Cash flow
-12.8%
Cash-on-Cash Return
3.3%
Cap rate
0.7%
Rent to Value Ratio
Active
$324,500
1
bds
|
0
ba
|
1,063
sqft
|
built
1998
204 Travis St, Houston, TX 77002
$-1,517
Cash flow
-24.4%
Cash-on-Cash Return
0.7%
Cap rate
0.8%
Rent to Value Ratio

Active
$849,999
4
bds
|
0
ba
|
2,959
sqft
|
built
2022
110 E 28th St, Houston, TX 77008
$-1,049
Cash flow
-6.4%
Cash-on-Cash Return
4.8%
Cap rate
0.7%
Rent to Value Ratio
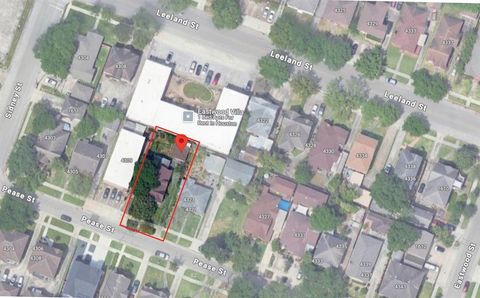
Active
$350,000
3
bds
|
0
ba
|
1,396
sqft
|
built
1935
4311 Pease St, Houston, TX 77023
$-447
Cash flow
-6.7%
Cash-on-Cash Return
4.7%
Cap rate
0.6%
Rent to Value Ratio

Active
$128,500
3
bds
|
0
ba
|
1,328
sqft
|
built
1940
1317 Moody St, Houston, TX 77009
$-23
Cash flow
-0.9%
Cash-on-Cash Return
6.1%
Cap rate
1.0%
Rent to Value Ratio

Active
$399,000
4
bds
|
0
ba
|
2,501
sqft
|
built
1979
12803 Suffolk Chase Ln, Houston, TX 77077
$-994
Cash flow
-13.0%
Cash-on-Cash Return
3.3%
Cap rate
0.6%
Rent to Value Ratio
Active
$344,000
3
bds
|
0
ba
|
1,947
sqft
|
built
1999
12418 Rutgers Park Ct, Houston, TX 77058
$-806
Cash flow
-12.2%
Cash-on-Cash Return
3.5%
Cap rate
0.7%
Rent to Value Ratio
Active
$205,275
3
bds
|
0
ba
|
1,212
sqft
|
built
1950
5026 Marietta Ln, Houston, TX 77021
$-189
Cash flow
-4.8%
Cash-on-Cash Return
5.2%
Cap rate
0.8%
Rent to Value Ratio
Active
$295,000
3
bds
|
0
ba
|
2,081
sqft
|
built
1991
18146 River Sage Dr, Houston, TX 77084
$-526
Cash flow
-9.3%
Cash-on-Cash Return
4.1%
Cap rate
0.7%
Rent to Value Ratio
Active
$425,000
4
bds
|
0
ba
|
2,989
sqft
|
built
2012
9131 Durango Point Ln, Houston, TX 77070
$-391
Cash flow
-4.8%
Cash-on-Cash Return
5.2%
Cap rate
0.7%
Rent to Value Ratio

Active
$695,000
3
bds
|
0
ba
|
3,754
sqft
|
built
2003
2727 Stuart Mnr, Houston, TX 77082
$-2,276
Cash flow
-17.1%
Cash-on-Cash Return
2.3%
Cap rate
0.6%
Rent to Value Ratio
Active
$339,000
3
bds
|
0
ba
|
1,688
sqft
|
built
1989
5814 N Magazine Cir, Houston, TX 77084
$-890
Cash flow
-13.7%
Cash-on-Cash Return
3.1%
Cap rate
0.6%
Rent to Value Ratio
Active
$340,000
4
bds
|
0
ba
|
3,134
sqft
|
built
1968
1014 Doral Ln, Houston, TX 77073
$-543
Cash flow
-8.3%
Cash-on-Cash Return
4.3%
Cap rate
0.8%
Rent to Value Ratio

Active
$720,000
5
bds
|
0
ba
|
2,721
sqft
|
built
1973
2906 Riata Ln, Houston, TX 77043
$-2,373
Cash flow
-17.2%
Cash-on-Cash Return
2.3%
Cap rate
0.5%
Rent to Value Ratio

Active
$309,000
3
bds
|
0
ba
|
2,114
sqft
|
built
1993
6206 Summerville Ln, Houston, TX 77041
$-507
Cash flow
-8.6%
Cash-on-Cash Return
4.3%
Cap rate
0.7%
Rent to Value Ratio

Active
$160,000
4
bds
|
0
ba
|
1,311
sqft
|
built
1995
4619 Croker Ridge Rd, Houston, TX 77053
$-70
Cash flow
-2.3%
Cash-on-Cash Return
5.7%
Cap rate
1.0%
Rent to Value Ratio
Active
$2,295,000
6
bds
|
0
ba
|
7,012
sqft
|
built
2013
6206 Terwilliger Way, Houston, TX 77057
$-9,780
Cash flow
-22.2%
Cash-on-Cash Return
1.2%
Cap rate
0.4%
Rent to Value Ratio
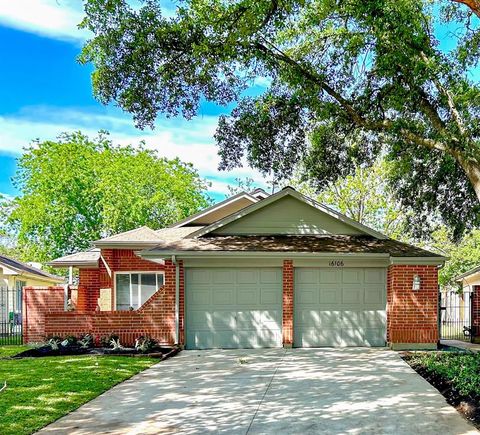
Active
$245,000
3
bds
|
0
ba
|
1,209
sqft
|
built
1983
16106 Golden Sands Dr, Houston, TX 77095
$-431
Cash flow
-9.2%
Cash-on-Cash Return
4.2%
Cap rate
0.7%
Rent to Value Ratio
Active
$345,000
4
bds
|
0
ba
|
3,001
sqft
|
built
1986
7202 Las Brisas Dr, Houston, TX 77083
$-351
Cash flow
-5.3%
Cash-on-Cash Return
5.0%
Cap rate
0.8%
Rent to Value Ratio
Active
$200,000
4
bds
|
0
ba
|
1,404
sqft
|
built
2000
13710 Brownsville St, Houston, TX 77015
$-466
Cash flow
-12.2%
Cash-on-Cash Return
3.5%
Cap rate
0.7%
Rent to Value Ratio
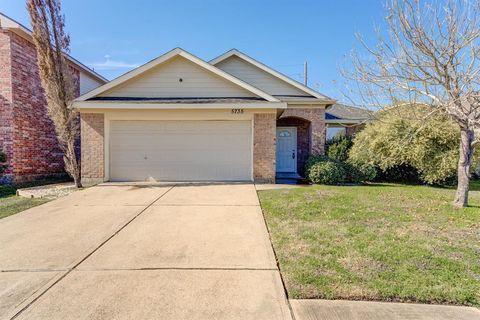
Active
$315,000
4
bds
|
0
ba
|
2,293
sqft
|
built
2004
5735 Brookhollow Pine Trl, Houston, TX 77084
$-1,021
Cash flow
-16.9%
Cash-on-Cash Return
2.4%
Cap rate
0.6%
Rent to Value Ratio
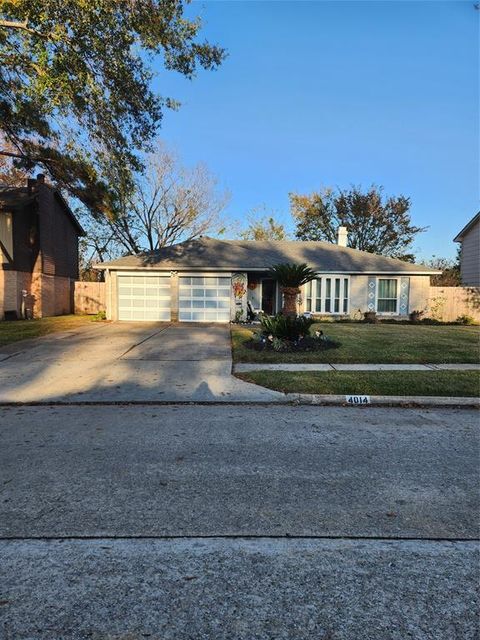
Active
$252,000
4
bds
|
0
ba
|
2,800
sqft
|
built
1978
4014 Windrift Dr, Houston, TX 77066
$-400
Cash flow
-8.3%
Cash-on-Cash Return
4.4%
Cap rate
0.7%
Rent to Value Ratio
Active
$245,000
3
bds
|
0
ba
|
1,296
sqft
|
built
1984
16703 Sentinel Dr, Houston, TX 77053
$-523
Cash flow
-11.1%
Cash-on-Cash Return
3.7%
Cap rate
0.7%
Rent to Value Ratio