Cook County Investment Properties for Sale
Browse homes for sale and investment properties in Cook County. Refine your search by price, property type, or more.
Best cash flowing properties in Cook County
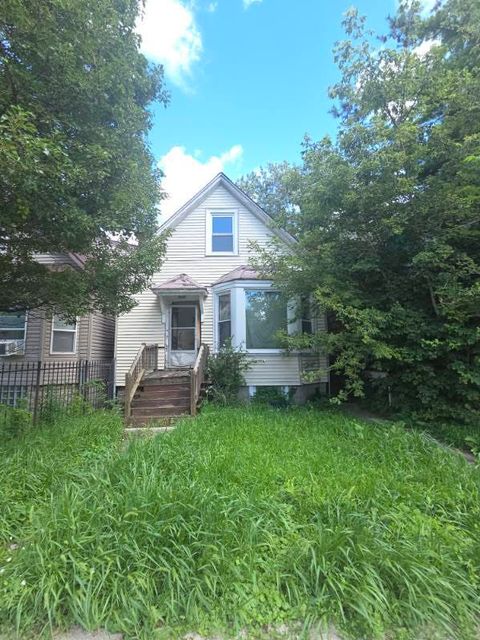
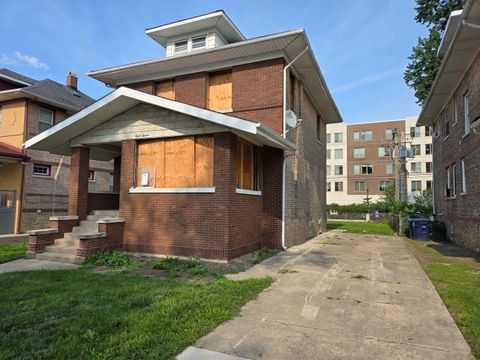
Active
$64,900
3
bds
|
3
ba
|
1,219
sqft
|
built
1886
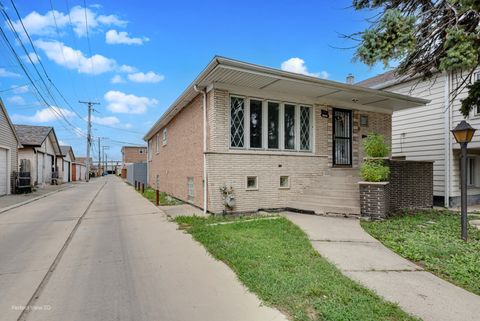
6619 S Aberdeen St, Chicago, IL 60621
$1,380
Cash flow
24.8%
Cash-on-Cash Return
25.5%
Cap rate
3.1%
Rent to Value Ratio
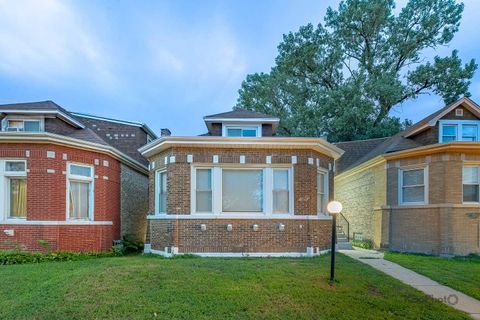
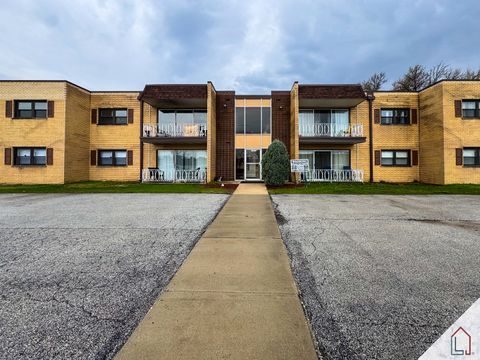
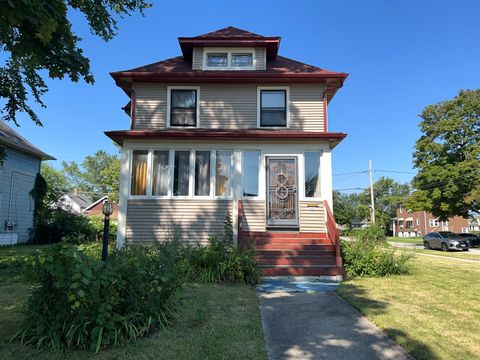
Active
$227,500
4
bds
|
1
ba
|
0
sqft
|
built
1930
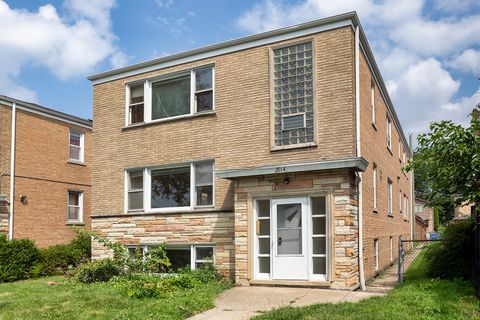
8105 S Princeton Ave, Chicago, IL 60620
$171
Cash flow
3.9%
Cash-on-Cash Return
6.6%
Cap rate
0.9%
Rent to Value Ratio
4,861 out of 5,645 properties for sale in Cook County
Limited Results Shown
Create a free account, or log in to reveal all property listings and enjoy the complete experience.
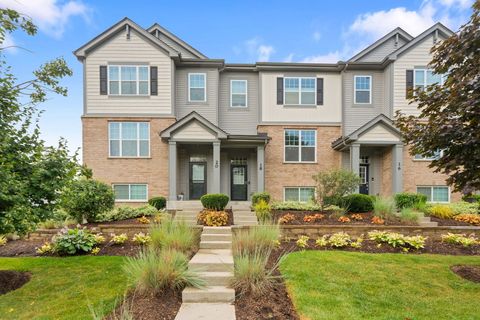
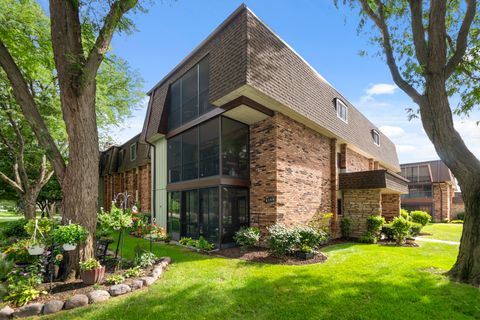
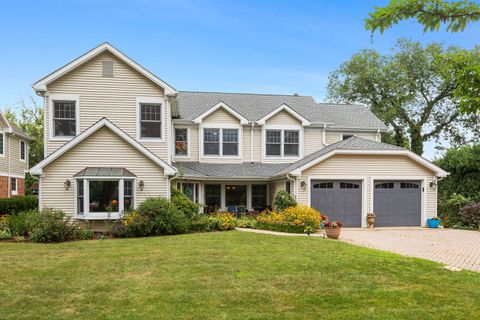
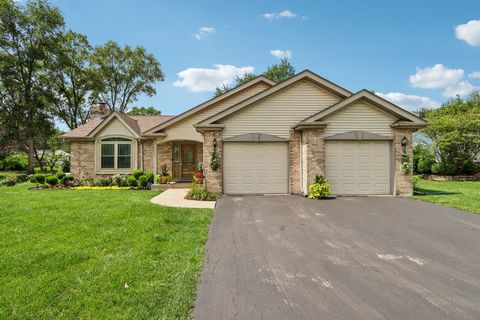
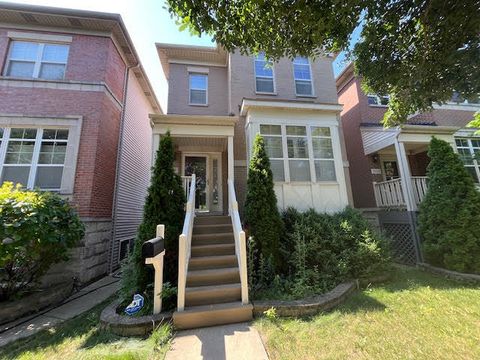
Active
$480,000
2
bds
|
3
ba
|
1,813
sqft
|
built
2018
18 E Heritage Ct, Arlington Heights, IL 60004
$-1,278
Cash flow
-13.9%
Cash-on-Cash Return
2.5%
Cap rate
0.7%
Rent to Value Ratio
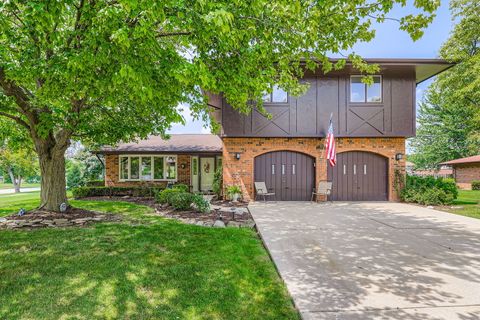
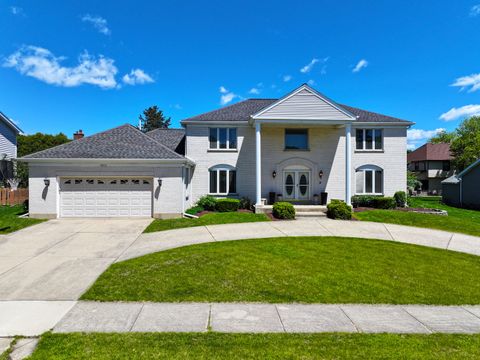
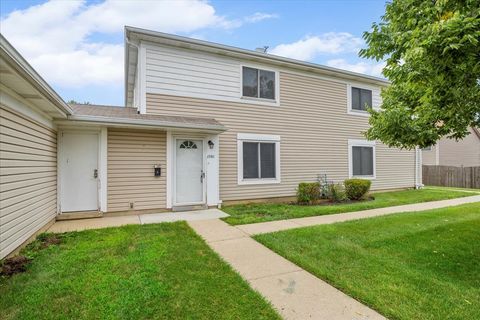
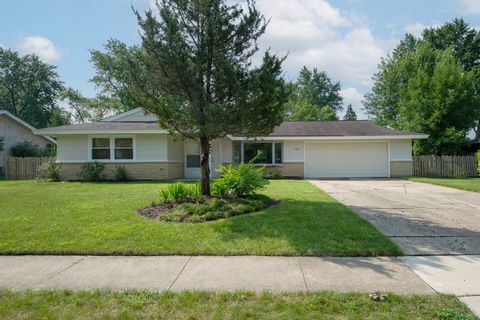
Active
$489,900
4
bds
|
3
ba
|
2,300
sqft
|
built
1978
136 Caryville Ln, Schaumburg, IL 60193
$-759
Cash flow
-8.1%
Cash-on-Cash Return
3.8%
Cap rate
0.7%
Rent to Value Ratio
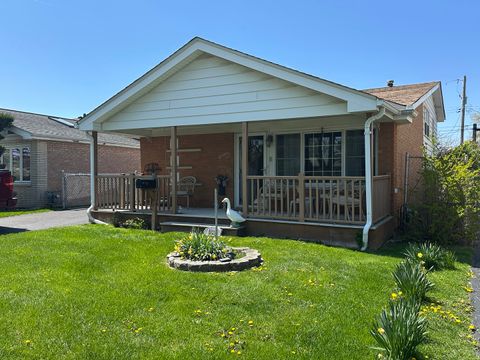
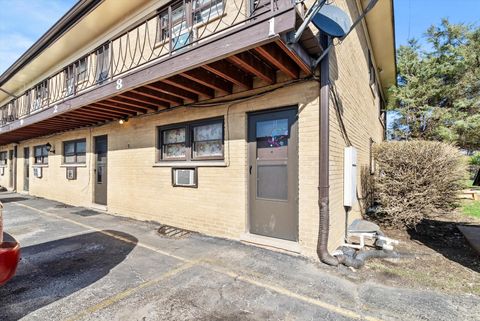
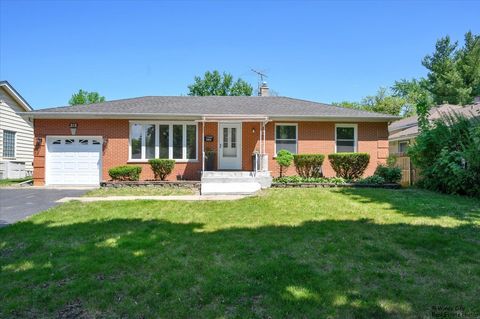
Active
$334,900
4
bds
|
2
ba
|
0
sqft
|
built
1963
1366 Algonquin Dr, Elgin, IL 60120
$-194
Cash flow
-3.0%
Cash-on-Cash Return
5.0%
Cap rate
0.8%
Rent to Value Ratio
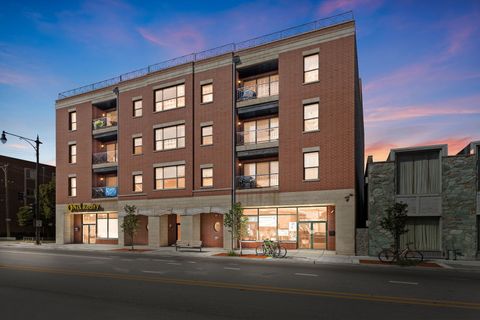
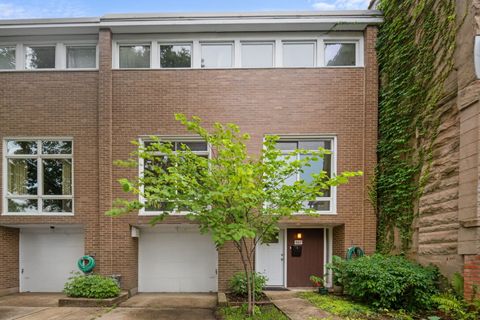
Active
$599,900
4
bds
|
4
ba
|
1,823
sqft
|
built
1967
8313 W Ballard Rd, Niles, IL 60714
$-1,104
Cash flow
-9.6%
Cash-on-Cash Return
3.5%
Cap rate
0.6%
Rent to Value Ratio
Active
$249,900
3
bds
|
1
ba
|
1,100
sqft
|
built
1978
178 Stephanie Ct, Bartlett, IL 60103
$-472
Cash flow
-9.9%
Cash-on-Cash Return
3.4%
Cap rate
0.7%
Rent to Value Ratio
Active
$306,000
4
bds
|
2
ba
|
1,000
sqft
|
built
1966
11604 S Kenneth Ave, Alsip, IL 60803
$-485
Cash flow
-8.3%
Cash-on-Cash Return
3.8%
Cap rate
0.7%
Rent to Value Ratio
Active
$270,000
3
bds
|
2
ba
|
1,600
sqft
|
built
1979
9198 South Rd, Palos Hills, IL 60465
$-164
Cash flow
-3.2%
Cash-on-Cash Return
5.0%
Cap rate
0.9%
Rent to Value Ratio
Active
$132,900
2
bds
|
2
ba
|
1,000
sqft
|
built
1969
18320 Cherry Creek Dr, Homewood, IL 60430
$0
Cash flow
0.0%
Cash-on-Cash Return
5.7%
Cap rate
1.5%
Rent to Value Ratio
Active
$460,000
5
bds
|
3
ba
|
0
sqft
|
built
1918
5527 W Potomac Ave, Chicago, IL 60651
$-1,202
Cash flow
-13.6%
Cash-on-Cash Return
2.5%
Cap rate
0.4%
Rent to Value Ratio
Active
$210,000
4
bds
|
3
ba
|
2,400
sqft
|
built
1911
815 S 6th Ave, Maywood, IL 60153
$109
Cash flow
2.7%
Cash-on-Cash Return
6.3%
Cap rate
1.4%
Rent to Value Ratio
Active
$1,050,000
5
bds
|
4
ba
|
3,458
sqft
|
built
1950
2114 Prairie St, Glenview, IL 60025
$-2,603
Cash flow
-12.9%
Cash-on-Cash Return
2.7%
Cap rate
0.6%
Rent to Value Ratio
Active
$899,000
4
bds
|
4
ba
|
4,900
sqft
|
built
1987
5804 N Corona Dr, Rolling Meadows, IL 60067
$-2,593
Cash flow
-15.0%
Cash-on-Cash Return
2.2%
Cap rate
0.5%
Rent to Value Ratio
Active
$289,900
3
bds
|
2
ba
|
1,055
sqft
|
built
1963
11024 Mason Ave, Chicago Ridge, IL 60415
$-323
Cash flow
-5.8%
Cash-on-Cash Return
4.3%
Cap rate
0.9%
Rent to Value Ratio
Active
$399,000
2
bds
|
2
ba
|
0
sqft
|
built
2007
5300 N Lincoln Ave, Chicago, IL 60625
$-964
Cash flow
-12.6%
Cash-on-Cash Return
2.8%
Cap rate
0.7%
Rent to Value Ratio
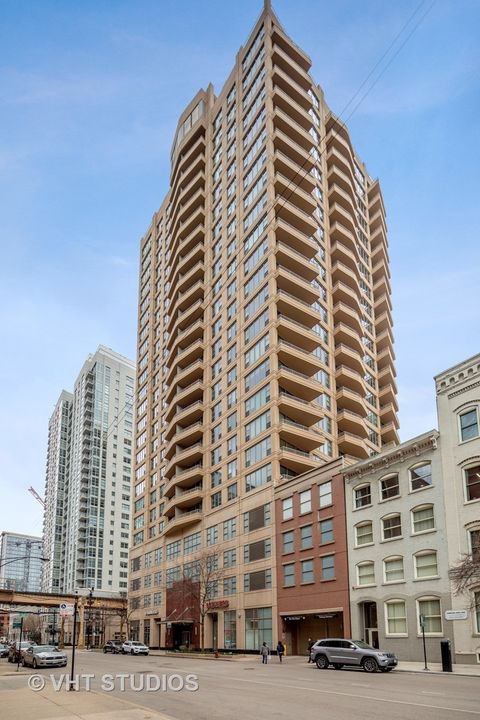
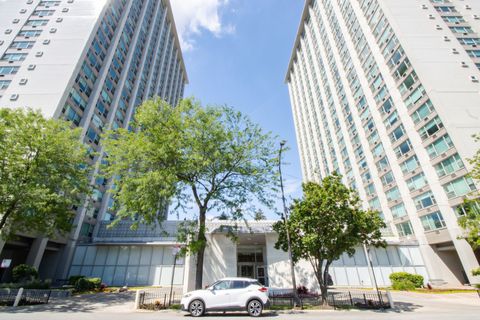
Active
$249,000
1
bds
|
1
ba
|
800
sqft
|
built
1967
1255 N Sandburg Ter, Chicago, IL 60610
$-561
Cash flow
-11.8%
Cash-on-Cash Return
3.0%
Cap rate
0.9%
Rent to Value Ratio
Active
$399,900
3
bds
|
2
ba
|
1,104
sqft
|
built
1962
5444 S Kenneth Ave, Chicago, IL 60632
$-728
Cash flow
-9.5%
Cash-on-Cash Return
3.5%
Cap rate
0.6%
Rent to Value Ratio
Active
$649,000
6
bds
|
4
ba
|
0
sqft
|
built
1965
2914 W Touhy Ave, Chicago, IL 60645
$-2,278
Cash flow
-18.3%
Cash-on-Cash Return
1.5%
Cap rate
0.4%
Rent to Value Ratio
Active
$475,000
2
bds
|
2
ba
|
1,275
sqft
|
built
2004
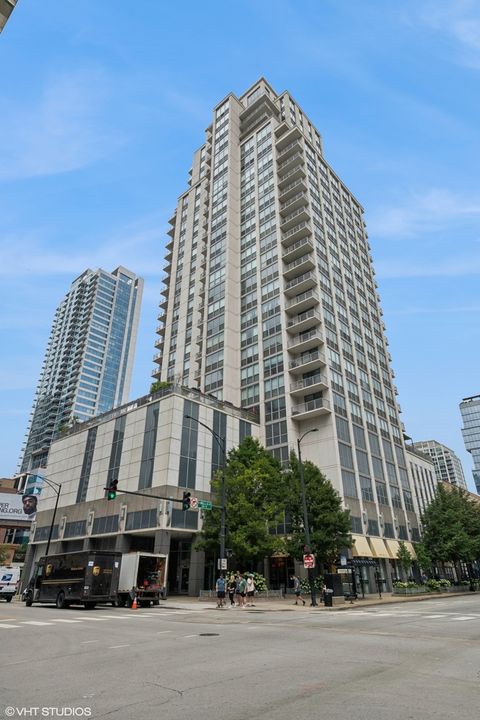
200 W Grand Ave, Chicago, IL 60654
$-1,017
Cash flow
-11.2%
Cash-on-Cash Return
3.1%
Cap rate
0.8%
Rent to Value Ratio
Active
$215,000
2
bds
|
1
ba
|
0
sqft
|
built
1924
1908 W Chase Ave, Chicago, IL 60626
$-488
Cash flow
-11.8%
Cash-on-Cash Return
3.0%
Cap rate
0.8%
Rent to Value Ratio
Active
$400,000
4
bds
|
2
ba
|
1,332
sqft
|
built
1956
5000 N Mobile Ave, Chicago, IL 60630
$163
Cash flow
2.1%
Cash-on-Cash Return
6.2%
Cap rate
0.8%
Rent to Value Ratio
Active
$210,000
2
bds
|
1
ba
|
1,100
sqft
|
built
1951
2434 W Farragut Ave, Chicago, IL 60625
$-389
Cash flow
-9.7%
Cash-on-Cash Return
3.5%
Cap rate
0.9%
Rent to Value Ratio
Active
$310,000
2
bds
|
2
ba
|
1,600
sqft
|
built
1925
5501 N Nashville Ave, Chicago, IL 60656
$-18
Cash flow
-0.3%
Cash-on-Cash Return
5.6%
Cap rate
0.8%
Rent to Value Ratio
Active
$389,000
1
bds
|
1
ba
|
832
sqft
|
built
2008
200 N Jefferson St, Chicago, IL 60661
$-1,007
Cash flow
-13.5%
Cash-on-Cash Return
2.6%
Cap rate
0.7%
Rent to Value Ratio
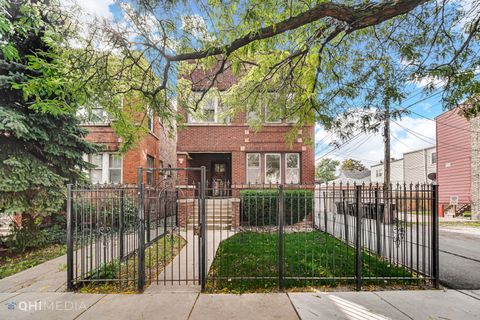
Active
$399,000
5
bds
|
3
ba
|
0
sqft
|
built
1908
2053 N Lorel Ave, Chicago, IL 60639
$-722
Cash flow
-9.4%
Cash-on-Cash Return
3.5%
Cap rate
0.6%
Rent to Value Ratio
Active
$399,900
2
bds
|
2
ba
|
0
sqft
|
built
1926
509 W Aldine Ave, Chicago, IL 60657
$-800
Cash flow
-10.4%
Cash-on-Cash Return
3.3%
Cap rate
0.8%
Rent to Value Ratio
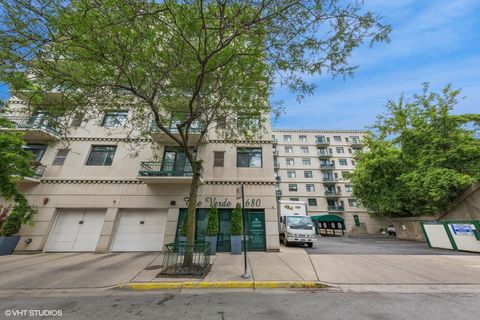
Active
$449,900
2
bds
|
2
ba
|
1,343
sqft
|
built
1999
680 N Green St, Chicago, IL 60642
$-889
Cash flow
-10.3%
Cash-on-Cash Return
3.3%
Cap rate
0.8%
Rent to Value Ratio
Active
$335,000
3
bds
|
2
ba
|
1,705
sqft
|
built
1992
22646 Lawndale Ave, Richton Park, IL 60471
$-465
Cash flow
-7.2%
Cash-on-Cash Return
4.0%
Cap rate
0.7%
Rent to Value Ratio
Active
$235,000
3
bds
|
2
ba
|
1,456
sqft
|
built
1907
400 S 7th Ave, Maywood, IL 60153
$44
Cash flow
1.0%
Cash-on-Cash Return
5.9%
Cap rate
1.2%
Rent to Value Ratio
Active
$239,900
2
bds
|
1
ba
|
950
sqft
|
built
1978
1581 Cornell Pl, Hoffman Estates, IL 60169
$-528
Cash flow
-11.5%
Cash-on-Cash Return
3.0%
Cap rate
0.8%
Rent to Value Ratio
Active
$169,900
2
bds
|
2
ba
|
0
sqft
|
built
1968
41 King Arthur Ct, Northlake, IL 60164
$-35
Cash flow
-1.1%
Cash-on-Cash Return
5.4%
Cap rate
1.1%
Rent to Value Ratio
Active
$639,900
3
bds
|
4
ba
|
2,082
sqft
|
built
2005
2537 W Grenshaw St, Chicago, IL 60612
$-945
Cash flow
-7.7%
Cash-on-Cash Return
3.9%
Cap rate
0.7%
Rent to Value Ratio
Active
$475,000
3
bds
|
3
ba
|
1,499
sqft
|
built
1948
215 S Forest Ave, Palatine, IL 60074
$-545
Cash flow
-6.0%
Cash-on-Cash Return
4.3%
Cap rate
0.5%
Rent to Value Ratio
Active
$410,000
3
bds
|
2
ba
|
1,345
sqft
|
built
1969
1313 Hartmann Dr, Schaumburg, IL 60193
$-102
Cash flow
-1.3%
Cash-on-Cash Return
5.4%
Cap rate
0.7%
Rent to Value Ratio
Active
$795,000
4
bds
|
3
ba
|
2,568
sqft
|
built
1967
5517 S Dorchester Ave, Chicago, IL 60637
$-2,314
Cash flow
-15.2%
Cash-on-Cash Return
2.2%
Cap rate
0.5%
Rent to Value Ratio
Active
$464,900
4
bds
|
3
ba
|
2,600
sqft
|
built
1928
5353 W Fletcher St, Chicago, IL 60641
$-673
Cash flow
-7.6%
Cash-on-Cash Return
3.9%
Cap rate
0.6%
Rent to Value Ratio
Active
$174,900
1
bds
|
2
ba
|
920
sqft
|
built
1960
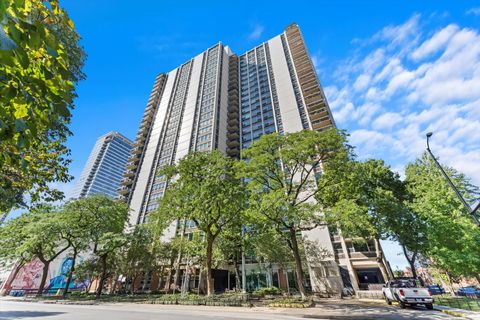
3600 N Lake Shore Dr, Chicago, IL 60613
$-169
Cash flow
-5.0%
Cash-on-Cash Return
4.5%
Cap rate
1.4%
Rent to Value Ratio
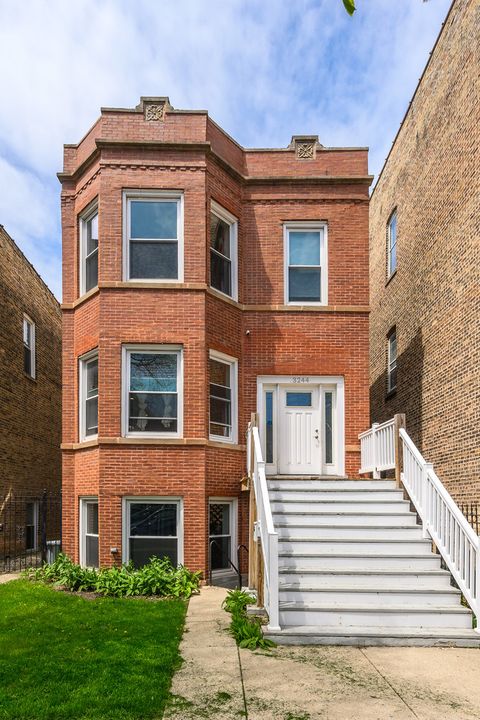
Active
$799,999
9
bds
|
3
ba
|
0
sqft
|
built
1908
3244 N Hamlin Ave, Chicago, IL 60618
$-2,923
Cash flow
-19.1%
Cash-on-Cash Return
1.3%
Cap rate
0.3%
Rent to Value Ratio
Active
$249,800
1
bds
|
1
ba
|
0
sqft
|
built
1930
1528 S Wabash Ave, Chicago, IL 60605
$-696
Cash flow
-14.5%
Cash-on-Cash Return
2.3%
Cap rate
0.8%
Rent to Value Ratio