Bristol County Investment Properties for Sale
Browse homes for sale and investment properties in Bristol County. Refine your search by price, property type, or more.
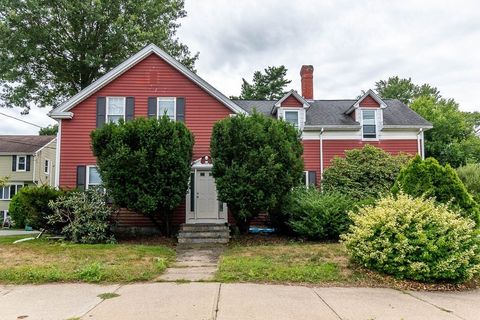
Best cash flowing properties in Bristol County
Active
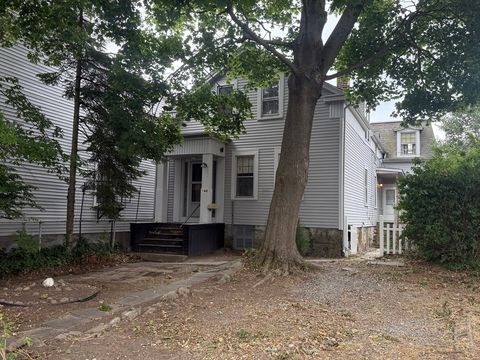
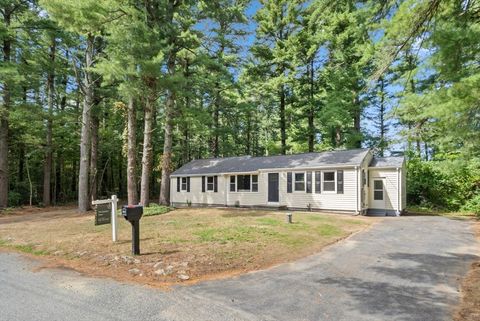
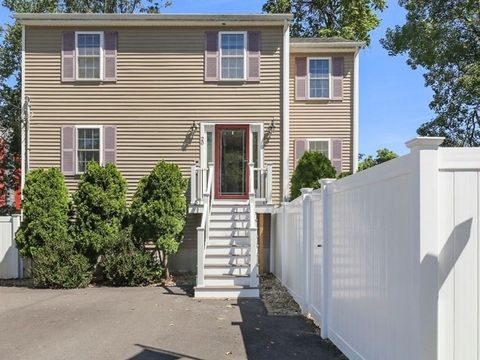
$325,000
4
bds
|
2
ba
|
2,058
sqft
|
built
1855
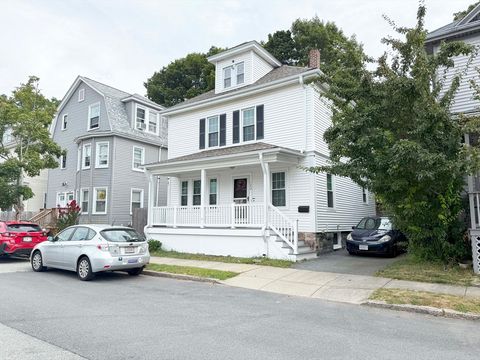
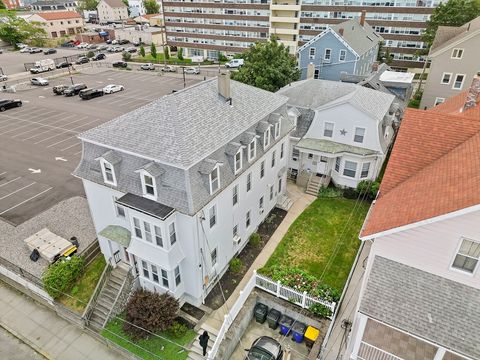
162 Elm St, New Bedford, MA 02740
$308
Cash flow
4.9%
Cash-on-Cash Return
6.8%
Cap rate
1.0%
Rent to Value Ratio
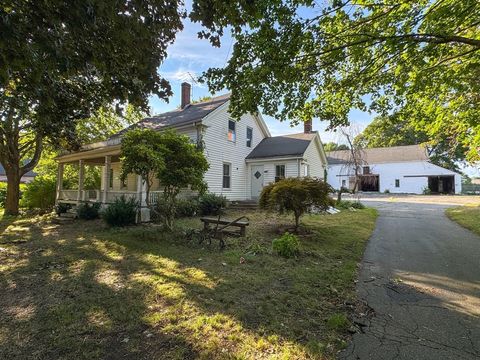
Active
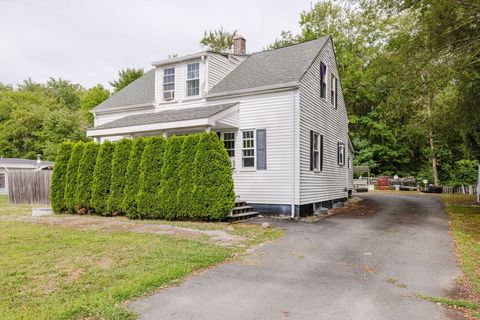
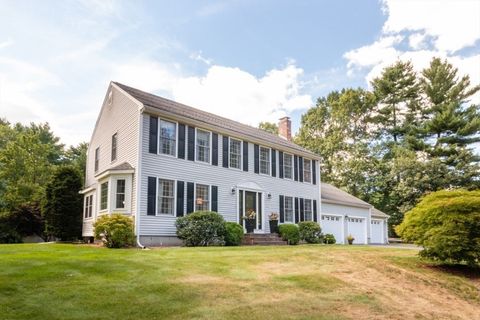
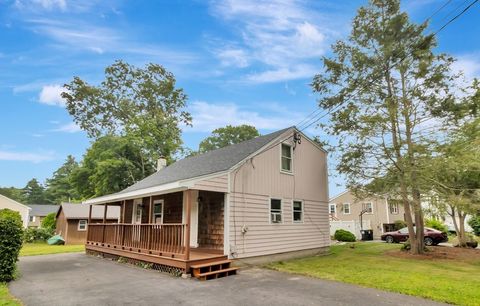
$390,000
3
bds
|
2
ba
|
1,224
sqft
|
built
1925
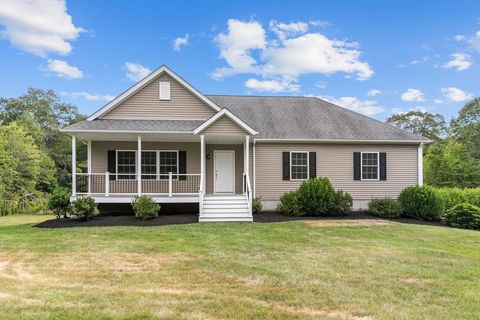
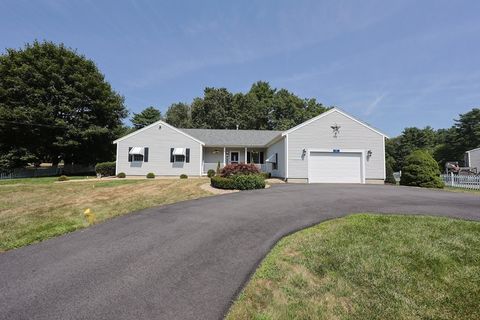
246 Winthrop St, Rehoboth, MA 02769
$295
Cash flow
3.9%
Cash-on-Cash Return
6.6%
Cap rate
0.9%
Rent to Value Ratio
357 out of 539 properties for sale in Bristol County
Limited Results Shown
Create a free account, or log in to reveal all property listings and enjoy the complete experience.
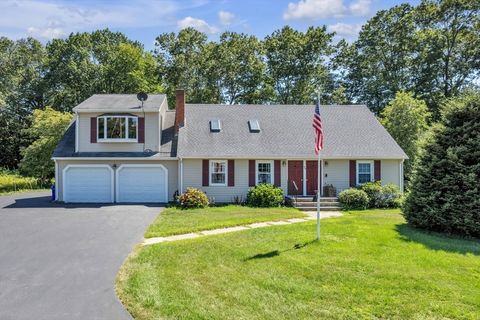
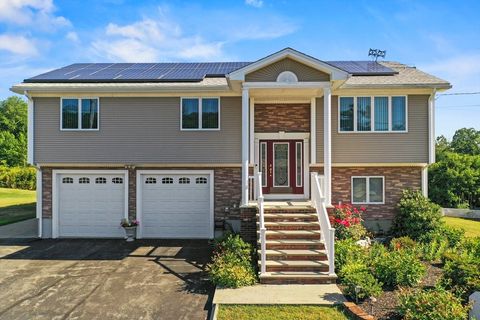
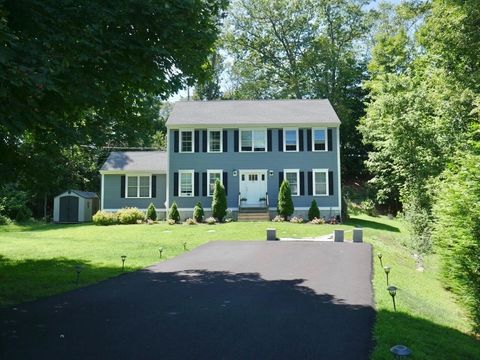
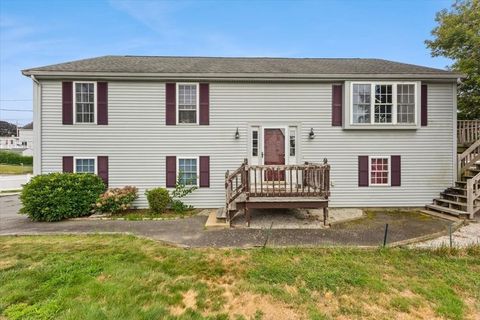
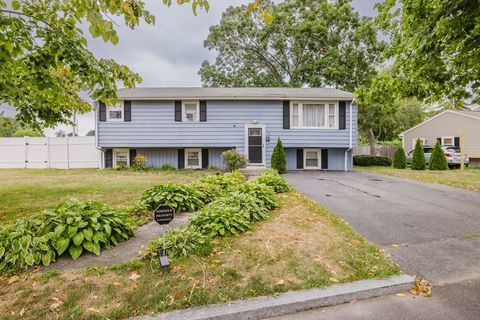
Active
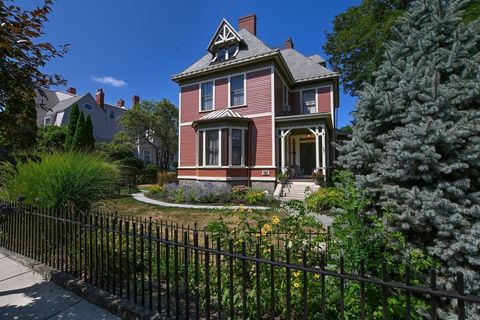
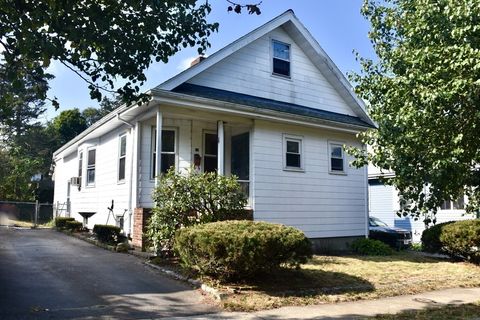
$549,900
3
bds
|
2
ba
|
2,665
sqft
|
built
1967
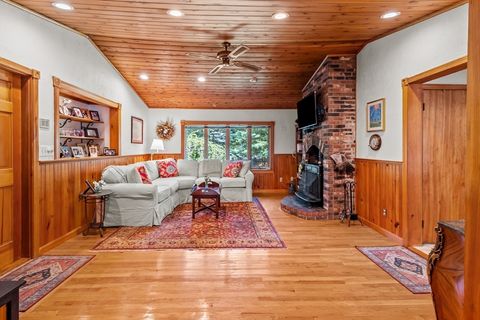
38 Standish Rd, Attleboro, MA 02703
$-500
Cash flow
-4.7%
Cash-on-Cash Return
4.6%
Cap rate
0.7%
Rent to Value Ratio
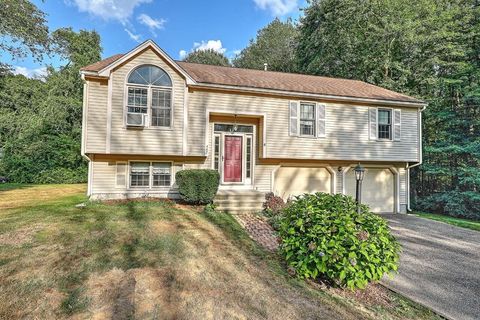
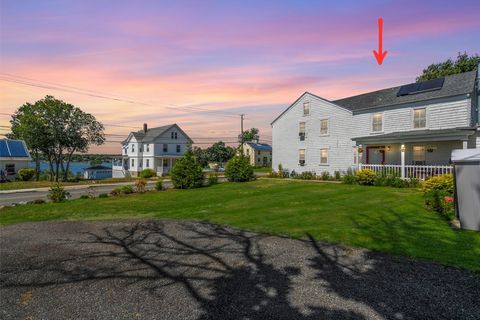
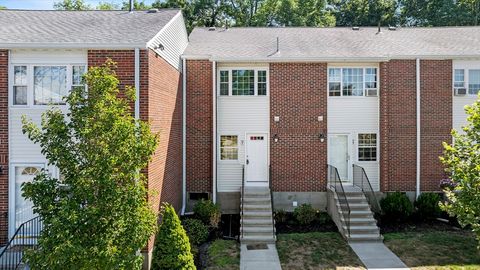
Active
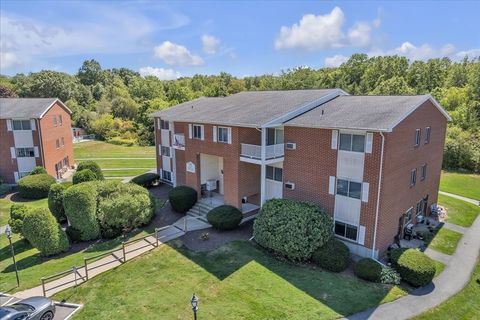
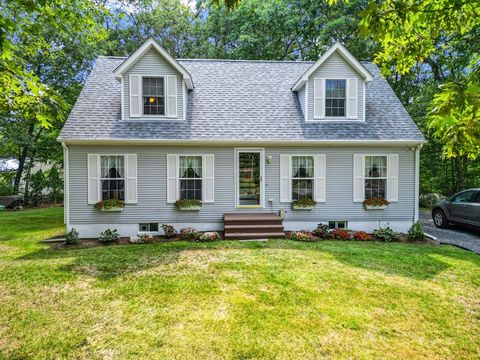
$535,000
3
bds
|
1
ba
|
1,324
sqft
|
built
1996
447 Cumberland Ave, North Attleboro, MA 02760
$-947
Cash flow
-9.2%
Cash-on-Cash Return
3.6%
Cap rate
0.5%
Rent to Value Ratio
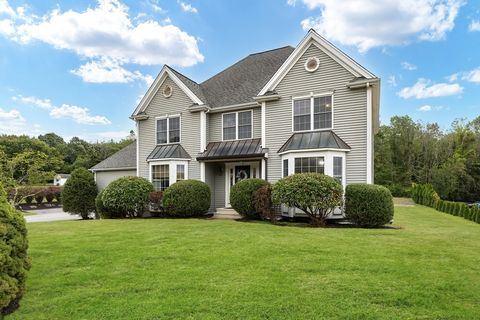
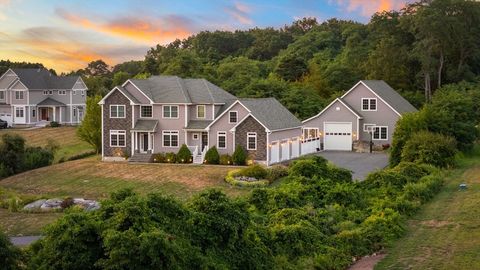
Active
$679,900
3
bds
|
2
ba
|
1,498
sqft
|
built
2007
87 Simmons St, Rehoboth, MA 02769
$-1,505
Cash flow
-11.5%
Cash-on-Cash Return
3.0%
Cap rate
0.5%
Rent to Value Ratio
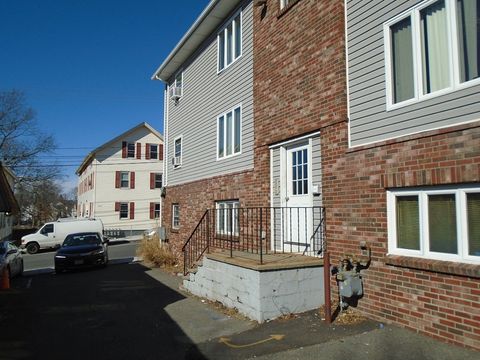
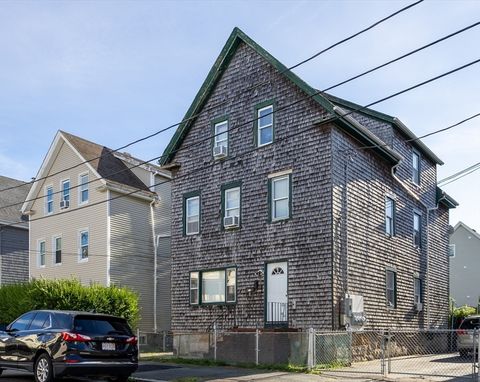
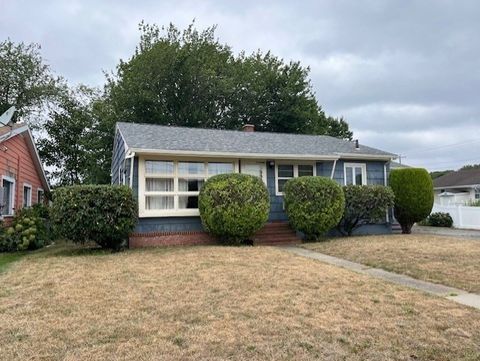
Active
$549,900
7
bds
|
3
ba
|
3,894
sqft
|
built
1900
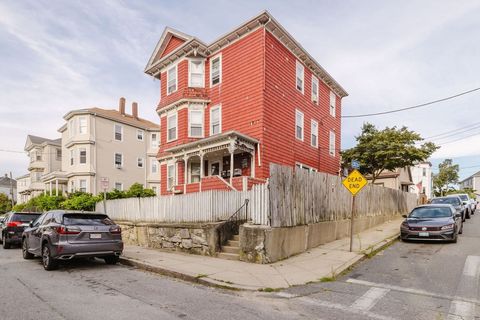
194 Albion St, Fall River, MA 02723
$-1,325
Cash flow
-12.6%
Cash-on-Cash Return
2.8%
Cap rate
0.5%
Rent to Value Ratio
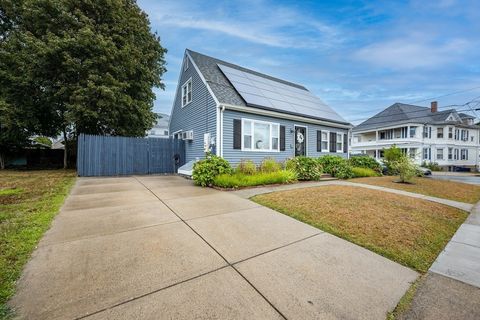
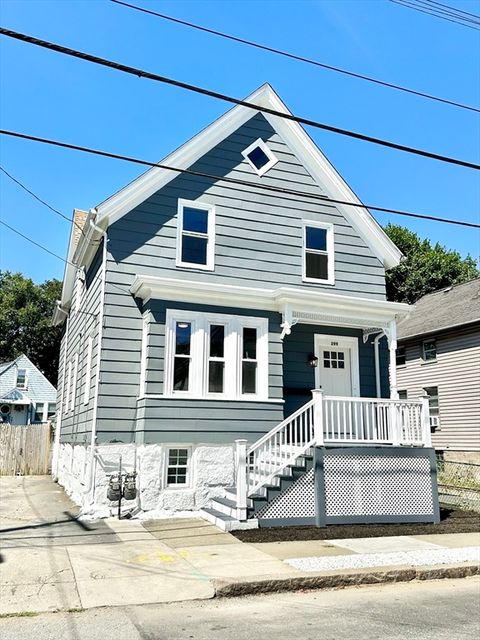
Active
$598,900
3
bds
|
2
ba
|
1,444
sqft
|
built
1950
166 Charles St, New Bedford, MA 02744
$-1,105
Cash flow
-9.6%
Cash-on-Cash Return
3.5%
Cap rate
0.5%
Rent to Value Ratio
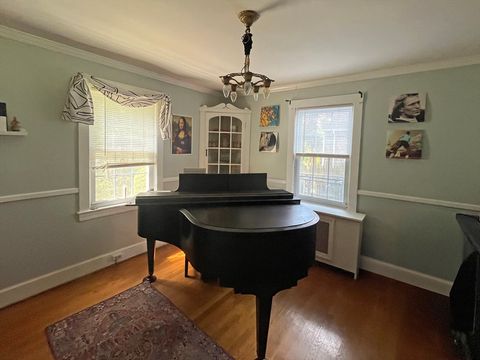
Active
$1,150,000
4
bds
|
5
ba
|
4,073
sqft
|
built
1998
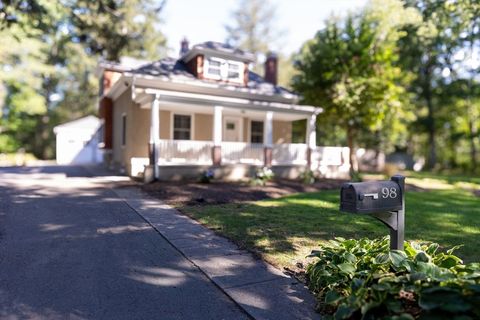
98 Union St, North Easton, MA 02356
$-2,768
Cash flow
-12.6%
Cash-on-Cash Return
2.8%
Cap rate
0.4%
Rent to Value Ratio
Active
$625,000
3
bds
|
3
ba
|
1,664
sqft
|
built
1998
794 County St, Seekonk, MA 02771
$-1,377
Cash flow
-11.5%
Cash-on-Cash Return
3.0%
Cap rate
0.5%
Rent to Value Ratio
Active
$230,000
2
bds
|
1
ba
|
722
sqft
|
built
1968
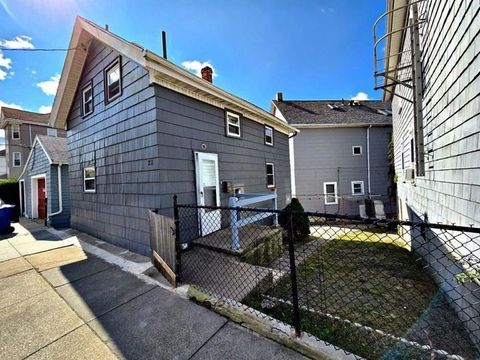
243 Robeson St, Fall River, MA 02720
$210
Cash flow
4.8%
Cash-on-Cash Return
6.8%
Cap rate
0.9%
Rent to Value Ratio
Active
$489,000
3
bds
|
2
ba
|
1,044
sqft
|
built
1988
3 Canterberry St, New Bedford, MA 02746
$-932
Cash flow
-9.9%
Cash-on-Cash Return
3.4%
Cap rate
0.5%
Rent to Value Ratio
Active
$489,000
3
bds
|
2
ba
|
1,530
sqft
|
built
1940
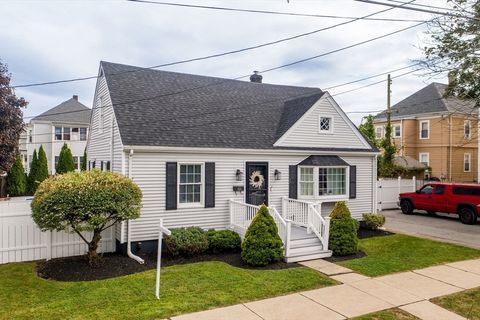
17 Grove St, New Bedford, MA 02740
$-894
Cash flow
-9.5%
Cash-on-Cash Return
3.5%
Cap rate
0.5%
Rent to Value Ratio
Active
$680,000
4
bds
|
2
ba
|
3,040
sqft
|
built
2019
46 Berwick Rd, Attleboro, MA 02703
$-1,123
Cash flow
-8.6%
Cash-on-Cash Return
3.7%
Cap rate
0.6%
Rent to Value Ratio
Active
$559,000
6
bds
|
3
ba
|
2,450
sqft
|
built
1860
3063 N Main St, Fall River, MA 02720
$-1,305
Cash flow
-12.2%
Cash-on-Cash Return
2.9%
Cap rate
0.4%
Rent to Value Ratio
Active
$659,900
5
bds
|
4
ba
|
2,238
sqft
|
built
1900
60 West St, Attleboro, MA 02703
$-1,619
Cash flow
-12.8%
Cash-on-Cash Return
2.7%
Cap rate
0.5%
Rent to Value Ratio
Active
$865,000
4
bds
|
3
ba
|
3,494
sqft
|
built
2000
85 Sheldonville Rd, North Attleboro, MA 02760
$-1,663
Cash flow
-10.0%
Cash-on-Cash Return
3.4%
Cap rate
0.5%
Rent to Value Ratio
Active
$459,000
4
bds
|
2
ba
|
1,456
sqft
|
built
1915
122 Armour St, New Bedford, MA 02740
$-405
Cash flow
-4.6%
Cash-on-Cash Return
4.6%
Cap rate
0.7%
Rent to Value Ratio
Active
$448,900
4
bds
|
1
ba
|
1,500
sqft
|
built
1951
67 Jette St, Swansea, MA 02777
$-721
Cash flow
-8.4%
Cash-on-Cash Return
3.8%
Cap rate
0.6%
Rent to Value Ratio
Active
$349,900
2
bds
|
2
ba
|
1,088
sqft
|
built
1900
63 Orange St, Attleboro, MA 02703
$-499
Cash flow
-7.4%
Cash-on-Cash Return
4.0%
Cap rate
0.6%
Rent to Value Ratio
Active
$570,000
5
bds
|
3
ba
|
2,160
sqft
|
built
1892
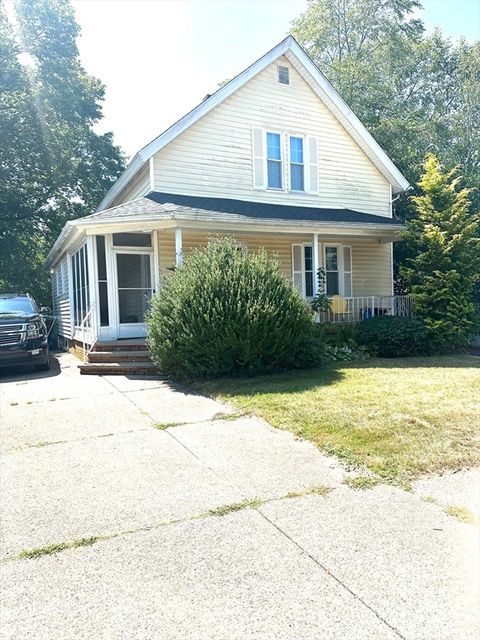
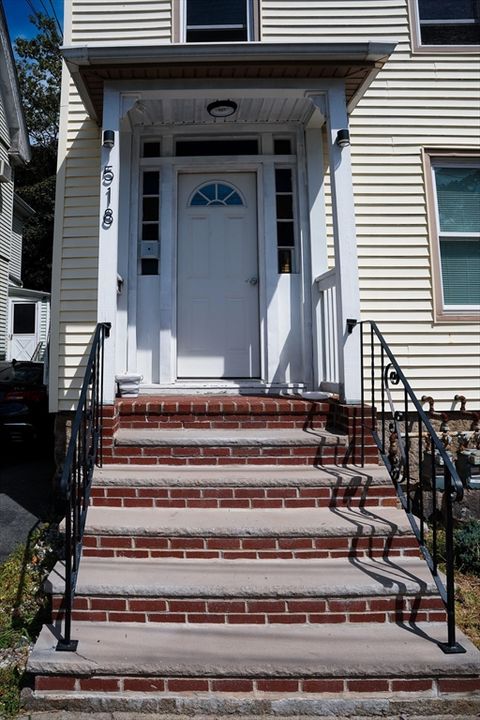
518 Cottage St, New Bedford, MA 02740
$-1,571
Cash flow
-14.4%
Cash-on-Cash Return
2.4%
Cap rate
0.4%
Rent to Value Ratio
Active
$475,000
3
bds
|
2
ba
|
1,918
sqft
|
built
1999
33 Woodstock St, Fall River, MA 02724
$-725
Cash flow
-8.0%
Cash-on-Cash Return
3.8%
Cap rate
0.6%
Rent to Value Ratio
Active
$499,000
6
bds
|
3
ba
|
2,417
sqft
|
built
1896
9 Abbott St, New Bedford, MA 02744
$-1,373
Cash flow
-14.4%
Cash-on-Cash Return
2.4%
Cap rate
0.4%
Rent to Value Ratio
Active
$355,000
4
bds
|
2
ba
|
1,548
sqft
|
built
1850
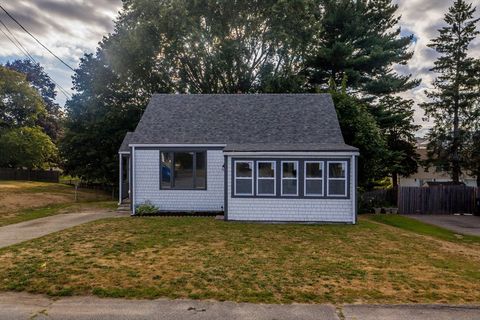
141 Milford Rd, Swansea, MA 02777
$27
Cash flow
0.4%
Cash-on-Cash Return
5.8%
Cap rate
0.9%
Rent to Value Ratio
Active
$415,000
2
bds
|
2
ba
|
1,534
sqft
|
built
1973
41 Foundry St, South Easton, MA 02375
$-1,060
Cash flow
-13.3%
Cash-on-Cash Return
2.6%
Cap rate
0.6%
Rent to Value Ratio
Active
$549,900
3
bds
|
1
ba
|
1,192
sqft
|
built
1886
86 Martin St, Rehoboth, MA 02769
$-1,175
Cash flow
-11.1%
Cash-on-Cash Return
3.1%
Cap rate
0.5%
Rent to Value Ratio
Active
$1,049,000
4
bds
|
3
ba
|
2,664
sqft
|
built
1988
56 Jacob Dr, Mansfield, MA 02048
$-2,780
Cash flow
-13.8%
Cash-on-Cash Return
2.5%
Cap rate
0.4%
Rent to Value Ratio
Active
$819,900
4
bds
|
5
ba
|
3,419
sqft
|
built
1875
97 Madison St, New Bedford, MA 02740
$-2,355
Cash flow
-15.0%
Cash-on-Cash Return
2.2%
Cap rate
0.4%
Rent to Value Ratio
Active
$299,900
2
bds
|
1
ba
|
960
sqft
|
built
1974
22 Dailey St, Attleboro, MA 02703
$-558
Cash flow
-9.7%
Cash-on-Cash Return
3.4%
Cap rate
0.7%
Rent to Value Ratio
Active
$599,900
3
bds
|
3
ba
|
1,568
sqft
|
built
2004
20 Holbrook Ave, North Attleboro, MA 02760
$-1,116
Cash flow
-9.7%
Cash-on-Cash Return
3.4%
Cap rate
0.5%
Rent to Value Ratio
Active
$449,800
2
bds
|
1
ba
|
1,260
sqft
|
built
1950
10 Ridge Rd, Norton, MA 02766
$-502
Cash flow
-5.8%
Cash-on-Cash Return
4.3%
Cap rate
0.6%
Rent to Value Ratio
Active
$369,000
3
bds
|
1
ba
|
1,210
sqft
|
built
1930
21 Deane St, Fairhaven, MA 02719
$-289
Cash flow
-4.1%
Cash-on-Cash Return
4.7%
Cap rate
0.7%
Rent to Value Ratio
Active
$575,000
3
bds
|
2
ba
|
1,632
sqft
|
built
1998
72 Neadam Ct, Swansea, MA 02777
$-1,056
Cash flow
-9.6%
Cash-on-Cash Return
3.5%
Cap rate
0.6%
Rent to Value Ratio
Active
$980,000
14
bds
|
5
ba
|
5,647
sqft
|
built
1900
48 Ridge St, Fall River, MA 02721
$-4,483
Cash flow
-23.9%
Cash-on-Cash Return
0.2%
Cap rate
0.1%
Rent to Value Ratio
Active
$639,900
3
bds
|
3
ba
|
1,804
sqft
|
built
1998
46 Pondview Cir, Taunton, MA 02780
$-1,040
Cash flow
-8.5%
Cash-on-Cash Return
3.7%
Cap rate
0.6%
Rent to Value Ratio
Active
$250,000
2
bds
|
1
ba
|
825
sqft
|
built
1900
23 Pitman St, Fall River, MA 02723
$-21
Cash flow
-0.4%
Cash-on-Cash Return
5.6%
Cap rate
0.8%
Rent to Value Ratio
Active
$649,500
3
bds
|
2
ba
|
2,272
sqft
|
built
1975
205 Kelley Blvd, North Attleboro, MA 02760
$-1,159
Cash flow
-9.3%
Cash-on-Cash Return
3.5%
Cap rate
0.5%
Rent to Value Ratio
Active
$459,900
3
bds
|
1
ba
|
1,657
sqft
|
built
1961
10 Hiram St, Fall River, MA 02720
$-546
Cash flow
-6.2%
Cash-on-Cash Return
4.3%
Cap rate
0.6%
Rent to Value Ratio
Active
$1,395,000
3
bds
|
3
ba
|
2,804
sqft
|
built
2015
586 Hart St, Dighton, MA 02715
$-4,836
Cash flow
-18.1%
Cash-on-Cash Return
1.5%
Cap rate
0.3%
Rent to Value Ratio
Active
$389,900
3
bds
|
1
ba
|
980
sqft
|
built
1957
161 Portland St, New Bedford, MA 02744
$-790
Cash flow
-10.6%
Cash-on-Cash Return
3.2%
Cap rate
0.5%
Rent to Value Ratio
Active
$489,900
3
bds
|
2
ba
|
1,762
sqft
|
built
1893
299 Cedar St, New Bedford, MA 02740
$-1,086
Cash flow
-11.6%
Cash-on-Cash Return
3.0%
Cap rate
0.4%
Rent to Value Ratio