Norfolk County Investment Properties for Sale
Browse homes for sale and investment properties in Norfolk County. Refine your search by price, property type, or more.
Best cash flowing properties in Norfolk County
Active
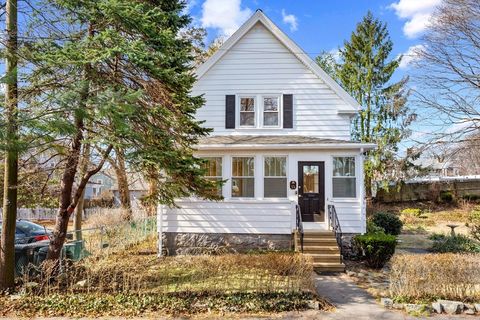
$249,000
1
bds
|
1
ba
|
448
sqft
|
built
1973
791 South St, Wrentham, MA 02093
$-392
Cash flow
-8.2%
Cash-on-Cash Return
3.8%
Cap rate
0.8%
Rent to Value Ratio
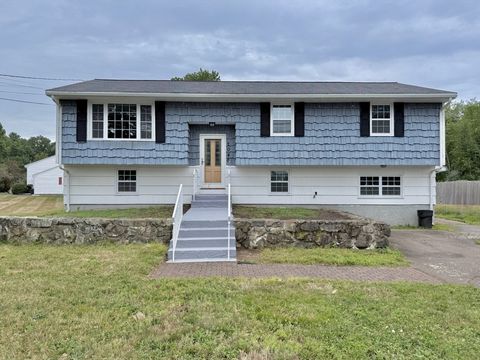
Active
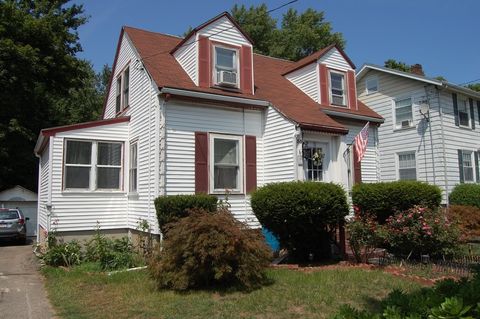
$520,000
3
bds
|
1
ba
|
1,029
sqft
|
built
1900
941 S Franklin St, Holbrook, MA 02343
$-509
Cash flow
-5.1%
Cash-on-Cash Return
4.5%
Cap rate
0.7%
Rent to Value Ratio
377 out of 583 properties for sale in Norfolk County
Limited Results Shown
Create a free account, or log in to reveal all property listings and enjoy the complete experience.
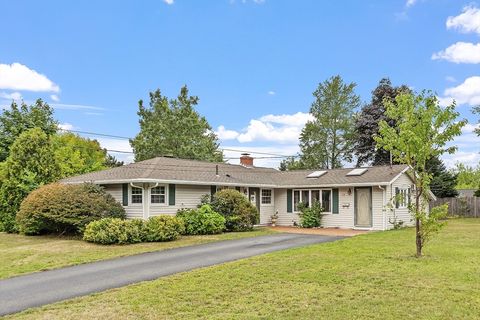
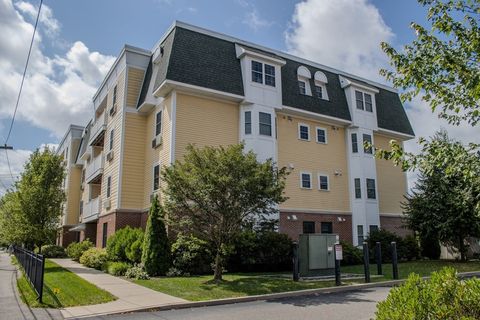
Active
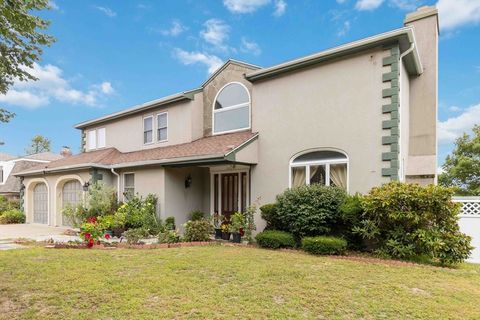
$499,000
2
bds
|
3
ba
|
1,855
sqft
|
built
1981
194 Washington St, Canton, MA 02021
$-884
Cash flow
-9.2%
Cash-on-Cash Return
3.6%
Cap rate
0.7%
Rent to Value Ratio
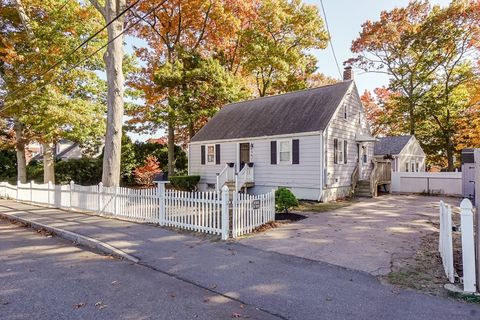
Active
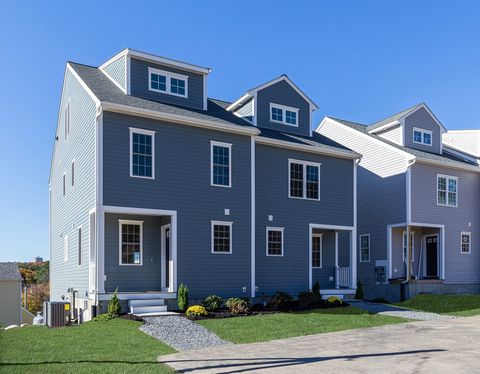
$6,500,000
6
bds
|
7
ba
|
7,400
sqft
|
built
2025
7 Mountview Rd, Wellesley, MA 02481
$-24,702
Cash flow
-19.8%
Cash-on-Cash Return
1.1%
Cap rate
0.1%
Rent to Value Ratio
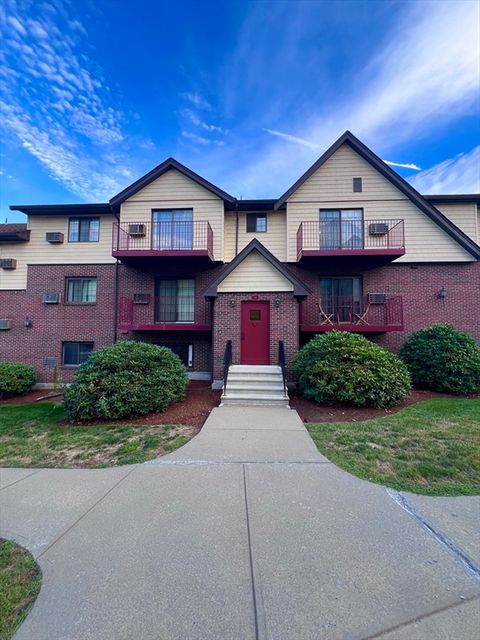
Active
$850,000
5
bds
|
3
ba
|
3,639
sqft
|
built
1900
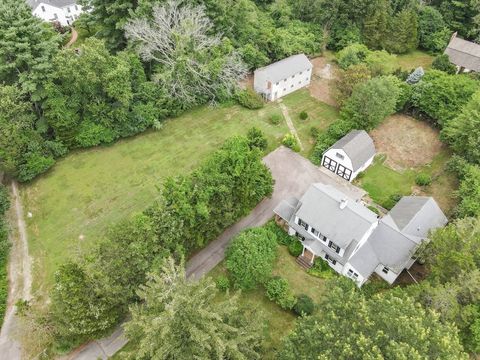
1081 Pond St, Franklin, MA 02038
$-2,662
Cash flow
-16.3%
Cash-on-Cash Return
1.9%
Cap rate
0.4%
Rent to Value Ratio
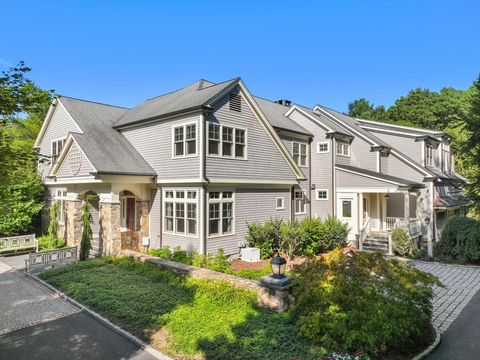
Active
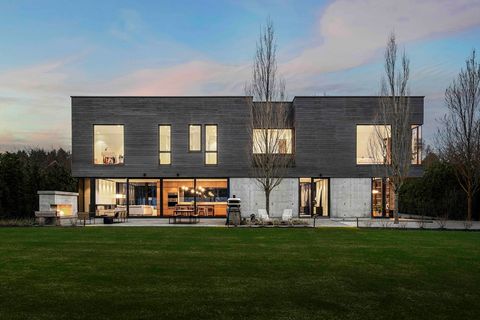
$4,299,000
4
bds
|
5
ba
|
4,420
sqft
|
built
2020
37 Carleton Dr, Needham, MA 02492
$-17,046
Cash flow
-20.7%
Cash-on-Cash Return
0.9%
Cap rate
0.2%
Rent to Value Ratio
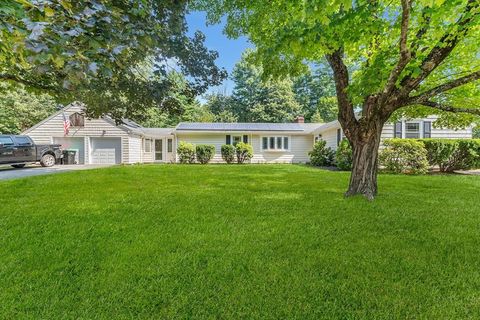
Active
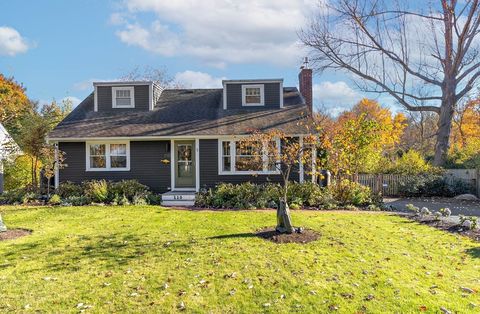
$799,000
4
bds
|
2
ba
|
1,479
sqft
|
built
1954
110 Beechwood St, Cohasset, MA 02025
$-830
Cash flow
-5.4%
Cash-on-Cash Return
4.4%
Cap rate
0.6%
Rent to Value Ratio
Active
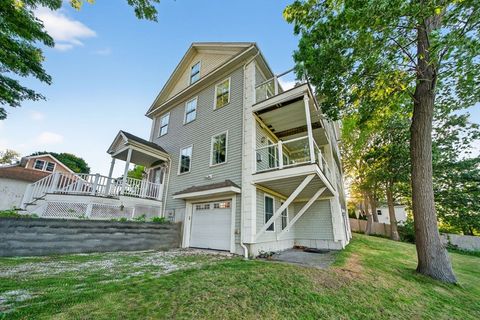
$1,125,000
5
bds
|
4
ba
|
4,400
sqft
|
built
2008
12 Quentin St, Quincy, MA 02169
$-1,628
Cash flow
-7.6%
Cash-on-Cash Return
3.9%
Cap rate
0.6%
Rent to Value Ratio
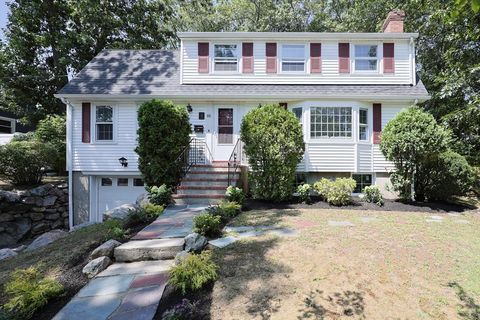
Active
$699,000
3
bds
|
2
ba
|
1,576
sqft
|
built
1900
80 Charles St, Quincy, MA 02169
$-1,620
Cash flow
-12.1%
Cash-on-Cash Return
2.9%
Cap rate
0.5%
Rent to Value Ratio
Active
$539,900
3
bds
|
1
ba
|
1,076
sqft
|
built
1900
391 Commercial St, Braintree, MA 02184
$-773
Cash flow
-7.5%
Cash-on-Cash Return
4.0%
Cap rate
0.6%
Rent to Value Ratio
Active
$625,000
4
bds
|
2
ba
|
1,710
sqft
|
built
1959
96 Roberts Ave, Holbrook, MA 02343
$-955
Cash flow
-8.0%
Cash-on-Cash Return
3.8%
Cap rate
0.6%
Rent to Value Ratio
Active
$4,495,000
6
bds
|
7
ba
|
7,867
sqft
|
built
2025
1780 Central Ave, Needham, MA 02492
$-101,086
Cash flow
-117.3%
Cash-on-Cash Return
-21.3%
Cap rate
0.1%
Rent to Value Ratio
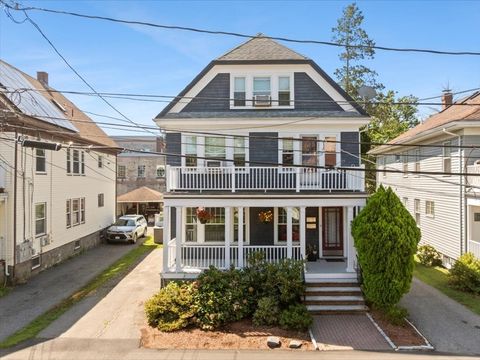
Active
$784,900
3
bds
|
2
ba
|
1,850
sqft
|
built
1900
57A West St, Quincy, MA 02169
$-1,628
Cash flow
-10.8%
Cash-on-Cash Return
3.2%
Cap rate
0.5%
Rent to Value Ratio
Active
$549,900
2
bds
|
2
ba
|
1,085
sqft
|
built
1935
55 Brook Rd, Quincy, MA 02169
$-1,052
Cash flow
-10.0%
Cash-on-Cash Return
3.4%
Cap rate
0.5%
Rent to Value Ratio
Active
$1,350,000
3
bds
|
4
ba
|
2,816
sqft
|
built
1991
141 Gardiner Rd, Quincy, MA 02169
$-4,023
Cash flow
-15.5%
Cash-on-Cash Return
2.1%
Cap rate
0.4%
Rent to Value Ratio
Active
$675,000
3
bds
|
4
ba
|
1,740
sqft
|
built
2025
7 Hill St, Norfolk, MA 02056
$-1,777
Cash flow
-13.7%
Cash-on-Cash Return
2.5%
Cap rate
0.5%
Rent to Value Ratio
Active
$478,000
2
bds
|
2
ba
|
980
sqft
|
built
1989
200 Falls Blvd, Quincy, MA 02169
$-1,619
Cash flow
-17.7%
Cash-on-Cash Return
1.6%
Cap rate
0.5%
Rent to Value Ratio
Active
$479,000
2
bds
|
2
ba
|
1,158
sqft
|
built
1989
785 Washington St, Norwood, MA 02062
$-997
Cash flow
-10.9%
Cash-on-Cash Return
3.2%
Cap rate
0.6%
Rent to Value Ratio
Active
$899,000
2
bds
|
2
ba
|
1,634
sqft
|
built
1987
2001 Marina Dr, Quincy, MA 02171
$-3,410
Cash flow
-19.8%
Cash-on-Cash Return
1.1%
Cap rate
0.5%
Rent to Value Ratio
Active
$1,329,000
2
bds
|
2
ba
|
1,562
sqft
|
built
1973
65 Grove St, Wellesley, MA 02482
$-4,527
Cash flow
-17.8%
Cash-on-Cash Return
1.6%
Cap rate
0.4%
Rent to Value Ratio
Active
$4,250,000
5
bds
|
8
ba
|
10,400
sqft
|
built
2002
9 Stonegate Dr, Westwood, MA 02090
$-16,106
Cash flow
-19.8%
Cash-on-Cash Return
1.1%
Cap rate
0.3%
Rent to Value Ratio
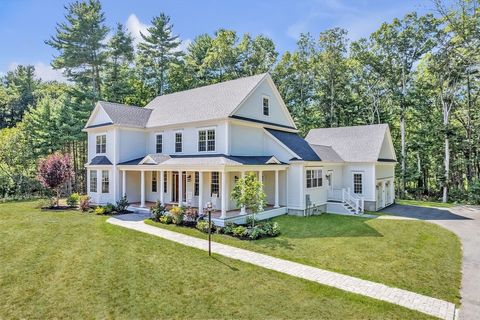
Active
$1,499,000
4
bds
|
4
ba
|
3,752
sqft
|
built
2023
1 Granite Dr, Millis, MA 02054
$-5,019
Cash flow
-17.5%
Cash-on-Cash Return
1.7%
Cap rate
0.4%
Rent to Value Ratio
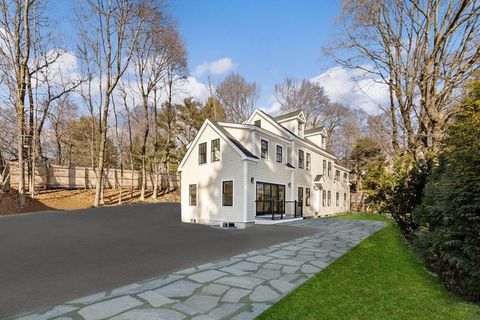
Active
$1,999,000
5
bds
|
5
ba
|
4,580
sqft
|
built
2024
25 Shaw Rd, Wellesley, MA 02481
$-6,783
Cash flow
-17.7%
Cash-on-Cash Return
1.6%
Cap rate
0.3%
Rent to Value Ratio

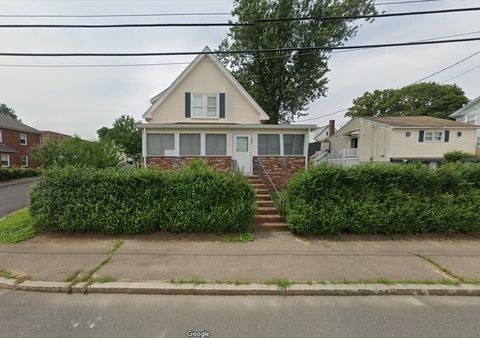
Active
$525,000
3
bds
|
1
ba
|
1,352
sqft
|
built
1890
108 High St, Dedham, MA 02026
$-598
Cash flow
-5.9%
Cash-on-Cash Return
4.3%
Cap rate
0.7%
Rent to Value Ratio
Active
$550,000
3
bds
|
1
ba
|
1,496
sqft
|
built
1903
222 Neck St, Weymouth, MA 02191
$-561
Cash flow
-5.3%
Cash-on-Cash Return
4.5%
Cap rate
0.7%
Rent to Value Ratio
Active
$670,000
4
bds
|
2
ba
|
1,436
sqft
|
built
1971
2040 Central St, Stoughton, MA 02072
$-1,197
Cash flow
-9.3%
Cash-on-Cash Return
3.5%
Cap rate
0.5%
Rent to Value Ratio
Active
$659,900
3
bds
|
2
ba
|
1,703
sqft
|
built
1955
115 Richard Rd, Braintree, MA 02184
$-877
Cash flow
-6.9%
Cash-on-Cash Return
4.1%
Cap rate
0.5%
Rent to Value Ratio
Active
$520,000
2
bds
|
1
ba
|
1,080
sqft
|
built
1950
5 Oliver St, Randolph, MA 02368
$-732
Cash flow
-7.3%
Cash-on-Cash Return
4.0%
Cap rate
0.6%
Rent to Value Ratio
Active
$324,900
2
bds
|
1
ba
|
962
sqft
|
built
1971
11 Royal Crest Dr, Randolph, MA 02368
$-566
Cash flow
-9.1%
Cash-on-Cash Return
3.6%
Cap rate
0.8%
Rent to Value Ratio
Active
$618,000
2
bds
|
2
ba
|
1,325
sqft
|
built
2015
39 Fayette St, Quincy, MA 02171
$-1,666
Cash flow
-14.1%
Cash-on-Cash Return
2.4%
Cap rate
0.5%
Rent to Value Ratio
Active
$624,900
3
bds
|
2
ba
|
1,452
sqft
|
built
1960
16 Elizabeth St, Plainville, MA 02762
$-1,075
Cash flow
-9.0%
Cash-on-Cash Return
3.6%
Cap rate
0.6%
Rent to Value Ratio
Active
$849,000
4
bds
|
2
ba
|
2,344
sqft
|
built
1958
88 Fox Meadow Ln, Dedham, MA 02026
$-2,371
Cash flow
-14.6%
Cash-on-Cash Return
2.3%
Cap rate
0.4%
Rent to Value Ratio
Active
$1,100,000
4
bds
|
2
ba
|
2,700
sqft
|
built
1920
15 Belvoir Rd, Milton, MA 02186
$-3,531
Cash flow
-16.7%
Cash-on-Cash Return
1.8%
Cap rate
0.3%
Rent to Value Ratio
Active
$449,900
2
bds
|
3
ba
|
2,005
sqft
|
built
1981
3 Franklin Sq, Randolph, MA 02368
$-918
Cash flow
-10.6%
Cash-on-Cash Return
3.2%
Cap rate
0.6%
Rent to Value Ratio
Active
$469,900
2
bds
|
2
ba
|
1,092
sqft
|
built
2006
614 Pond St, Braintree, MA 02184
$-770
Cash flow
-8.5%
Cash-on-Cash Return
3.7%
Cap rate
0.6%
Rent to Value Ratio
Active
$899,900
4
bds
|
3
ba
|
2,408
sqft
|
built
2019
5 Main St, Quincy, MA 02169
$-2,493
Cash flow
-14.5%
Cash-on-Cash Return
2.4%
Cap rate
0.4%
Rent to Value Ratio
Active
$999,993
6
bds
|
5
ba
|
5,046
sqft
|
built
1960
488 Maple St, Franklin, MA 02038
$-1,404
Cash flow
-7.3%
Cash-on-Cash Return
4.0%
Cap rate
0.6%
Rent to Value Ratio
Active
$1,950,000
5
bds
|
3
ba
|
3,814
sqft
|
built
1950
145 Walpole St, Dover, MA 02030
$-5,689
Cash flow
-15.2%
Cash-on-Cash Return
2.2%
Cap rate
0.4%
Rent to Value Ratio
Active
$2,325,000
4
bds
|
4
ba
|
5,018
sqft
|
built
1983
14 Ruel Dr, Dover, MA 02030
$-7,659
Cash flow
-17.2%
Cash-on-Cash Return
1.7%
Cap rate
0.3%
Rent to Value Ratio
Active
$799,999
4
bds
|
2
ba
|
1,292
sqft
|
built
1933
15 Highland Ave, Braintree, MA 02184
$-1,542
Cash flow
-10.1%
Cash-on-Cash Return
3.4%
Cap rate
0.5%
Rent to Value Ratio