Hennepin County Investment Properties for Sale
Browse homes for sale and investment properties in Hennepin County. Refine your search by price, property type, or more.
Best cash flowing properties in Hennepin County
Active
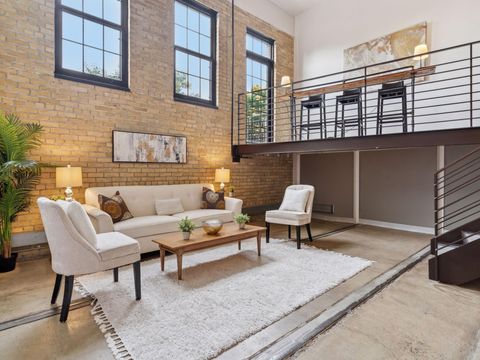
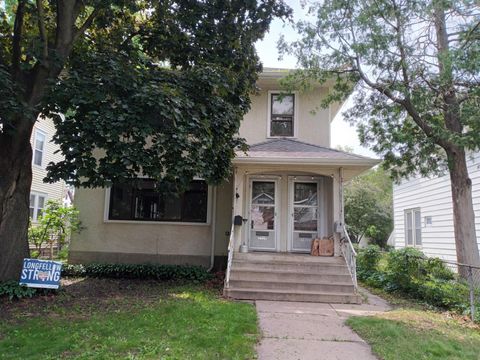
$119,000
1
bds
|
1
ba
|
552
sqft
|
built
1925
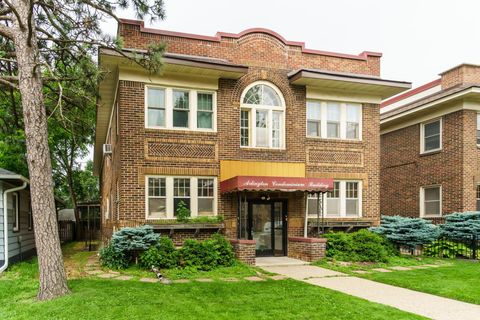
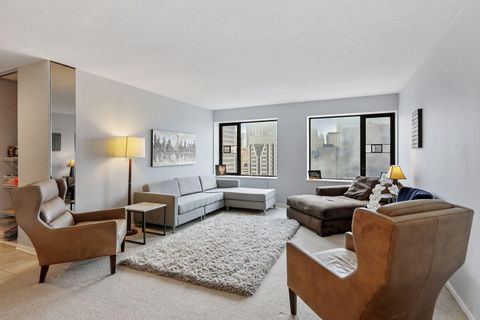
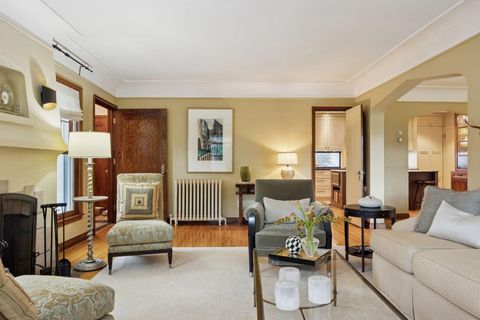
4720 Nicollet Ave, Minneapolis, MN 55419
$230
Cash flow
10.1%
Cash-on-Cash Return
8.6%
Cap rate
1.5%
Rent to Value Ratio
Active
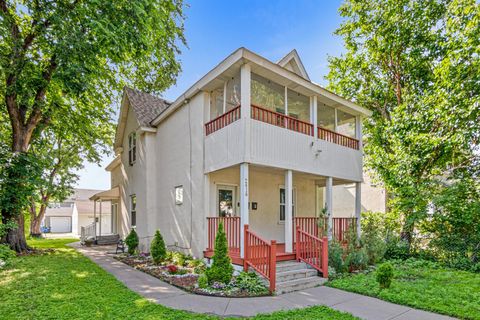
$309,000
3
bds
|
2
ba
|
1,605
sqft
|
built
1922
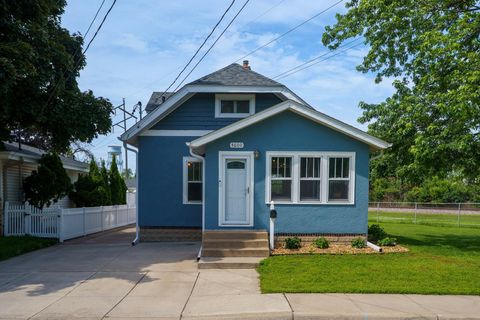
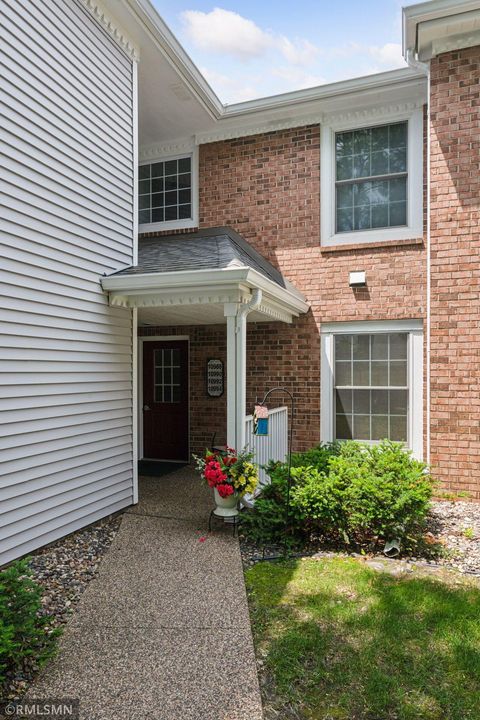
4600 39 1/2 Ave N, Minneapolis, MN 55422
$52
Cash flow
0.9%
Cash-on-Cash Return
5.9%
Cap rate
0.9%
Rent to Value Ratio
1,910 out of 3,292 properties for sale in Hennepin County
Limited Results Shown
Create a free account, or log in to reveal all property listings and enjoy the complete experience.

Active
$399,900
3
bds
|
2
ba
|
1,569
sqft
|
built
1920
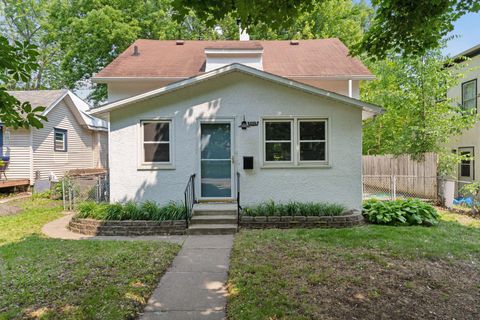
4108 Highwood Rd, Mound, MN 55364
$-186
Cash flow
-2.4%
Cash-on-Cash Return
5.1%
Cap rate
0.7%
Rent to Value Ratio
Active
$299,900
2
bds
|
1
ba
|
1,055
sqft
|
built
1926
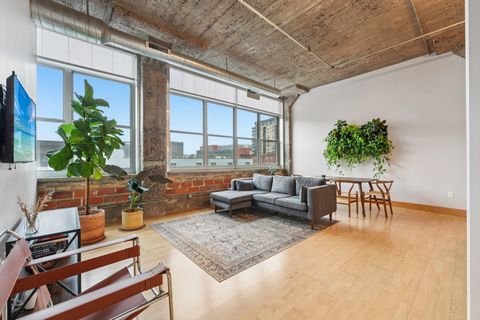
521 S 7th St, Minneapolis, MN 55415
$-339
Cash flow
-5.9%
Cash-on-Cash Return
4.3%
Cap rate
0.9%
Rent to Value Ratio
Active
$315,000
3
bds
|
1
ba
|
1,312
sqft
|
built
1924
5529 40th Ave S, Minneapolis, MN 55417
$-221
Cash flow
-3.7%
Cash-on-Cash Return
4.8%
Cap rate
0.7%
Rent to Value Ratio
Active
$219,900
2
bds
|
2
ba
|
1,176
sqft
|
built
1965
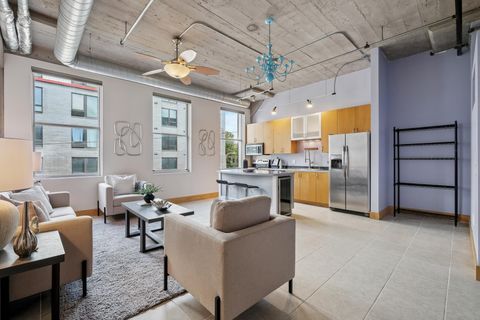
19 S 1st St, Minneapolis, MN 55401
$-676
Cash flow
-16.0%
Cash-on-Cash Return
2.0%
Cap rate
1.1%
Rent to Value Ratio
Active
$225,000
2
bds
|
2
ba
|
1,344
sqft
|
built
1984
10992 Quebec Ave S, Minneapolis, MN 55438
$-409
Cash flow
-9.5%
Cash-on-Cash Return
3.5%
Cap rate
0.9%
Rent to Value Ratio
Active
$335,000
6
bds
|
2
ba
|
5,272
sqft
|
built
1900
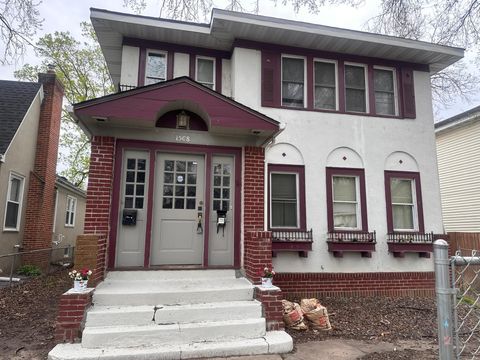
1508 Oliver Ave N, Minneapolis, MN 55411
$-743
Cash flow
-11.6%
Cash-on-Cash Return
3.0%
Cap rate
0.5%
Rent to Value Ratio
Active
$229,000
1
bds
|
1
ba
|
800
sqft
|
built
1923
918 3rd St N, Minneapolis, MN 55401
$-578
Cash flow
-13.2%
Cash-on-Cash Return
2.7%
Cap rate
0.9%
Rent to Value Ratio
Active
$2,350,000
4
bds
|
4
ba
|
3,488
sqft
|
built
2012
221 George St, Excelsior, MN 55331
$-10,174
Cash flow
-22.6%
Cash-on-Cash Return
0.5%
Cap rate
0.2%
Rent to Value Ratio

Active
$179,595
2
bds
|
2
ba
|
1,400
sqft
|
built
1986
1425 W 28th St, Minneapolis, MN 55408
$-718
Cash flow
-20.9%
Cash-on-Cash Return
0.9%
Cap rate
1.0%
Rent to Value Ratio
Active
$524,900
6
bds
|
2
ba
|
2,473
sqft
|
built
1950
2622 Mc Nair Dr N, Minneapolis, MN 55422
$-2,217
Cash flow
-22.0%
Cash-on-Cash Return
0.6%
Cap rate
0.4%
Rent to Value Ratio
Active
$885,000
4
bds
|
3
ba
|
3,412
sqft
|
built
1900
5224 17th Ave S, Minneapolis, MN 55417
$-2,011
Cash flow
-11.9%
Cash-on-Cash Return
3.0%
Cap rate
0.5%
Rent to Value Ratio

Active
$525,000
4
bds
|
2
ba
|
1,900
sqft
|
built
1917
3520 32nd Ave S, Minneapolis, MN 55406
$-1,217
Cash flow
-12.1%
Cash-on-Cash Return
2.9%
Cap rate
0.4%
Rent to Value Ratio
Active
$329,900
3
bds
|
1
ba
|
1,252
sqft
|
built
1913
613 W 38th St, Minneapolis, MN 55409
$-191
Cash flow
-3.0%
Cash-on-Cash Return
5.0%
Cap rate
0.7%
Rent to Value Ratio
Active
$199,900
2
bds
|
2
ba
|
960
sqft
|
built
1973
333 8th St SE, Minneapolis, MN 55414
$-560
Cash flow
-14.6%
Cash-on-Cash Return
2.3%
Cap rate
0.9%
Rent to Value Ratio
Active
$449,000
4
bds
|
2
ba
|
1,784
sqft
|
built
1910
4222 Nokomis Ave, Minneapolis, MN 55406
$-1,568
Cash flow
-18.2%
Cash-on-Cash Return
2.1%
Cap rate
0.4%
Rent to Value Ratio
Active
$147,990
2
bds
|
1
ba
|
985
sqft
|
built
1970
7412 W 22nd St, Minneapolis, MN 55426
$-294
Cash flow
-10.4%
Cash-on-Cash Return
3.3%
Cap rate
1.1%
Rent to Value Ratio
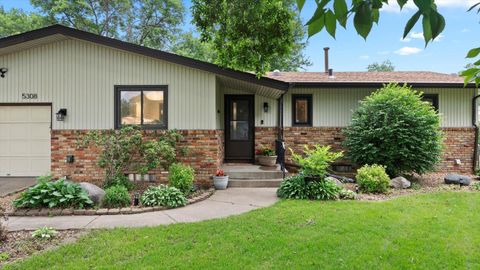
Active
$349,900
3
bds
|
2
ba
|
1,577
sqft
|
built
1966
5308 80th Ave N, Minneapolis, MN 55443
$-390
Cash flow
-5.8%
Cash-on-Cash Return
4.3%
Cap rate
0.7%
Rent to Value Ratio
Active
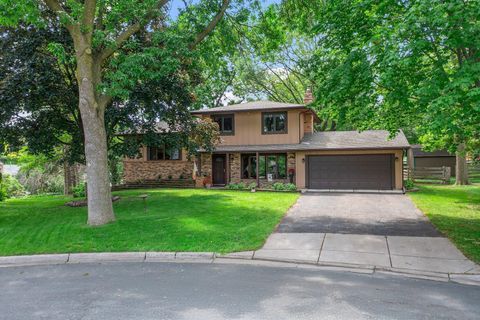
$429,900
4
bds
|
3
ba
|
1,960
sqft
|
built
1975
9009 44th Cir N, Minneapolis, MN 55428
$-555
Cash flow
-6.7%
Cash-on-Cash Return
4.1%
Cap rate
0.7%
Rent to Value Ratio
Active
$249,900
2
bds
|
1
ba
|
1,158
sqft
|
built
1923
3542 Garfield Ave, Minneapolis, MN 55408
$-352
Cash flow
-7.3%
Cash-on-Cash Return
4.6%
Cap rate
0.9%
Rent to Value Ratio
Active
$214,999
2
bds
|
1
ba
|
1,081
sqft
|
built
1915
1718 Clinton Ave, Minneapolis, MN 55404
$-455
Cash flow
-11.0%
Cash-on-Cash Return
3.7%
Cap rate
0.9%
Rent to Value Ratio
Active
$489,000
2
bds
|
3
ba
|
2,561
sqft
|
built
1996
16515 41st Ave N, Plymouth, MN 55446
$-988
Cash flow
-10.5%
Cash-on-Cash Return
3.3%
Cap rate
0.6%
Rent to Value Ratio
Active
$739,000
5
bds
|
2
ba
|
3,454
sqft
|
built
1932
5341 Nicollet Ave, Minneapolis, MN 55419
$-2,564
Cash flow
-18.1%
Cash-on-Cash Return
1.5%
Cap rate
0.3%
Rent to Value Ratio
Active
$599,900
5
bds
|
4
ba
|
3,515
sqft
|
built
2003
10353 Yates Dr N, Minneapolis, MN 55443
$-1,245
Cash flow
-10.8%
Cash-on-Cash Return
3.2%
Cap rate
0.5%
Rent to Value Ratio
Active
$365,000
3
bds
|
2
ba
|
1,503
sqft
|
built
1924
4301 Columbus Ave, Minneapolis, MN 55407
$-683
Cash flow
-9.8%
Cash-on-Cash Return
3.4%
Cap rate
0.5%
Rent to Value Ratio
Active
$639,900
2
bds
|
2
ba
|
1,480
sqft
|
built
2004
150 2nd St NE, Minneapolis, MN 55413
$-2,901
Cash flow
-23.7%
Cash-on-Cash Return
0.2%
Cap rate
0.5%
Rent to Value Ratio
Active
$350,000
2
bds
|
1
ba
|
1,466
sqft
|
built
1928
730 Stinson Blvd, Minneapolis, MN 55413
$-1,111
Cash flow
-16.6%
Cash-on-Cash Return
1.9%
Cap rate
0.8%
Rent to Value Ratio
Active
$439,900
5
bds
|
2
ba
|
2,200
sqft
|
built
1900
2414 3rd St NE, Minneapolis, MN 55418
$-564
Cash flow
-6.7%
Cash-on-Cash Return
4.1%
Cap rate
0.7%
Rent to Value Ratio

Active
$438,000
4
bds
|
3
ba
|
2,179
sqft
|
built
2022
11263 131st Cir N, Dayton, MN 55327
$-302
Cash flow
-3.6%
Cash-on-Cash Return
4.9%
Cap rate
0.7%
Rent to Value Ratio

Active
$345,000
7
bds
|
3
ba
|
1,729
sqft
|
built
1900
344 16th Ave NE, Minneapolis, MN 55413
$-248
Cash flow
-3.8%
Cash-on-Cash Return
4.8%
Cap rate
0.8%
Rent to Value Ratio
Active
$525,000
3
bds
|
2
ba
|
1,947
sqft
|
built
1929
5227 10th Ave S, Minneapolis, MN 55417
$-881
Cash flow
-8.8%
Cash-on-Cash Return
3.7%
Cap rate
0.6%
Rent to Value Ratio
Active
$850,000
3
bds
|
3
ba
|
2,568
sqft
|
built
1932
2922 Ewing Ave S, Minneapolis, MN 55416
$-2,254
Cash flow
-13.8%
Cash-on-Cash Return
2.5%
Cap rate
0.5%
Rent to Value Ratio
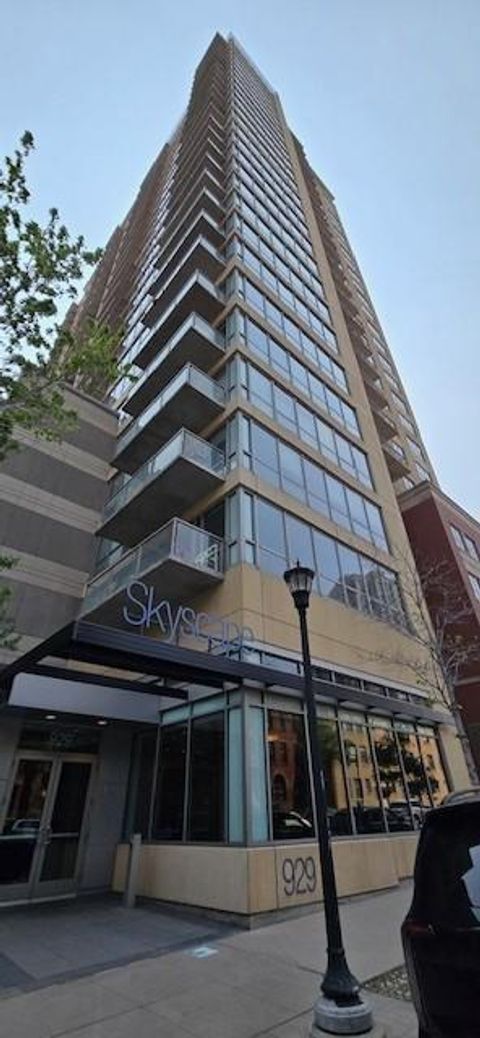
Active
$299,000
2
bds
|
2
ba
|
1,120
sqft
|
built
2006
929 Portland Ave, Minneapolis, MN 55404
$-1,264
Cash flow
-22.1%
Cash-on-Cash Return
0.6%
Cap rate
0.7%
Rent to Value Ratio
Active
$475,000
4
bds
|
2
ba
|
2,288
sqft
|
built
1926
4213 Cedar Ave S, Minneapolis, MN 55407
$-1,521
Cash flow
-16.7%
Cash-on-Cash Return
2.4%
Cap rate
0.4%
Rent to Value Ratio
Active
$235,000
2
bds
|
1
ba
|
1,072
sqft
|
built
1916
2545 Bryant Ave S, Minneapolis, MN 55405
$-489
Cash flow
-10.9%
Cash-on-Cash Return
3.2%
Cap rate
0.8%
Rent to Value Ratio
Active
$440,000
4
bds
|
3
ba
|
1,907
sqft
|
built
2022
11242 131st Ave N, Dayton, MN 55327
$-359
Cash flow
-4.3%
Cash-on-Cash Return
4.7%
Cap rate
0.7%
Rent to Value Ratio
Active
$480,000
5
bds
|
2
ba
|
2,700
sqft
|
built
1925
3022 39th Ave S, Minneapolis, MN 55406
$-547
Cash flow
-5.9%
Cash-on-Cash Return
4.3%
Cap rate
0.5%
Rent to Value Ratio
Active
$265,000
2
bds
|
1
ba
|
1,074
sqft
|
built
1947
2638 Howard St NE, Minneapolis, MN 55418
$-27
Cash flow
-0.5%
Cash-on-Cash Return
5.6%
Cap rate
0.8%
Rent to Value Ratio
Active
$309,000
3
bds
|
2
ba
|
1,605
sqft
|
built
1922
4600 39 1/2 Ave N, Minneapolis, MN 55422
$52
Cash flow
0.9%
Cash-on-Cash Return
5.9%
Cap rate
0.9%
Rent to Value Ratio
Active
$289,900
3
bds
|
2
ba
|
1,618
sqft
|
built
1900
1314 Washington St NE, Minneapolis, MN 55413
$-320
Cash flow
-5.8%
Cash-on-Cash Return
4.4%
Cap rate
0.7%
Rent to Value Ratio
Active
$119,000
1
bds
|
1
ba
|
552
sqft
|
built
1925
4720 Nicollet Ave, Minneapolis, MN 55419
$230
Cash flow
10.1%
Cash-on-Cash Return
8.6%
Cap rate
1.5%
Rent to Value Ratio