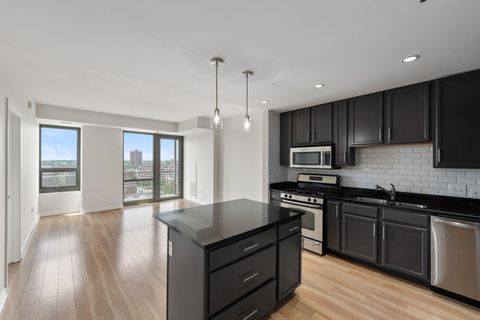
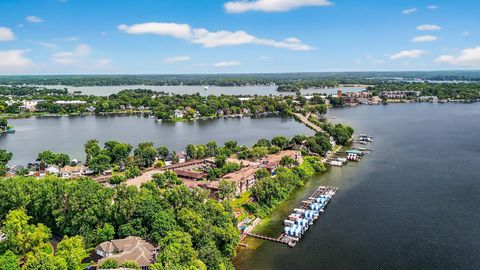
Hennepin County Investment Properties for Sale
Browse homes for sale and investment properties in Hennepin County. Refine your search by price, property type, or more.
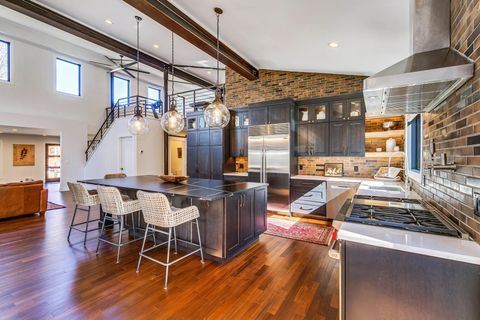
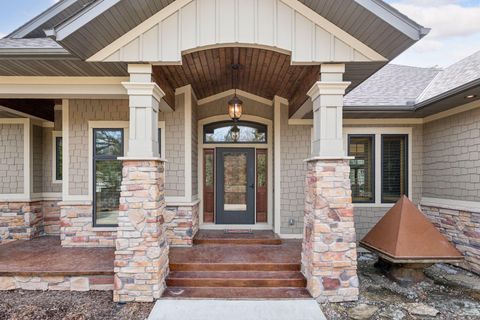
Best cash flowing properties in Hennepin County

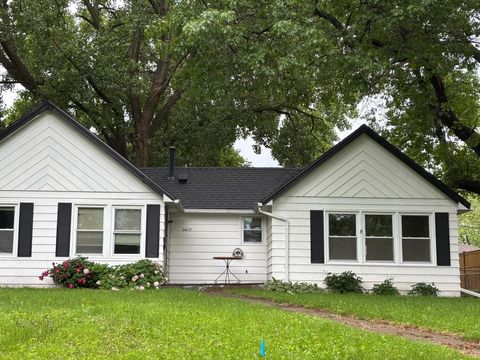
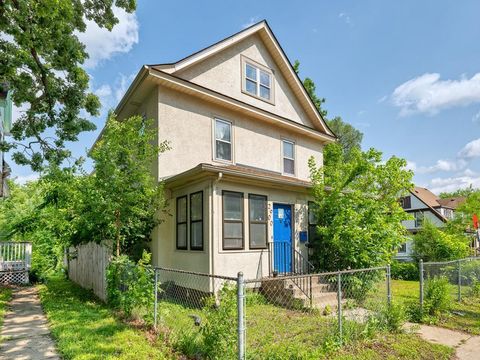
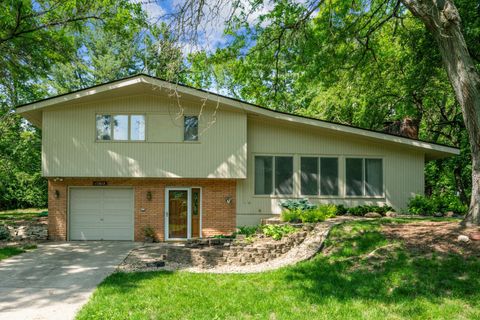
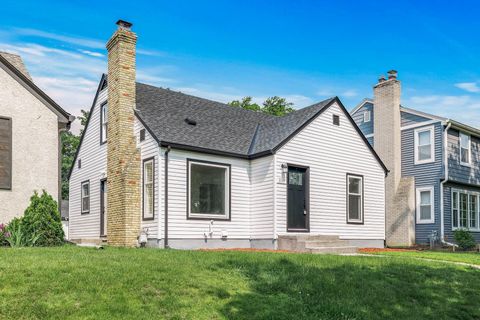
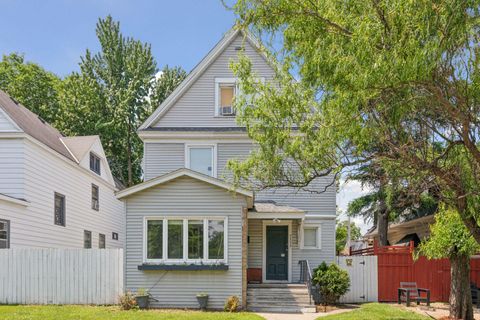
Active
$229,900
2
bds
|
1
ba
|
1,050
sqft
|
built
1929
4234 Upton Ave N, Minneapolis, MN 55412
$232
Cash flow
5.3%
Cash-on-Cash Return
6.9%
Cap rate
1.0%
Rent to Value Ratio
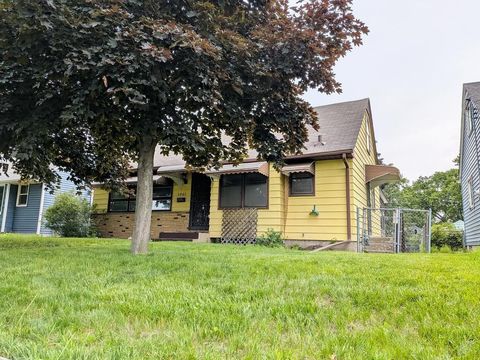
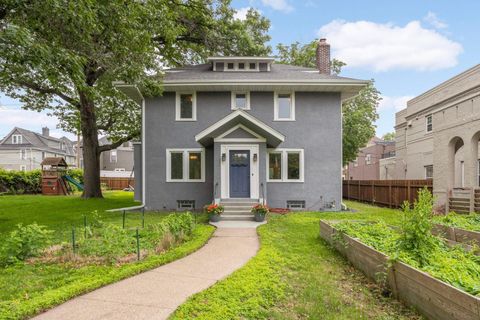
Active
$198,900
3
bds
|
1
ba
|
890
sqft
|
built
1945
3420 Major Ave N, Minneapolis, MN 55422
$209
Cash flow
5.5%
Cash-on-Cash Return
6.9%
Cap rate
1.0%
Rent to Value Ratio
1,898 out of 3,276 properties for sale in Hennepin County
Limited Results Shown
Create a free account, or log in to reveal all property listings and enjoy the complete experience.
Active
$190,000
2
bds
|
1
ba
|
800
sqft
|
built
1914
611 E 16th St, Minneapolis, MN 55404
$-270
Cash flow
-7.4%
Cash-on-Cash Return
4.0%
Cap rate
0.8%
Rent to Value Ratio
Active
$275,000
4
bds
|
2
ba
|
2,016
sqft
|
built
1912
915 Russell Ave N, Minneapolis, MN 55411
$-10
Cash flow
-0.2%
Cash-on-Cash Return
5.6%
Cap rate
0.8%
Rent to Value Ratio
Active
$335,000
3
bds
|
1
ba
|
1,014
sqft
|
built
1948
431 Pierce St NE, Minneapolis, MN 55413
$-541
Cash flow
-8.4%
Cash-on-Cash Return
3.7%
Cap rate
0.6%
Rent to Value Ratio
Active
$265,000
6
bds
|
1
ba
|
2,408
sqft
|
built
1911
2900 Emerson Ave N, Minneapolis, MN 55411
$-117
Cash flow
-2.3%
Cash-on-Cash Return
5.1%
Cap rate
0.8%
Rent to Value Ratio
Active
$2,850,000
5
bds
|
7
ba
|
6,186
sqft
|
built
1926
4232 Fremont Ave S, Minneapolis, MN 55409
$-10,689
Cash flow
-19.6%
Cash-on-Cash Return
1.2%
Cap rate
0.2%
Rent to Value Ratio
Active
$105,000
1
bds
|
1
ba
|
660
sqft
|
built
1985
433 S 7th St, Minneapolis, MN 55415
$-320
Cash flow
-15.9%
Cash-on-Cash Return
2.0%
Cap rate
1.3%
Rent to Value Ratio
Active
$735,000
3
bds
|
3
ba
|
1,820
sqft
|
built
1980
100 2nd St SE, Minneapolis, MN 55414
$-4,065
Cash flow
-28.9%
Cash-on-Cash Return
-1.0%
Cap rate
0.4%
Rent to Value Ratio
Active
$199,900
1
bds
|
1
ba
|
780
sqft
|
built
2006
929 Portland Ave, Minneapolis, MN 55404
$-559
Cash flow
-14.6%
Cash-on-Cash Return
2.3%
Cap rate
0.9%
Rent to Value Ratio
Active
$122,400
1
bds
|
1
ba
|
684
sqft
|
built
1969
4371 Wilshire Blvd, Mound, MN 55364
$-254
Cash flow
-10.8%
Cash-on-Cash Return
3.2%
Cap rate
1.1%
Rent to Value Ratio

Active
$595,000
2
bds
|
2
ba
|
1,479
sqft
|
built
2017
1240 S 2nd St, Minneapolis, MN 55415
$-1,646
Cash flow
-14.4%
Cash-on-Cash Return
2.4%
Cap rate
0.7%
Rent to Value Ratio
Active
$249,900
2
bds
|
2
ba
|
1,104
sqft
|
built
1988
5425 Orleans Ln N, Plymouth, MN 55442
$-324
Cash flow
-6.8%
Cash-on-Cash Return
4.1%
Cap rate
0.8%
Rent to Value Ratio
Active
$379,900
4
bds
|
2
ba
|
1,801
sqft
|
built
1931
5705 36th Ave S, Minneapolis, MN 55417
$-242
Cash flow
-3.3%
Cash-on-Cash Return
4.9%
Cap rate
0.8%
Rent to Value Ratio
Active
$374,900
3
bds
|
2
ba
|
1,966
sqft
|
built
1957
15812 Woodgate Rd N, Minnetonka, MN 55345
$-218
Cash flow
-3.0%
Cash-on-Cash Return
5.0%
Cap rate
0.7%
Rent to Value Ratio
Active
$675,000
6
bds
|
3
ba
|
2,836
sqft
|
built
1916
1407 Madison St NE, Minneapolis, MN 55413
$-2,217
Cash flow
-17.1%
Cash-on-Cash Return
1.7%
Cap rate
0.4%
Rent to Value Ratio
Active
$995,000
8
bds
|
6
ba
|
5,837
sqft
|
built
1905
2516 Humboldt Ave S, Minneapolis, MN 55405
$-4,303
Cash flow
-22.6%
Cash-on-Cash Return
0.5%
Cap rate
0.3%
Rent to Value Ratio
Active
$199,900
2
bds
|
3
ba
|
1,426
sqft
|
built
1972
6304 Welcome Ave N, Minneapolis, MN 55429
$90
Cash flow
2.3%
Cash-on-Cash Return
6.2%
Cap rate
1.2%
Rent to Value Ratio

Active
$419,900
2
bds
|
2
ba
|
1,191
sqft
|
built
1928
730 Stinson Blvd, Minneapolis, MN 55413
$-1,363
Cash flow
-16.9%
Cash-on-Cash Return
1.8%
Cap rate
0.7%
Rent to Value Ratio
Active
$410,000
4
bds
|
2
ba
|
1,637
sqft
|
built
1948
5744 23rd Ave S, Minneapolis, MN 55417
$-535
Cash flow
-6.8%
Cash-on-Cash Return
4.1%
Cap rate
0.7%
Rent to Value Ratio
Active
$599,900
4
bds
|
2
ba
|
2,552
sqft
|
built
1924
5000 Newton Ave S, Minneapolis, MN 55419
$-1,847
Cash flow
-16.1%
Cash-on-Cash Return
2.0%
Cap rate
0.5%
Rent to Value Ratio

Active
$2,595,000
5
bds
|
5
ba
|
5,414
sqft
|
built
2014
5516 Chantrey Rd, Edina, MN 55436
$-7,940
Cash flow
-16.0%
Cash-on-Cash Return
2.0%
Cap rate
0.3%
Rent to Value Ratio
Active
$325,000
3
bds
|
1
ba
|
2,123
sqft
|
built
1960
3465 5th St NE, Minneapolis, MN 55418
$-278
Cash flow
-4.5%
Cash-on-Cash Return
4.7%
Cap rate
0.7%
Rent to Value Ratio
Active
$600,000
4
bds
|
2
ba
|
2,300
sqft
|
built
1911
928 Franklin Ter, Minneapolis, MN 55406
$-2,093
Cash flow
-18.2%
Cash-on-Cash Return
2.1%
Cap rate
0.4%
Rent to Value Ratio
Active
$1,399,900
4
bds
|
5
ba
|
5,028
sqft
|
built
1960
6000 Arbour Ln, Edina, MN 55436
$-4,046
Cash flow
-15.1%
Cash-on-Cash Return
2.2%
Cap rate
0.4%
Rent to Value Ratio
Active
$1,475,000
4
bds
|
4
ba
|
4,394
sqft
|
built
2008
15719 Robinwood Dr, Minnetonka, MN 55345
$-3,010
Cash flow
-10.6%
Cash-on-Cash Return
3.2%
Cap rate
0.5%
Rent to Value Ratio
Active
$365,000
3
bds
|
1
ba
|
1,288
sqft
|
built
1982
3615 Mc Kinley St NE, Minneapolis, MN 55418
$136
Cash flow
1.9%
Cash-on-Cash Return
6.1%
Cap rate
0.7%
Rent to Value Ratio

Active
$1,295,000
8
bds
|
7
ba
|
6,500
sqft
|
built
2003
20090 Hunters Rdg, Rogers, MN 55374
$-4,017
Cash flow
-16.2%
Cash-on-Cash Return
2.0%
Cap rate
0.4%
Rent to Value Ratio
Active
$299,000
4
bds
|
2
ba
|
1,440
sqft
|
built
1977
4650 Russell Ave N, Minneapolis, MN 55412
$-341
Cash flow
-6.0%
Cash-on-Cash Return
4.3%
Cap rate
0.7%
Rent to Value Ratio
Active
$419,000
7
bds
|
2
ba
|
2,486
sqft
|
built
1890
3208 Pleasant Ave, Minneapolis, MN 55408
$-1,170
Cash flow
-14.6%
Cash-on-Cash Return
2.3%
Cap rate
0.5%
Rent to Value Ratio
Active
$749,900
5
bds
|
2
ba
|
2,833
sqft
|
built
1913
2213 Nicollet Ave, Minneapolis, MN 55404
$-2,422
Cash flow
-16.9%
Cash-on-Cash Return
2.4%
Cap rate
0.4%
Rent to Value Ratio
Active
$539,900
5
bds
|
4
ba
|
3,068
sqft
|
built
2006
10026 Scott Ave N, Minneapolis, MN 55443
$-755
Cash flow
-7.3%
Cash-on-Cash Return
4.0%
Cap rate
0.7%
Rent to Value Ratio
Active
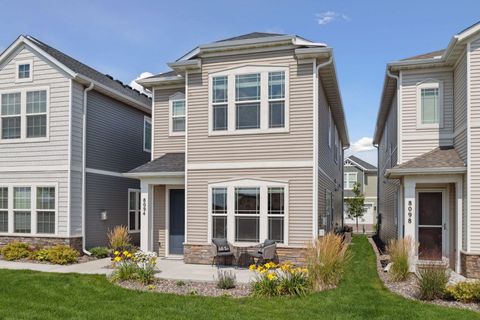
$435,000
3
bds
|
3
ba
|
1,896
sqft
|
built
2020
8094 Arrowwood Ln N, Maple Grove, MN 55369
$-806
Cash flow
-9.7%
Cash-on-Cash Return
3.5%
Cap rate
0.6%
Rent to Value Ratio
Active
$1,399,900
4
bds
|
3
ba
|
2,957
sqft
|
built
2025
3909 W 54th St, Edina, MN 55424
$-3,814
Cash flow
-14.2%
Cash-on-Cash Return
2.4%
Cap rate
0.4%
Rent to Value Ratio
Active
$325,000
3
bds
|
2
ba
|
1,593
sqft
|
built
1977
1613 Lyn Curve Ave N, Minneapolis, MN 55411
$-134
Cash flow
-2.2%
Cash-on-Cash Return
5.2%
Cap rate
0.8%
Rent to Value Ratio

Active
$478,000
3
bds
|
2
ba
|
2,810
sqft
|
built
1931
4218 Washburn Ave N, Minneapolis, MN 55412
$-797
Cash flow
-8.7%
Cash-on-Cash Return
3.7%
Cap rate
0.6%
Rent to Value Ratio

Active
$525,000
8
bds
|
3
ba
|
3,000
sqft
|
built
1886
3148 Pleasant Ave, Minneapolis, MN 55408
$-1,619
Cash flow
-16.1%
Cash-on-Cash Return
2.0%
Cap rate
0.4%
Rent to Value Ratio
Active
$229,900
2
bds
|
1
ba
|
1,050
sqft
|
built
1929
4234 Upton Ave N, Minneapolis, MN 55412
$232
Cash flow
5.3%
Cash-on-Cash Return
6.9%
Cap rate
1.0%
Rent to Value Ratio
Active
$198,900
3
bds
|
1
ba
|
890
sqft
|
built
1945
3420 Major Ave N, Minneapolis, MN 55422
$209
Cash flow
5.5%
Cash-on-Cash Return
6.9%
Cap rate
1.0%
Rent to Value Ratio

Active
$430,000
4
bds
|
3
ba
|
2,466
sqft
|
built
1973
1801 Winnetka Ave N, Minneapolis, MN 55427
$-510
Cash flow
-6.2%
Cash-on-Cash Return
4.3%
Cap rate
0.7%
Rent to Value Ratio
Active
$550,000
4
bds
|
2
ba
|
2,128
sqft
|
built
1959
8 Queen Ave S, Minneapolis, MN 55405
$-188
Cash flow
-1.8%
Cash-on-Cash Return
5.3%
Cap rate
0.6%
Rent to Value Ratio

Active
$365,000
3
bds
|
2
ba
|
1,313
sqft
|
built
1926
3246 Washburn Ave N, Minneapolis, MN 55412
$-711
Cash flow
-10.2%
Cash-on-Cash Return
3.3%
Cap rate
0.5%
Rent to Value Ratio