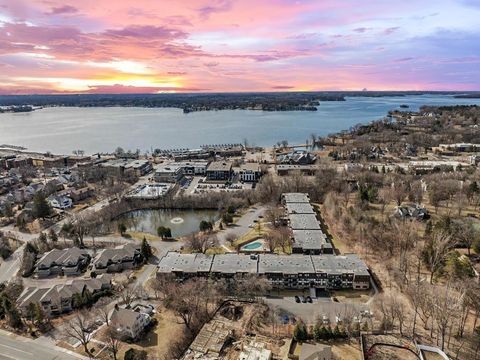
Hennepin County Investment Properties for Sale
Browse homes for sale and investment properties in Hennepin County. Refine your search by price, property type, or more.
Best cash flowing properties in Hennepin County
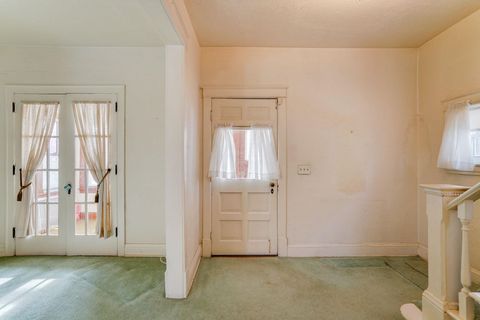
Active
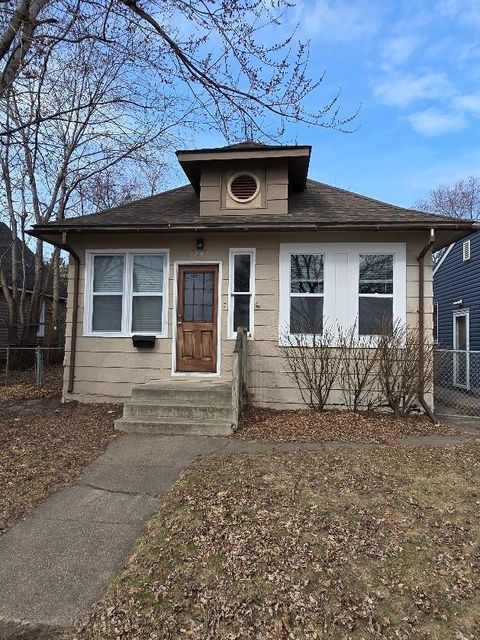
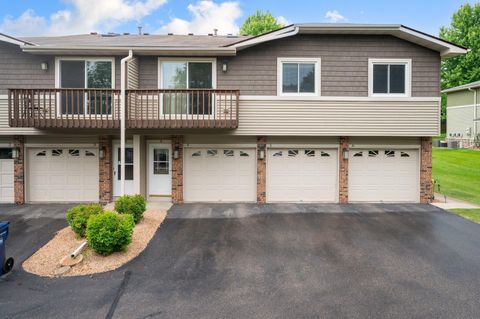
$174,900
2
bds
|
1
ba
|
1,330
sqft
|
built
1912
3543 N 3rd St, Minneapolis, MN 55412
$279
Cash flow
8.3%
Cash-on-Cash Return
7.6%
Cap rate
1.0%
Rent to Value Ratio
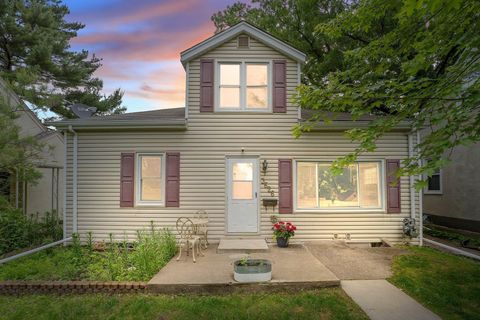
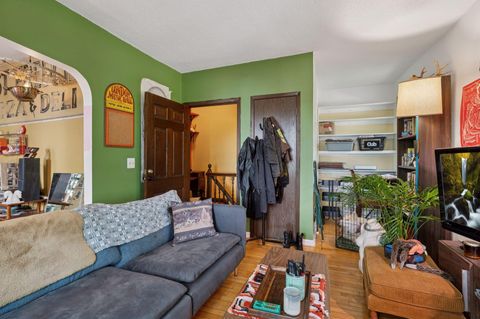
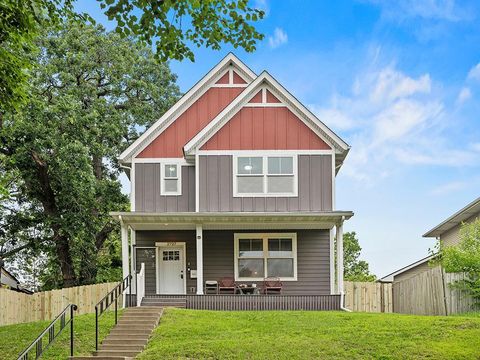
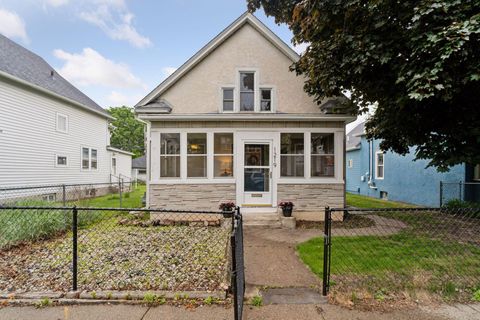
Active
$230,000
3
bds
|
1
ba
|
1,082
sqft
|
built
1924
3626 Washburn Ave N, Minneapolis, MN 55412
$177
Cash flow
4.0%
Cash-on-Cash Return
6.6%
Cap rate
1.0%
Rent to Value Ratio
1,898 out of 3,276 properties for sale in Hennepin County
Limited Results Shown
Create a free account, or log in to reveal all property listings and enjoy the complete experience.
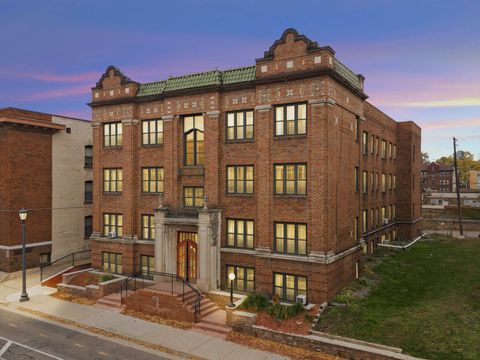
Active
$85,000
1
bds
|
1
ba
|
525
sqft
|
built
1925
1820 1st Ave S, Minneapolis, MN 55403
$-143
Cash flow
-8.8%
Cash-on-Cash Return
3.7%
Cap rate
1.3%
Rent to Value Ratio

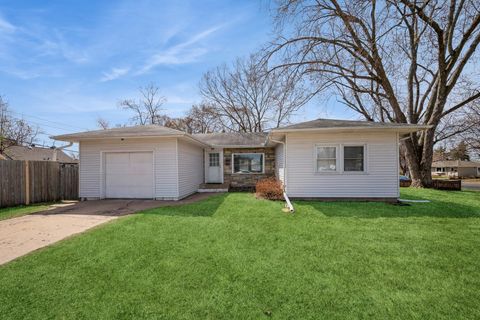
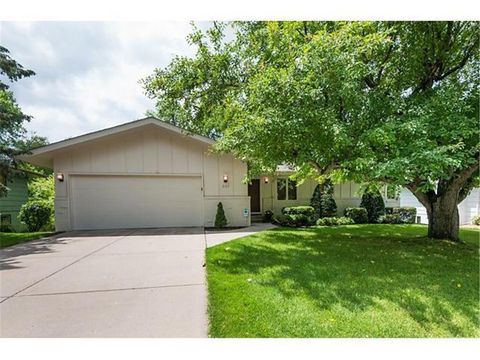
Active
$284,900
3
bds
|
2
ba
|
2,514
sqft
|
built
1950
8235 Nicollet Ave S, Bloomington, MN 55420
$52
Cash flow
1.0%
Cash-on-Cash Return
5.9%
Cap rate
0.9%
Rent to Value Ratio

Active
$550,000
3
bds
|
3
ba
|
2,326
sqft
|
built
1928
300 E Diamond Lake Rd, Minneapolis, MN 55419
$-935
Cash flow
-8.9%
Cash-on-Cash Return
3.6%
Cap rate
0.6%
Rent to Value Ratio
Active
$299,900
3
bds
|
2
ba
|
1,631
sqft
|
built
1947
8501 Blaisdell Ave S, Minneapolis, MN 55420
$71
Cash flow
1.2%
Cash-on-Cash Return
6.0%
Cap rate
0.9%
Rent to Value Ratio
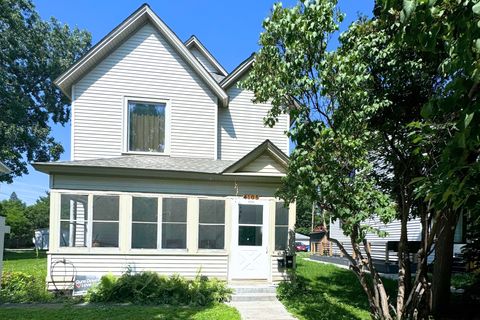
Active
$324,900
3
bds
|
2
ba
|
2,079
sqft
|
built
1895
4105 Colfax Ave N, Minneapolis, MN 55412
$-473
Cash flow
-7.6%
Cash-on-Cash Return
3.9%
Cap rate
0.6%
Rent to Value Ratio
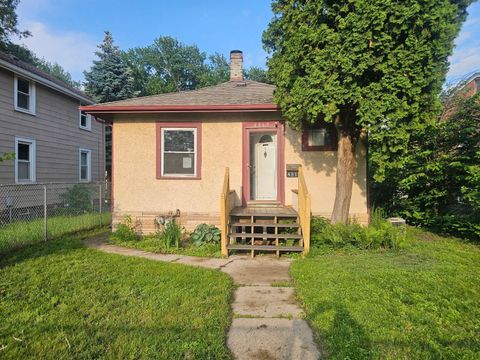
Active
$100,000
0
bds
|
1
ba
|
437
sqft
|
built
1982
431 S 7th St, Minneapolis, MN 55415
$-356
Cash flow
-18.6%
Cash-on-Cash Return
1.4%
Cap rate
1.1%
Rent to Value Ratio
Active
$439,900
4
bds
|
2
ba
|
1,552
sqft
|
built
1912
29 Van Buren Ave S, Hopkins, MN 55343
$-730
Cash flow
-8.7%
Cash-on-Cash Return
3.7%
Cap rate
0.6%
Rent to Value Ratio
Active
$169,900
2
bds
|
1
ba
|
828
sqft
|
built
1909
2604 Oliver Ave N, Minneapolis, MN 55411
$153
Cash flow
4.7%
Cash-on-Cash Return
6.8%
Cap rate
0.9%
Rent to Value Ratio
Active
$279,000
3
bds
|
1
ba
|
1,084
sqft
|
built
1923
4517 4th Ave S, Minneapolis, MN 55419
$-675
Cash flow
-12.6%
Cash-on-Cash Return
2.8%
Cap rate
0.5%
Rent to Value Ratio
Active
$825,000
4
bds
|
3
ba
|
3,160
sqft
|
built
1955
5157 Abercrombie Dr, Edina, MN 55439
$-2,107
Cash flow
-13.3%
Cash-on-Cash Return
2.6%
Cap rate
0.4%
Rent to Value Ratio
Active
$410,000
4
bds
|
2
ba
|
1,760
sqft
|
built
1900
2420 25th Ave S, Minneapolis, MN 55406
$-1,058
Cash flow
-13.5%
Cash-on-Cash Return
2.6%
Cap rate
0.5%
Rent to Value Ratio
Active
$230,000
4
bds
|
2
ba
|
1,532
sqft
|
built
1933
1802 3rd Ave N, Minneapolis, MN 55405
$-24
Cash flow
-0.5%
Cash-on-Cash Return
5.6%
Cap rate
0.9%
Rent to Value Ratio

Active
$289,900
2
bds
|
1
ba
|
980
sqft
|
built
1965
5410 Three Points Blvd, Mound, MN 55364
$-1,091
Cash flow
-19.6%
Cash-on-Cash Return
1.2%
Cap rate
0.6%
Rent to Value Ratio
Active
$215,000
1
bds
|
1
ba
|
724
sqft
|
built
1970
205 Barry Ave S, Wayzata, MN 55391
$-530
Cash flow
-12.9%
Cash-on-Cash Return
2.7%
Cap rate
0.7%
Rent to Value Ratio

Active
$760,000
4
bds
|
4
ba
|
2,453
sqft
|
built
1941
3909 Xerxes Ave S, Minneapolis, MN 55410
$-3,025
Cash flow
-20.8%
Cash-on-Cash Return
0.9%
Cap rate
0.3%
Rent to Value Ratio
Active
$189,900
2
bds
|
1
ba
|
1,050
sqft
|
built
1990
14205 44th Pl N, Plymouth, MN 55446
$-325
Cash flow
-8.9%
Cash-on-Cash Return
3.6%
Cap rate
0.8%
Rent to Value Ratio
Active
$1,995,000
5
bds
|
5
ba
|
4,179
sqft
|
built
2015
4043 Abbott Ave S, Minneapolis, MN 55410
$-5,629
Cash flow
-14.7%
Cash-on-Cash Return
2.3%
Cap rate
0.5%
Rent to Value Ratio

Active
$849,000
3
bds
|
3
ba
|
3,799
sqft
|
built
1990
3520 Fairway Ln, Minnetonka, MN 55305
$-2,221
Cash flow
-13.6%
Cash-on-Cash Return
2.5%
Cap rate
0.5%
Rent to Value Ratio
Active
$325,000
3
bds
|
2
ba
|
1,856
sqft
|
built
2015
2727 N 3rd St, Minneapolis, MN 55411
$11
Cash flow
0.2%
Cash-on-Cash Return
5.7%
Cap rate
0.9%
Rent to Value Ratio
Active
$3,895,000
4
bds
|
5
ba
|
6,869
sqft
|
built
1922
2119 E Lake Of The Isles Pkwy, Minneapolis, MN 55405
$-15,869
Cash flow
-21.3%
Cash-on-Cash Return
0.8%
Cap rate
0.3%
Rent to Value Ratio

Active
$179,000
2
bds
|
1
ba
|
985
sqft
|
built
1927
215 7th St NE, Minneapolis, MN 55413
$-1,010
Cash flow
-29.4%
Cash-on-Cash Return
-1.1%
Cap rate
0.8%
Rent to Value Ratio

Active
$185,000
1
bds
|
1
ba
|
759
sqft
|
built
1981
2030 Ridge Dr, Saint Louis Park, MN 55416
$-400
Cash flow
-11.3%
Cash-on-Cash Return
3.1%
Cap rate
0.9%
Rent to Value Ratio
Active
$199,500
2
bds
|
1
ba
|
1,156
sqft
|
built
1917
3306 Humboldt Ave N, Minneapolis, MN 55412
$116
Cash flow
3.0%
Cash-on-Cash Return
7.0%
Cap rate
1.0%
Rent to Value Ratio
Active
$1,399,900
4
bds
|
5
ba
|
4,233
sqft
|
built
2020
212 Oliver Ave S, Minneapolis, MN 55405
$-5,343
Cash flow
-19.9%
Cash-on-Cash Return
1.1%
Cap rate
0.3%
Rent to Value Ratio
Active
$415,000
4
bds
|
2
ba
|
1,868
sqft
|
built
1962
8307 Johnson Ave S, Bloomington, MN 55437
$-417
Cash flow
-5.2%
Cash-on-Cash Return
4.5%
Cap rate
0.7%
Rent to Value Ratio
Active
$269,900
3
bds
|
2
ba
|
1,505
sqft
|
built
2004
10787 Unity Ln N, Minneapolis, MN 55443
$-426
Cash flow
-8.2%
Cash-on-Cash Return
3.8%
Cap rate
0.8%
Rent to Value Ratio
Active
$350,000
4
bds
|
3
ba
|
1,970
sqft
|
built
1923
3633 15th Ave S, Minneapolis, MN 55407
$-97
Cash flow
-1.4%
Cash-on-Cash Return
5.3%
Cap rate
0.8%
Rent to Value Ratio
Active
$230,000
3
bds
|
1
ba
|
1,082
sqft
|
built
1924
3626 Washburn Ave N, Minneapolis, MN 55412
$177
Cash flow
4.0%
Cash-on-Cash Return
6.6%
Cap rate
1.0%
Rent to Value Ratio
Active
$530,000
3
bds
|
2
ba
|
1,873
sqft
|
built
1952
5644 Upton Ave S, Minneapolis, MN 55410
$-1,720
Cash flow
-16.9%
Cash-on-Cash Return
2.4%
Cap rate
0.4%
Rent to Value Ratio
Active
$430,000
2
bds
|
2
ba
|
1,186
sqft
|
built
2006
215 10th Ave S, Minneapolis, MN 55415
$-982
Cash flow
-11.9%
Cash-on-Cash Return
2.9%
Cap rate
0.7%
Rent to Value Ratio
Active
$174,900
2
bds
|
1
ba
|
1,330
sqft
|
built
1912
3543 N 3rd St, Minneapolis, MN 55412
$279
Cash flow
8.3%
Cash-on-Cash Return
7.6%
Cap rate
1.0%
Rent to Value Ratio
Active
$389,000
4
bds
|
2
ba
|
1,824
sqft
|
built
1900
804 26th Ave NE, Minneapolis, MN 55418
$-1,165
Cash flow
-15.6%
Cash-on-Cash Return
2.1%
Cap rate
0.4%
Rent to Value Ratio
Active
$299,900
4
bds
|
2
ba
|
2,000
sqft
|
built
1941
1500 Upton Ave N, Minneapolis, MN 55411
$-269
Cash flow
-4.7%
Cash-on-Cash Return
5.2%
Cap rate
0.8%
Rent to Value Ratio

Active
$374,900
3
bds
|
2
ba
|
1,576
sqft
|
built
1949
2804 Utica Ave S, Saint Louis Park, MN 55416
$-109
Cash flow
-1.5%
Cash-on-Cash Return
5.3%
Cap rate
0.8%
Rent to Value Ratio
Active
$350,000
3
bds
|
2
ba
|
1,134
sqft
|
built
1907
1219 6th St NE, Minneapolis, MN 55413
$-237
Cash flow
-3.5%
Cash-on-Cash Return
4.9%
Cap rate
0.7%
Rent to Value Ratio
Active
$674,900
3
bds
|
2
ba
|
2,163
sqft
|
built
1925
4848 Ewing Ave S, Minneapolis, MN 55410
$-1,191
Cash flow
-9.2%
Cash-on-Cash Return
3.6%
Cap rate
0.6%
Rent to Value Ratio
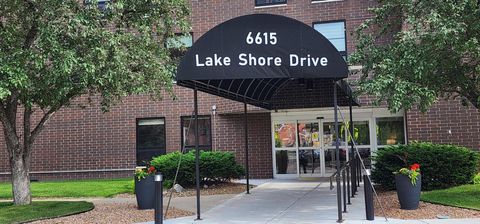
Active
$259,500
2
bds
|
2
ba
|
1,190
sqft
|
built
1983
6615 Lake Shore Dr S, Minneapolis, MN 55423
$-904
Cash flow
-18.2%
Cash-on-Cash Return
1.5%
Cap rate
0.8%
Rent to Value Ratio
Active
$374,900
3
bds
|
2
ba
|
1,641
sqft
|
built
1955
401 Plymouth Rd, Minnetonka, MN 55305
$27
Cash flow
0.4%
Cash-on-Cash Return
5.8%
Cap rate
0.8%
Rent to Value Ratio

Active
$1,500,000
2
bds
|
2
ba
|
1,643
sqft
|
built
1915
525 3rd St N, Minneapolis, MN 55401
$-5,609
Cash flow
-19.5%
Cash-on-Cash Return
1.2%
Cap rate
0.3%
Rent to Value Ratio

Active
$529,900
3
bds
|
2
ba
|
1,650
sqft
|
built
1925
5320 40th Ave S, Minneapolis, MN 55417
$-1,007
Cash flow
-9.9%
Cash-on-Cash Return
3.4%
Cap rate
0.5%
Rent to Value Ratio