Hennepin County Investment Properties for Sale
Browse homes for sale and investment properties in Hennepin County. Refine your search by price, property type, or more.
Best cash flowing properties in Hennepin County
Active
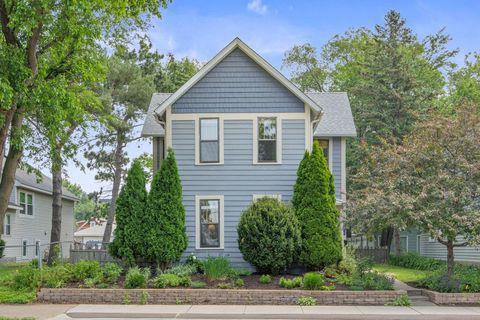
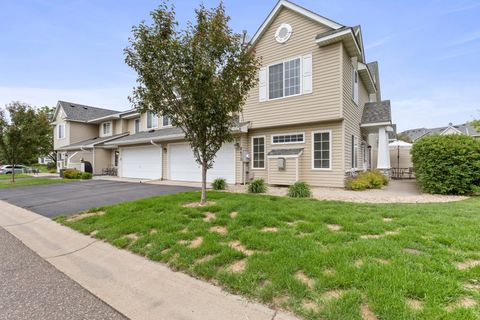
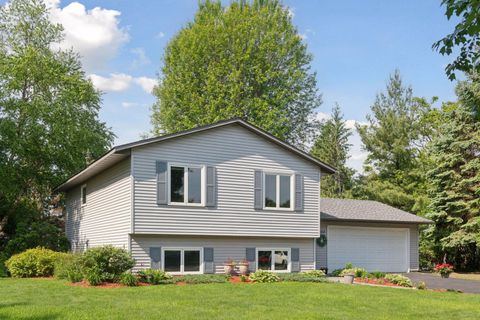
$359,900
3
bds
|
2
ba
|
1,688
sqft
|
built
1900
2315 Marshall St NE, Minneapolis, MN 55418
$366
Cash flow
5.3%
Cash-on-Cash Return
6.9%
Cap rate
1.0%
Rent to Value Ratio
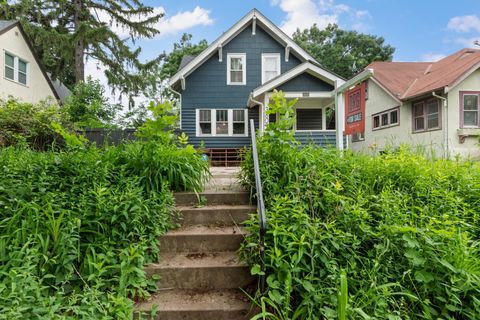
Active
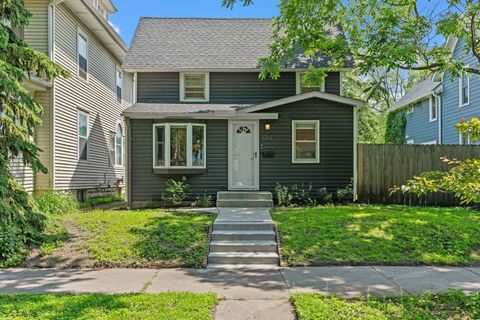
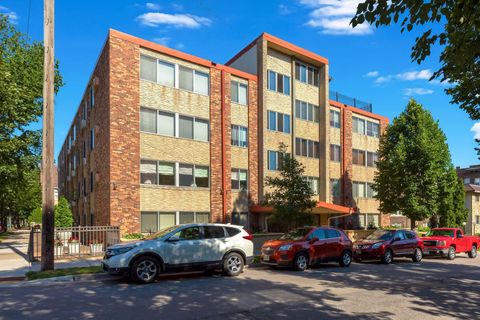
$260,000
3
bds
|
1
ba
|
1,300
sqft
|
built
1914
3609 Newton Ave N, Minneapolis, MN 55412
$247
Cash flow
5.0%
Cash-on-Cash Return
6.8%
Cap rate
1.0%
Rent to Value Ratio
1,898 out of 3,276 properties for sale in Hennepin County
Limited Results Shown
Create a free account, or log in to reveal all property listings and enjoy the complete experience.
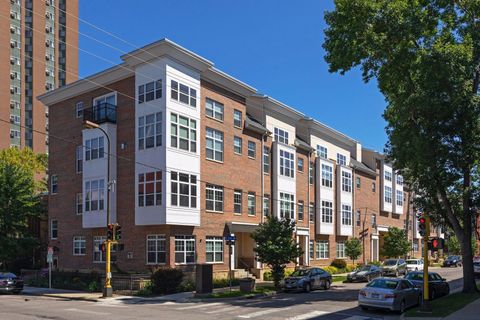
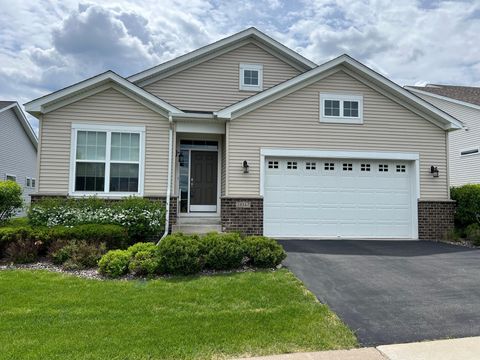
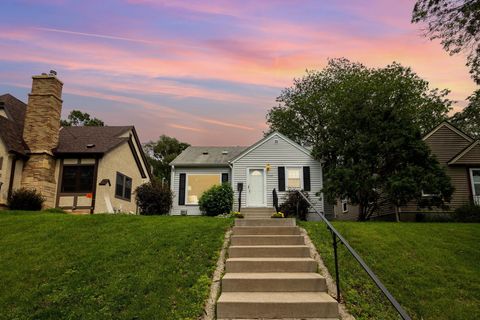
Active
$209,900
1
bds
|
1
ba
|
840
sqft
|
built
2004
308 E 18th St, Minneapolis, MN 55404
$-468
Cash flow
-11.6%
Cash-on-Cash Return
3.0%
Cap rate
0.8%
Rent to Value Ratio
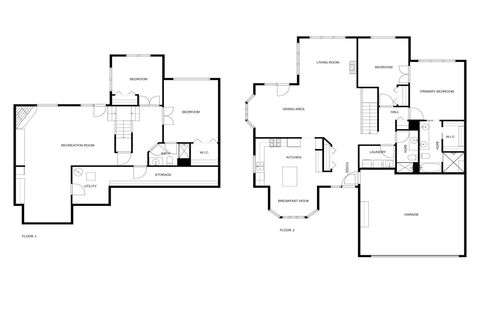
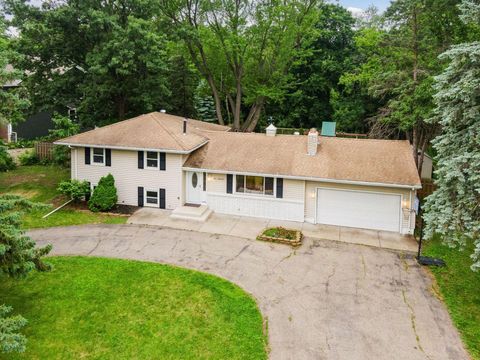
Active
$230,000
1
bds
|
1
ba
|
672
sqft
|
built
1910
250 Park Ave, Minneapolis, MN 55415
$-811
Cash flow
-18.4%
Cash-on-Cash Return
1.4%
Cap rate
0.8%
Rent to Value Ratio
Active
$515,000
4
bds
|
3
ba
|
2,895
sqft
|
built
1994
11617 88th Pl N, Maple Grove, MN 55369
$-1,261
Cash flow
-12.8%
Cash-on-Cash Return
2.7%
Cap rate
0.6%
Rent to Value Ratio
Active
$275,000
2
bds
|
2
ba
|
1,530
sqft
|
built
2003
8475 121st Ave N, Champlin, MN 55316
$-402
Cash flow
-7.6%
Cash-on-Cash Return
3.9%
Cap rate
0.7%
Rent to Value Ratio

Active
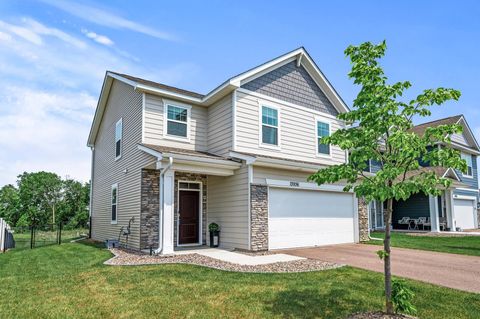
$585,000
4
bds
|
3
ba
|
3,002
sqft
|
built
2002
13996 Hollyhock Ln, Rogers, MN 55374
$-964
Cash flow
-8.6%
Cash-on-Cash Return
3.7%
Cap rate
0.6%
Rent to Value Ratio
Active
$385,000
2
bds
|
2
ba
|
1,393
sqft
|
built
1900
649 Van Buren St NE, Minneapolis, MN 55413
$-427
Cash flow
-5.8%
Cash-on-Cash Return
4.3%
Cap rate
0.6%
Rent to Value Ratio
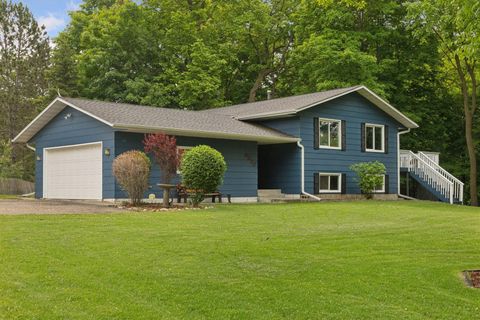
Active
$309,900
3
bds
|
2
ba
|
1,788
sqft
|
built
1983
6007 Covington Ter, Minnetonka, MN 55345
$-583
Cash flow
-9.8%
Cash-on-Cash Return
3.4%
Cap rate
0.7%
Rent to Value Ratio

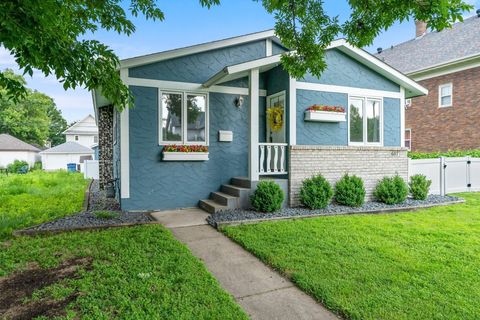
Active
$309,000
3
bds
|
2
ba
|
1,100
sqft
|
built
1941
5724 Sunset Rd, Mound, MN 55364
$-176
Cash flow
-3.0%
Cash-on-Cash Return
5.0%
Cap rate
0.7%
Rent to Value Ratio

Active
$165,000
1
bds
|
1
ba
|
810
sqft
|
built
1972
7510 Cahill Rd, Edina, MN 55439
$-533
Cash flow
-16.9%
Cash-on-Cash Return
1.8%
Cap rate
1.0%
Rent to Value Ratio
Active
$550,000
2
bds
|
2
ba
|
1,917
sqft
|
built
2015
18147 73rd Pl N, Maple Grove, MN 55311
$-1,076
Cash flow
-10.2%
Cash-on-Cash Return
3.3%
Cap rate
0.6%
Rent to Value Ratio
Active
$439,900
4
bds
|
2
ba
|
1,677
sqft
|
built
1980
10464 Devonshire Pl, Eden Prairie, MN 55347
$-526
Cash flow
-6.2%
Cash-on-Cash Return
4.2%
Cap rate
0.6%
Rent to Value Ratio

Active
$1,875,000
5
bds
|
5
ba
|
4,258
sqft
|
built
2021
4324 Oakdale Ave S, Edina, MN 55424
$-7,460
Cash flow
-20.8%
Cash-on-Cash Return
0.9%
Cap rate
0.3%
Rent to Value Ratio

Active
$750,000
6
bds
|
3
ba
|
3,091
sqft
|
built
1955
5209 W 61st St, Edina, MN 55436
$-1,776
Cash flow
-12.4%
Cash-on-Cash Return
2.8%
Cap rate
0.5%
Rent to Value Ratio
Active
$260,000
3
bds
|
1
ba
|
1,300
sqft
|
built
1914
3609 Newton Ave N, Minneapolis, MN 55412
$247
Cash flow
5.0%
Cash-on-Cash Return
6.8%
Cap rate
1.0%
Rent to Value Ratio
Active
$179,900
1
bds
|
1
ba
|
781
sqft
|
built
1964
1901 Emerson Ave S, Minneapolis, MN 55403
$-365
Cash flow
-10.6%
Cash-on-Cash Return
3.2%
Cap rate
0.9%
Rent to Value Ratio
Active
$399,000
3
bds
|
2
ba
|
1,651
sqft
|
built
1949
5155 Elliot Ave, Minneapolis, MN 55417
$-162
Cash flow
-2.1%
Cash-on-Cash Return
5.2%
Cap rate
0.8%
Rent to Value Ratio

Active
$425,000
4
bds
|
2
ba
|
2,004
sqft
|
built
1930
6049 Wentworth Ave, Minneapolis, MN 55419
$-334
Cash flow
-4.1%
Cash-on-Cash Return
4.7%
Cap rate
0.7%
Rent to Value Ratio
Active
$510,000
4
bds
|
2
ba
|
2,170
sqft
|
built
1959
4000 Auburn Dr, Minnetonka, MN 55305
$-439
Cash flow
-4.5%
Cash-on-Cash Return
4.6%
Cap rate
0.7%
Rent to Value Ratio
Active
$275,000
2
bds
|
2
ba
|
1,397
sqft
|
built
2002
13872 52nd Ave N, Minneapolis, MN 55446
$-380
Cash flow
-7.2%
Cash-on-Cash Return
4.0%
Cap rate
0.8%
Rent to Value Ratio

Active
$1,685,000
4
bds
|
4
ba
|
4,141
sqft
|
built
1990
6141 Sherman Cir, Edina, MN 55436
$-6,355
Cash flow
-19.7%
Cash-on-Cash Return
1.2%
Cap rate
0.2%
Rent to Value Ratio

Active
$299,000
3
bds
|
3
ba
|
1,269
sqft
|
built
1981
3625 Gettysburg Ave S, Saint Louis Park, MN 55426
$-583
Cash flow
-10.2%
Cash-on-Cash Return
3.3%
Cap rate
0.7%
Rent to Value Ratio
Active
$369,850
3
bds
|
2
ba
|
1,446
sqft
|
built
1949
5211 31st Ave S, Minneapolis, MN 55417
$-410
Cash flow
-5.8%
Cash-on-Cash Return
4.3%
Cap rate
0.7%
Rent to Value Ratio
Active
$1,675,000
4
bds
|
3
ba
|
2,856
sqft
|
built
1980
1749 Avocet Ln, Mound, MN 55364
$-5,863
Cash flow
-18.3%
Cash-on-Cash Return
1.5%
Cap rate
0.3%
Rent to Value Ratio
Active
$1,179,000
5
bds
|
4
ba
|
6,004
sqft
|
built
1988
10481 Bluff Rd, Eden Prairie, MN 55347
$-3,197
Cash flow
-14.1%
Cash-on-Cash Return
2.4%
Cap rate
0.4%
Rent to Value Ratio
Active
$419,900
3
bds
|
3
ba
|
1,763
sqft
|
built
2022
13936 146th Ave N, Dayton, MN 55327
$-252
Cash flow
-3.1%
Cash-on-Cash Return
5.0%
Cap rate
0.7%
Rent to Value Ratio

Active
$429,900
5
bds
|
2
ba
|
1,862
sqft
|
built
1956
1841 Pennsylvania Ave S, Saint Louis Park, MN 55426
$-95
Cash flow
-1.2%
Cash-on-Cash Return
5.4%
Cap rate
0.8%
Rent to Value Ratio
Active
$599,900
4
bds
|
3
ba
|
2,164
sqft
|
built
1972
6230 Lake Sarah Heights Dr, Rockford, MN 55373
$-1,101
Cash flow
-9.6%
Cash-on-Cash Return
3.5%
Cap rate
0.5%
Rent to Value Ratio
Active
$359,900
3
bds
|
2
ba
|
1,688
sqft
|
built
1900
2315 Marshall St NE, Minneapolis, MN 55418
$366
Cash flow
5.3%
Cash-on-Cash Return
6.9%
Cap rate
1.0%
Rent to Value Ratio
Active
$475,000
4
bds
|
2
ba
|
2,306
sqft
|
built
1974
607 Adams St NE, Minneapolis, MN 55413
$-618
Cash flow
-6.8%
Cash-on-Cash Return
4.1%
Cap rate
0.7%
Rent to Value Ratio
Active
$1,295,000
5
bds
|
5
ba
|
4,974
sqft
|
built
1999
4266 Manor Court Rd, Minnetonka, MN 55345
$-3,097
Cash flow
-12.5%
Cash-on-Cash Return
2.8%
Cap rate
0.5%
Rent to Value Ratio
Active
$425,000
4
bds
|
2
ba
|
1,686
sqft
|
built
1900
2307 22nd Ave S, Minneapolis, MN 55404
$-1,189
Cash flow
-14.6%
Cash-on-Cash Return
2.3%
Cap rate
0.5%
Rent to Value Ratio
Active
$737,500
4
bds
|
4
ba
|
4,798
sqft
|
built
2004
1376 Cobblestone Rd N, Champlin, MN 55316
$-1,539
Cash flow
-10.9%
Cash-on-Cash Return
3.2%
Cap rate
0.5%
Rent to Value Ratio
Active
$1,450,000
4
bds
|
4
ba
|
4,125
sqft
|
built
2020
16907 Valley Rd, Eden Prairie, MN 55347
$-5,975
Cash flow
-21.5%
Cash-on-Cash Return
0.7%
Cap rate
0.2%
Rent to Value Ratio

Active
$2,893,716
5
bds
|
5
ba
|
6,165
sqft
|
built
2024
5316 Highwood Dr W, Edina, MN 55436
$-8,242
Cash flow
-14.9%
Cash-on-Cash Return
2.3%
Cap rate
0.3%
Rent to Value Ratio
Active
$499,000
3
bds
|
2
ba
|
2,100
sqft
|
built
1972
2710 Garden Ln, Mound, MN 55364
$-445
Cash flow
-4.7%
Cash-on-Cash Return
4.6%
Cap rate
0.6%
Rent to Value Ratio
Active
$897,250
4
bds
|
4
ba
|
3,127
sqft
|
built
2025
5043 42nd Ave S, Minneapolis, MN 55417
$-1,781
Cash flow
-10.4%
Cash-on-Cash Return
3.3%
Cap rate
0.4%
Rent to Value Ratio
Active
$294,500
2
bds
|
2
ba
|
1,390
sqft
|
built
2006
17790 66th Ave N, Maple Grove, MN 55311
$-398
Cash flow
-7.1%
Cash-on-Cash Return
4.1%
Cap rate
0.8%
Rent to Value Ratio
Active
$219,000
2
bds
|
1
ba
|
984
sqft
|
built
2004
111 E Franklin Ave, Minneapolis, MN 55404
$-725
Cash flow
-17.3%
Cash-on-Cash Return
1.7%
Cap rate
0.8%
Rent to Value Ratio
Active
$475,000
5
bds
|
4
ba
|
3,200
sqft
|
built
1887
1601 Park Ave, Minneapolis, MN 55404
$-294
Cash flow
-3.2%
Cash-on-Cash Return
4.9%
Cap rate
0.8%
Rent to Value Ratio
Active
$449,900
3
bds
|
2
ba
|
1,911
sqft
|
built
1940
632 Morgan Ave S, Minneapolis, MN 55405
$-753
Cash flow
-8.7%
Cash-on-Cash Return
3.7%
Cap rate
0.6%
Rent to Value Ratio