Hennepin County Investment Properties for Sale
Browse homes for sale and investment properties in Hennepin County. Refine your search by price, property type, or more.
Best cash flowing properties in Hennepin County

Active
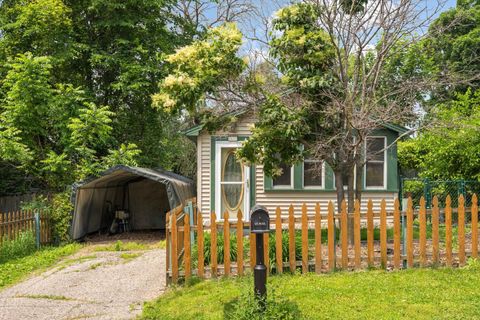
$224,900
4
bds
|
1
ba
|
1,248
sqft
|
built
1905
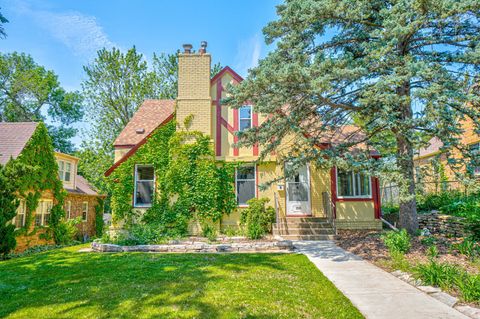
2806 Aldrich Ave N, Minneapolis, MN 55411
$384
Cash flow
8.9%
Cash-on-Cash Return
7.7%
Cap rate
1.1%
Rent to Value Ratio

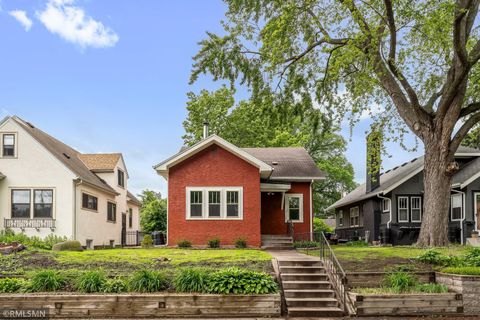
Active
$189,000
2
bds
|
2
ba
|
1,612
sqft
|
built
1927
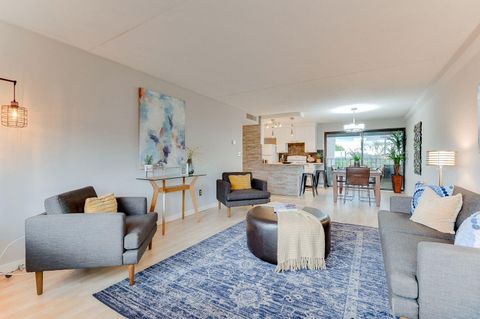
4516 5th Ave S, Minneapolis, MN 55419
$351
Cash flow
9.7%
Cash-on-Cash Return
7.9%
Cap rate
1.2%
Rent to Value Ratio
1,898 out of 3,276 properties for sale in Hennepin County
Limited Results Shown
Create a free account, or log in to reveal all property listings and enjoy the complete experience.
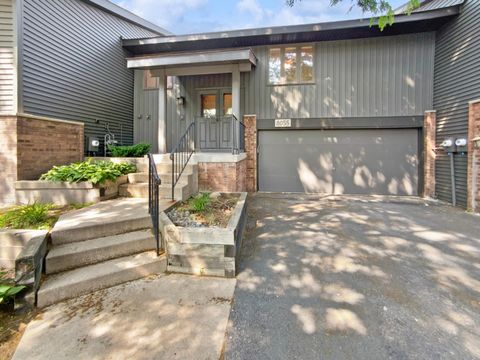
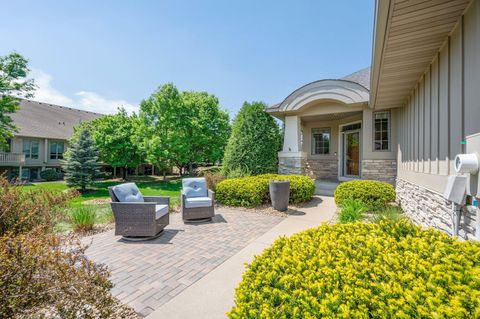
Active
$311,000
2
bds
|
2
ba
|
1,521
sqft
|
built
1978
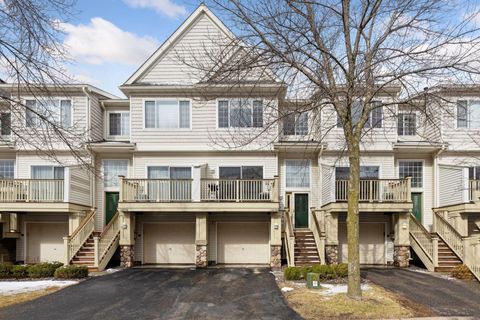
8055 Timber Lake Dr, Eden Prairie, MN 55347
$-529
Cash flow
-8.9%
Cash-on-Cash Return
3.6%
Cap rate
0.8%
Rent to Value Ratio
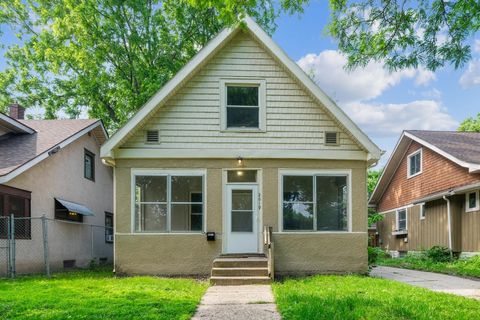
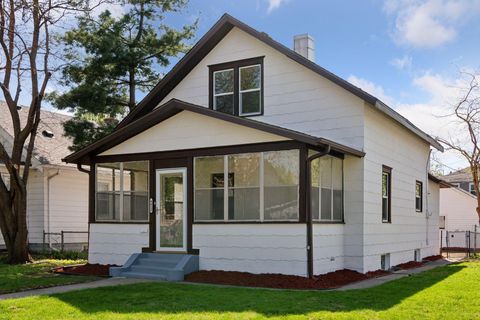
Active
$225,000
3
bds
|
1
ba
|
1,240
sqft
|
built
1909
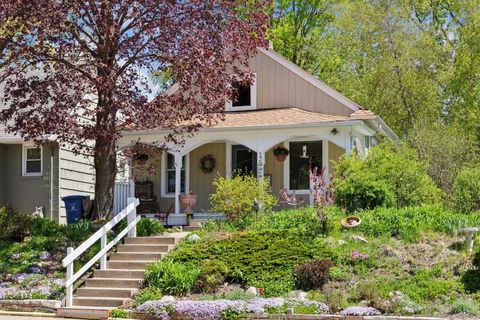
2619 23rd Ave N, Minneapolis, MN 55411
$242
Cash flow
5.6%
Cash-on-Cash Return
7.0%
Cap rate
1.0%
Rent to Value Ratio
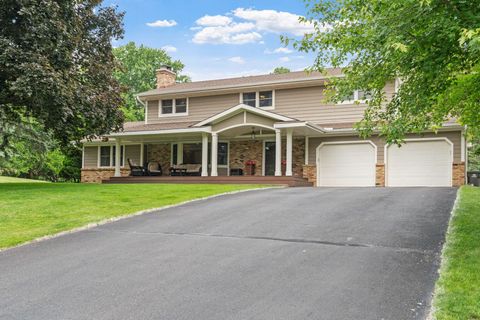
Active
$625,000
5
bds
|
4
ba
|
3,284
sqft
|
built
1966
6919 Rosemary Rd, Eden Prairie, MN 55346
$-1,103
Cash flow
-9.2%
Cash-on-Cash Return
3.6%
Cap rate
0.6%
Rent to Value Ratio
Active
$224,900
4
bds
|
1
ba
|
1,248
sqft
|
built
1905
2806 Aldrich Ave N, Minneapolis, MN 55411
$384
Cash flow
8.9%
Cash-on-Cash Return
7.7%
Cap rate
1.1%
Rent to Value Ratio
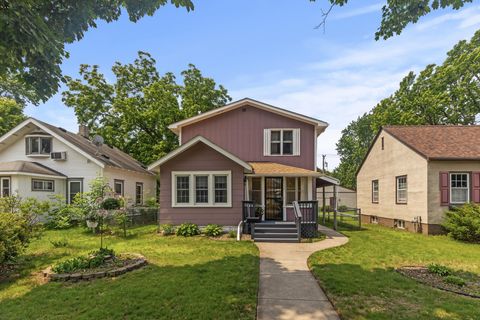
Active
$400,000
3
bds
|
2
ba
|
1,923
sqft
|
built
1927
5452 43rd Ave S, Minneapolis, MN 55417
$-531
Cash flow
-6.9%
Cash-on-Cash Return
4.1%
Cap rate
0.7%
Rent to Value Ratio
Active
$449,900
3
bds
|
2
ba
|
1,911
sqft
|
built
1940
632 Morgan Ave S, Minneapolis, MN 55405
$-753
Cash flow
-8.7%
Cash-on-Cash Return
3.7%
Cap rate
0.6%
Rent to Value Ratio
Active
$500,000
3
bds
|
2
ba
|
2,374
sqft
|
built
1949
5112 Willow Ln, Minnetonka, MN 55345
$-670
Cash flow
-7.0%
Cash-on-Cash Return
4.1%
Cap rate
0.6%
Rent to Value Ratio
Active
$269,000
2
bds
|
1
ba
|
925
sqft
|
built
1929
2742 Grand St NE, Minneapolis, MN 55418
$-321
Cash flow
-6.2%
Cash-on-Cash Return
4.2%
Cap rate
0.6%
Rent to Value Ratio
Active
$400,000
4
bds
|
2
ba
|
1,931
sqft
|
built
1967
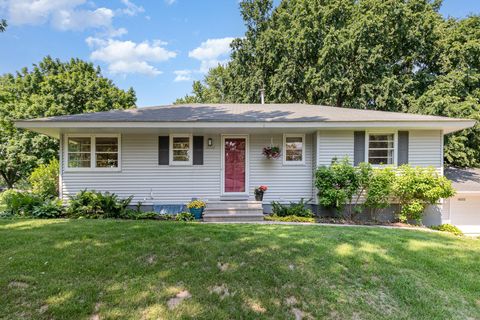
9320 Revere Ln N, Maple Grove, MN 55369
$-278
Cash flow
-3.6%
Cash-on-Cash Return
4.8%
Cap rate
0.7%
Rent to Value Ratio
Active
$125,000
2
bds
|
1
ba
|
1,026
sqft
|
built
1969
10301 Cedar Lake Rd, Minnetonka, MN 55305
$-176
Cash flow
-7.3%
Cash-on-Cash Return
4.0%
Cap rate
1.3%
Rent to Value Ratio
Active
$850,000
4
bds
|
2
ba
|
1,485
sqft
|
built
1890
6300 Painter Rd, Mound, MN 55364
$-2,687
Cash flow
-16.5%
Cash-on-Cash Return
1.9%
Cap rate
0.3%
Rent to Value Ratio
Active
$138,900
1
bds
|
1
ba
|
624
sqft
|
built
1969
4371 Wilshire Blvd, Mound, MN 55364
$-302
Cash flow
-11.3%
Cash-on-Cash Return
3.1%
Cap rate
0.9%
Rent to Value Ratio

Active
$525,000
5
bds
|
2
ba
|
1,840
sqft
|
built
1947
4109 W 84th St, Bloomington, MN 55437
$-1,101
Cash flow
-10.9%
Cash-on-Cash Return
3.2%
Cap rate
0.5%
Rent to Value Ratio
Active
$599,900
2
bds
|
2
ba
|
1,561
sqft
|
built
2007
3104 W Lake St, Minneapolis, MN 55416
$-2,305
Cash flow
-20.0%
Cash-on-Cash Return
1.1%
Cap rate
0.5%
Rent to Value Ratio
Active
$175,000
1
bds
|
1
ba
|
512
sqft
|
built
1920
1617 Gull Ln, Mound, MN 55364
$-99
Cash flow
-3.0%
Cash-on-Cash Return
5.0%
Cap rate
0.7%
Rent to Value Ratio
Active
$429,900
4
bds
|
2
ba
|
1,987
sqft
|
built
1923
5116 28th Ave S, Minneapolis, MN 55417
$-638
Cash flow
-7.7%
Cash-on-Cash Return
3.9%
Cap rate
0.6%
Rent to Value Ratio
Active
$329,000
2
bds
|
2
ba
|
1,042
sqft
|
built
1916
4412 44th Ave S, Minneapolis, MN 55406
$-590
Cash flow
-9.4%
Cash-on-Cash Return
3.5%
Cap rate
0.5%
Rent to Value Ratio
Active
$600,000
3
bds
|
3
ba
|
2,872
sqft
|
built
2005
17365 Hanson Ct, Eden Prairie, MN 55347
$-1,547
Cash flow
-13.5%
Cash-on-Cash Return
2.6%
Cap rate
0.6%
Rent to Value Ratio

Active
$780,000
3
bds
|
3
ba
|
1,792
sqft
|
built
1919
5318 Knox Ave S, Minneapolis, MN 55419
$-2,895
Cash flow
-19.4%
Cash-on-Cash Return
1.2%
Cap rate
0.3%
Rent to Value Ratio
Active
$299,900
2
bds
|
2
ba
|
1,281
sqft
|
built
2004
9165 Comstock Ln N, Maple Grove, MN 55311
$-484
Cash flow
-8.4%
Cash-on-Cash Return
3.7%
Cap rate
0.8%
Rent to Value Ratio
Active
$499,999
4
bds
|
2
ba
|
2,002
sqft
|
built
1959
16522 Elm Dr, Minnetonka, MN 55345
$-640
Cash flow
-6.7%
Cash-on-Cash Return
4.1%
Cap rate
0.6%
Rent to Value Ratio
Active
$479,000
4
bds
|
2
ba
|
1,736
sqft
|
built
1979
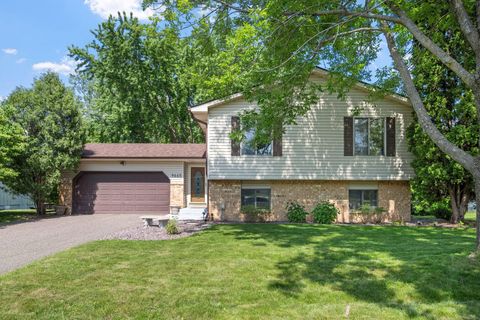
9645 Garrison Way, Eden Prairie, MN 55347
$-542
Cash flow
-5.9%
Cash-on-Cash Return
4.3%
Cap rate
0.6%
Rent to Value Ratio
Active
$3,500,000
5
bds
|
5
ba
|
5,710
sqft
|
built
2025
5117 Juanita Ave, Edina, MN 55424
$-14,872
Cash flow
-22.2%
Cash-on-Cash Return
0.6%
Cap rate
0.1%
Rent to Value Ratio
Active
$570,000
7
bds
|
4
ba
|
3,676
sqft
|
built
1887
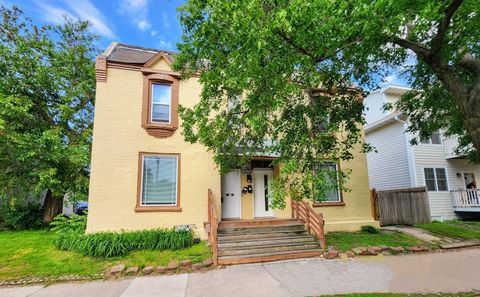
3035 Aldrich Ave S, Minneapolis, MN 55408
$-2,088
Cash flow
-19.1%
Cash-on-Cash Return
1.3%
Cap rate
0.4%
Rent to Value Ratio
Active
$550,000
4
bds
|
3
ba
|
2,692
sqft
|
built
1938
5524 Columbus Ave, Minneapolis, MN 55417
$-1,055
Cash flow
-10.0%
Cash-on-Cash Return
3.4%
Cap rate
0.6%
Rent to Value Ratio
Active
$199,900
2
bds
|
2
ba
|
1,180
sqft
|
built
1973
1920 S 1st St, Minneapolis, MN 55454
$-694
Cash flow
-18.1%
Cash-on-Cash Return
1.5%
Cap rate
1.1%
Rent to Value Ratio
Active
$260,000
2
bds
|
2
ba
|
1,580
sqft
|
built
2003
13838 54th Ave N, Minneapolis, MN 55446
$-240
Cash flow
-4.8%
Cash-on-Cash Return
4.6%
Cap rate
0.8%
Rent to Value Ratio
Active
$425,000
3
bds
|
2
ba
|
1,341
sqft
|
built
1907
4529 Xerxes Ave S, Minneapolis, MN 55410
$-858
Cash flow
-10.5%
Cash-on-Cash Return
3.3%
Cap rate
0.6%
Rent to Value Ratio
Active
$189,000
2
bds
|
2
ba
|
1,612
sqft
|
built
1927
4516 5th Ave S, Minneapolis, MN 55419
$351
Cash flow
9.7%
Cash-on-Cash Return
7.9%
Cap rate
1.2%
Rent to Value Ratio
Active
$335,000
3
bds
|
3
ba
|
1,505
sqft
|
built
2015
1004 Van White Memorial Blvd, Minneapolis, MN 55411
$-618
Cash flow
-9.6%
Cash-on-Cash Return
3.5%
Cap rate
0.7%
Rent to Value Ratio
Active
$435,000
3
bds
|
4
ba
|
2,640
sqft
|
built
2001
10840 57th Ave N, Plymouth, MN 55442
$-861
Cash flow
-10.3%
Cash-on-Cash Return
3.3%
Cap rate
0.7%
Rent to Value Ratio
Active
$625,000
3
bds
|
2
ba
|
2,468
sqft
|
built
1916
4215 Wentworth Ave, Minneapolis, MN 55409
$-2,062
Cash flow
-17.2%
Cash-on-Cash Return
1.7%
Cap rate
0.3%
Rent to Value Ratio
Active
$850,000
3
bds
|
2
ba
|
2,009
sqft
|
built
1987
1701 Baywood Ln, Mound, MN 55364
$-2,267
Cash flow
-13.9%
Cash-on-Cash Return
2.5%
Cap rate
0.5%
Rent to Value Ratio
Active
$475,000
4
bds
|
3
ba
|
2,257
sqft
|
built
1900
3144 Girard Ave S, Minneapolis, MN 55408
$-889
Cash flow
-9.8%
Cash-on-Cash Return
3.4%
Cap rate
0.5%
Rent to Value Ratio
Active
$159,995
1
bds
|
1
ba
|
969
sqft
|
built
1971
3412 Oak Ridge Rd, Hopkins, MN 55305
$-320
Cash flow
-10.4%
Cash-on-Cash Return
3.3%
Cap rate
1.1%
Rent to Value Ratio
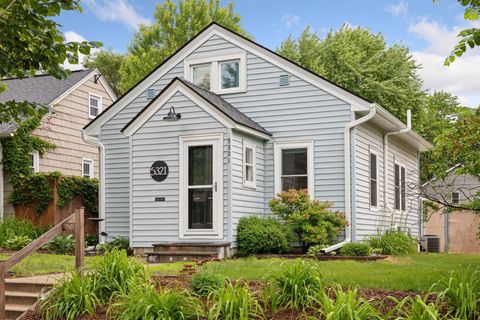
Active
$315,000
1
bds
|
1
ba
|
816
sqft
|
built
1917
5321 39th Ave S, Minneapolis, MN 55417
$-294
Cash flow
-4.9%
Cash-on-Cash Return
4.6%
Cap rate
0.7%
Rent to Value Ratio
Active
$264,900
3
bds
|
1
ba
|
949
sqft
|
built
1921
5545 45th Ave S, Minneapolis, MN 55417
$-297
Cash flow
-5.8%
Cash-on-Cash Return
4.3%
Cap rate
0.7%
Rent to Value Ratio
Active
$240,000
2
bds
|
2
ba
|
1,193
sqft
|
built
2004
12693 Collegeview Dr, Eden Prairie, MN 55347
$-439
Cash flow
-9.5%
Cash-on-Cash Return
3.5%
Cap rate
0.8%
Rent to Value Ratio
Active
$340,000
3
bds
|
2
ba
|
1,992
sqft
|
built
1977
7433 Drew Ave N, Minneapolis, MN 55443
$-189
Cash flow
-2.9%
Cash-on-Cash Return
5.0%
Cap rate
0.8%
Rent to Value Ratio
Active
$590,000
7
bds
|
3
ba
|
3,132
sqft
|
built
1885
3506 Pleasant Ave, Minneapolis, MN 55408
$-1,723
Cash flow
-15.2%
Cash-on-Cash Return
2.2%
Cap rate
0.4%
Rent to Value Ratio