Hennepin County Investment Properties for Sale
Browse homes for sale and investment properties in Hennepin County. Refine your search by price, property type, or more.
Best cash flowing properties in Hennepin County
Active
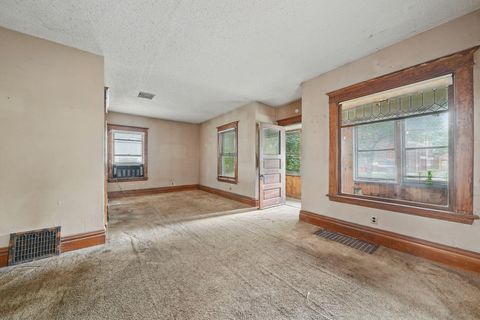
$205,000
3
bds
|
1
ba
|
1,182
sqft
|
built
1907
2918 15th Ave S, Minneapolis, MN 55407
$198
Cash flow
5.0%
Cash-on-Cash Return
6.8%
Cap rate
1.0%
Rent to Value Ratio
Active
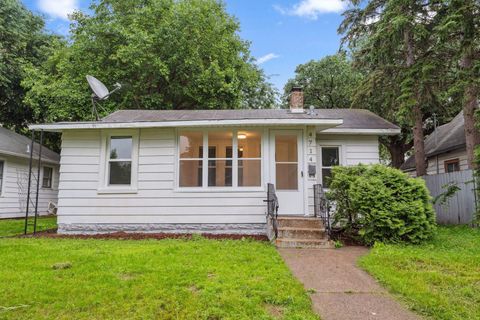
$179,900
1
bds
|
1
ba
|
584
sqft
|
built
1922
4714 Aldrich Ave N, Minneapolis, MN 55430
$-40
Cash flow
-1.2%
Cash-on-Cash Return
5.4%
Cap rate
0.8%
Rent to Value Ratio
1,899 out of 3,277 properties for sale in Hennepin County
Limited Results Shown
Create a free account, or log in to reveal all property listings and enjoy the complete experience.

Active
$529,900
3
bds
|
2
ba
|
1,650
sqft
|
built
1925
5320 40th Ave S, Minneapolis, MN 55417
$-1,007
Cash flow
-9.9%
Cash-on-Cash Return
3.4%
Cap rate
0.5%
Rent to Value Ratio
Active
$369,000
4
bds
|
2
ba
|
2,029
sqft
|
built
1984
11620 Oregon Ave N, Champlin, MN 55316
$-576
Cash flow
-8.1%
Cash-on-Cash Return
3.8%
Cap rate
0.6%
Rent to Value Ratio
Active
$3,290,000
5
bds
|
4
ba
|
4,607
sqft
|
built
2024
4919 Three Points Blvd, Mound, MN 55364
$-13,373
Cash flow
-21.2%
Cash-on-Cash Return
0.8%
Cap rate
0.2%
Rent to Value Ratio

Active
$325,000
4
bds
|
3
ba
|
1,683
sqft
|
built
2001
2651 Colfax Ave N, Minneapolis, MN 55411
$-104
Cash flow
-1.7%
Cash-on-Cash Return
5.3%
Cap rate
0.8%
Rent to Value Ratio

Active
$674,999
4
bds
|
3
ba
|
4,750
sqft
|
built
2010
13478 Clearwater Cir, Rogers, MN 55374
$-1,492
Cash flow
-11.5%
Cash-on-Cash Return
3.0%
Cap rate
0.5%
Rent to Value Ratio

Active
$969,000
2
bds
|
2
ba
|
1,686
sqft
|
built
1915
525 3rd St N, Minneapolis, MN 55401
$-3,088
Cash flow
-16.6%
Cash-on-Cash Return
1.9%
Cap rate
0.5%
Rent to Value Ratio

Active
$362,000
4
bds
|
2
ba
|
1,915
sqft
|
built
1989
4500 Adair Ave N, Minneapolis, MN 55422
$-398
Cash flow
-5.7%
Cash-on-Cash Return
4.4%
Cap rate
0.7%
Rent to Value Ratio

Active
$800,000
3
bds
|
3
ba
|
3,762
sqft
|
built
2000
11824 Germaine Ter, Eden Prairie, MN 55347
$-2,624
Cash flow
-17.1%
Cash-on-Cash Return
1.7%
Cap rate
0.4%
Rent to Value Ratio
Active
$239,900
2
bds
|
2
ba
|
1,135
sqft
|
built
1992
2060 Shenandoah Ct, Plymouth, MN 55447
$-432
Cash flow
-9.4%
Cash-on-Cash Return
3.5%
Cap rate
0.8%
Rent to Value Ratio
Active
$379,900
4
bds
|
2
ba
|
2,044
sqft
|
built
1900
724 Pierce St NE, Minneapolis, MN 55413
$-263
Cash flow
-3.6%
Cash-on-Cash Return
4.8%
Cap rate
0.7%
Rent to Value Ratio
Active
$349,900
3
bds
|
1
ba
|
1,372
sqft
|
built
1925
4415 Snelling Ave, Minneapolis, MN 55406
$-358
Cash flow
-5.3%
Cash-on-Cash Return
4.5%
Cap rate
0.7%
Rent to Value Ratio
Active
$205,000
3
bds
|
1
ba
|
1,182
sqft
|
built
1907
2918 15th Ave S, Minneapolis, MN 55407
$198
Cash flow
5.0%
Cash-on-Cash Return
6.8%
Cap rate
1.0%
Rent to Value Ratio
Active
$1,649,900
5
bds
|
4
ba
|
3,165
sqft
|
built
2025
4425 Zenith Ave S, Minneapolis, MN 55410
$-6,256
Cash flow
-19.8%
Cash-on-Cash Return
1.1%
Cap rate
0.2%
Rent to Value Ratio

Active
$489,900
3
bds
|
3
ba
|
2,900
sqft
|
built
2003
11424 Preserve Ln N, Champlin, MN 55316
$-1,123
Cash flow
-12.0%
Cash-on-Cash Return
2.9%
Cap rate
0.6%
Rent to Value Ratio

Active
$939,000
5
bds
|
4
ba
|
4,363
sqft
|
built
2014
18482 Aubrie Ct, Eden Prairie, MN 55347
$-2,548
Cash flow
-14.2%
Cash-on-Cash Return
2.4%
Cap rate
0.4%
Rent to Value Ratio

Active
$370,000
5
bds
|
2
ba
|
2,177
sqft
|
built
1900
1813 11th Ave S, Minneapolis, MN 55404
$-190
Cash flow
-2.7%
Cash-on-Cash Return
5.1%
Cap rate
0.8%
Rent to Value Ratio
Active
$999,000
3
bds
|
4
ba
|
3,182
sqft
|
built
1969
5825 Jonquil Ln N, Plymouth, MN 55442
$-2,230
Cash flow
-11.6%
Cash-on-Cash Return
3.0%
Cap rate
0.5%
Rent to Value Ratio

Active
$349,900
5
bds
|
2
ba
|
1,652
sqft
|
built
1900
2106 University Ave NE, Minneapolis, MN 55418
$-87
Cash flow
-1.3%
Cash-on-Cash Return
5.4%
Cap rate
0.8%
Rent to Value Ratio

Active
$1,199,000
2
bds
|
2
ba
|
2,024
sqft
|
built
2013
415 Indian Mound St, Wayzata, MN 55391
$-4,440
Cash flow
-19.3%
Cash-on-Cash Return
1.2%
Cap rate
0.4%
Rent to Value Ratio
Active
$525,000
4
bds
|
3
ba
|
2,293
sqft
|
built
1969
18520 29th Ave N, Plymouth, MN 55447
$-629
Cash flow
-6.3%
Cash-on-Cash Return
4.2%
Cap rate
0.6%
Rent to Value Ratio
Active
$675,000
6
bds
|
4
ba
|
3,476
sqft
|
built
1918
212 E Diamond Lake Rd, Minneapolis, MN 55419
$-2,140
Cash flow
-16.5%
Cash-on-Cash Return
1.9%
Cap rate
0.4%
Rent to Value Ratio
Active
$339,900
2
bds
|
1
ba
|
1,168
sqft
|
built
1900
250 Park Ave, Minneapolis, MN 55415
$-999
Cash flow
-15.3%
Cash-on-Cash Return
2.2%
Cap rate
0.8%
Rent to Value Ratio
Active
$389,000
2
bds
|
2
ba
|
1,580
sqft
|
built
2006
5900 Oxford St, Minneapolis, MN 55416
$-971
Cash flow
-13.0%
Cash-on-Cash Return
3.3%
Cap rate
0.7%
Rent to Value Ratio

Active
$850,000
6
bds
|
3
ba
|
2,766
sqft
|
built
1927
1913 E River Pkwy, Minneapolis, MN 55414
$-2,268
Cash flow
-13.9%
Cash-on-Cash Return
2.5%
Cap rate
0.5%
Rent to Value Ratio

Active
$450,000
5
bds
|
2
ba
|
2,139
sqft
|
built
1984
11430 47th Ave N, Plymouth, MN 55442
$-399
Cash flow
-4.6%
Cash-on-Cash Return
4.6%
Cap rate
0.7%
Rent to Value Ratio

Active
$484,900
3
bds
|
3
ba
|
3,051
sqft
|
built
2001
22087 Jasmine Way, Rogers, MN 55374
$-591
Cash flow
-6.4%
Cash-on-Cash Return
4.2%
Cap rate
0.6%
Rent to Value Ratio
Active
$280,000
2
bds
|
2
ba
|
1,017
sqft
|
built
1920
5709 26th Ave S, Minneapolis, MN 55417
$-188
Cash flow
-3.5%
Cash-on-Cash Return
4.9%
Cap rate
0.7%
Rent to Value Ratio
Active
$485,000
2
bds
|
2
ba
|
1,240
sqft
|
built
2006
215 10th Ave S, Minneapolis, MN 55415
$-1,001
Cash flow
-10.8%
Cash-on-Cash Return
3.2%
Cap rate
0.6%
Rent to Value Ratio

Active
$575,000
3
bds
|
3
ba
|
2,449
sqft
|
built
1959
6808 Hillside Ln, Edina, MN 55439
$-1,100
Cash flow
-10.0%
Cash-on-Cash Return
3.4%
Cap rate
0.5%
Rent to Value Ratio
Active
$495,000
3
bds
|
2
ba
|
2,294
sqft
|
built
1996
13735 57th Ave N, Plymouth, MN 55446
$-784
Cash flow
-8.3%
Cash-on-Cash Return
3.8%
Cap rate
0.6%
Rent to Value Ratio
Active
$210,000
2
bds
|
2
ba
|
1,185
sqft
|
built
1978
1304 W Medicine Lake Dr, Plymouth, MN 55441
$-483
Cash flow
-12.0%
Cash-on-Cash Return
2.9%
Cap rate
1.0%
Rent to Value Ratio
Active
$365,000
3
bds
|
4
ba
|
2,448
sqft
|
built
1978
4839 Spring Cir, Minnetonka, MN 55345
$-689
Cash flow
-9.8%
Cash-on-Cash Return
3.4%
Cap rate
0.8%
Rent to Value Ratio
Active
$139,900
1
bds
|
1
ba
|
768
sqft
|
built
1977
1200 Nicollet Mall, Minneapolis, MN 55403
$-393
Cash flow
-14.7%
Cash-on-Cash Return
2.3%
Cap rate
1.1%
Rent to Value Ratio
Active
$179,900
1
bds
|
1
ba
|
584
sqft
|
built
1922
4714 Aldrich Ave N, Minneapolis, MN 55430
$-40
Cash flow
-1.2%
Cash-on-Cash Return
5.4%
Cap rate
0.8%
Rent to Value Ratio

Active
$675,000
3
bds
|
3
ba
|
2,490
sqft
|
built
1987
1104 Hollybrook Dr, Wayzata, MN 55391
$-1,888
Cash flow
-14.6%
Cash-on-Cash Return
2.3%
Cap rate
0.5%
Rent to Value Ratio

Active
$815,000
2
bds
|
2
ba
|
1,970
sqft
|
built
1997
5120 France Ave S, Edina, MN 55410
$-3,204
Cash flow
-20.5%
Cash-on-Cash Return
1.0%
Cap rate
0.4%
Rent to Value Ratio

Active
$249,900
3
bds
|
1
ba
|
1,043
sqft
|
built
1923
3519 Upton Ave N, Minneapolis, MN 55412
$-89
Cash flow
-1.9%
Cash-on-Cash Return
5.3%
Cap rate
0.8%
Rent to Value Ratio

Active
$289,900
3
bds
|
2
ba
|
927
sqft
|
built
1926
5801 23rd Ave S, Minneapolis, MN 55417
$-236
Cash flow
-4.2%
Cash-on-Cash Return
4.7%
Cap rate
0.8%
Rent to Value Ratio
Active
$1,650,000
4
bds
|
5
ba
|
5,268
sqft
|
built
2022
16216 Gleason Lake Rd, Wayzata, MN 55391
$-6,927
Cash flow
-21.9%
Cash-on-Cash Return
0.6%
Cap rate
0.1%
Rent to Value Ratio

Active
$465,000
2
bds
|
2
ba
|
1,093
sqft
|
built
2018
1240 S 2nd St, Minneapolis, MN 55415
$-1,199
Cash flow
-13.5%
Cash-on-Cash Return
2.6%
Cap rate
0.7%
Rent to Value Ratio