Oklahoma County Investment Properties for Sale
Browse homes for sale and investment properties in Oklahoma County. Refine your search by price, property type, or more.
Best cash flowing properties in Oklahoma County

Active
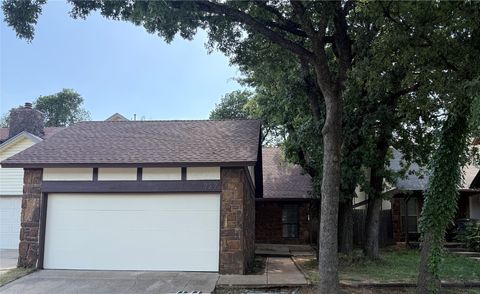
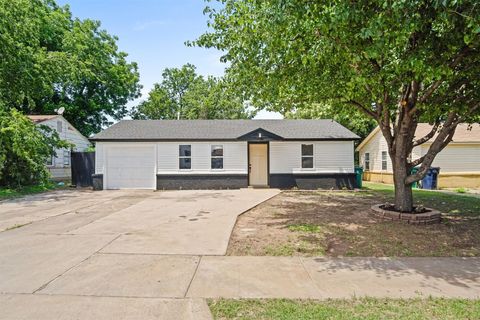
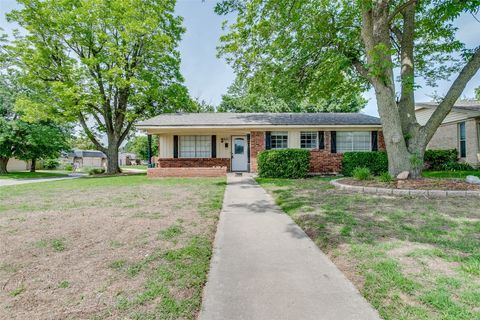
$95,000
2
bds
|
2
ba
|
0
sqft
|
built
1984
6225 SE 46th St, Oklahoma City, OK 73135
$210
Cash flow
11.5%
Cash-on-Cash Return
8.3%
Cap rate
1.2%
Rent to Value Ratio
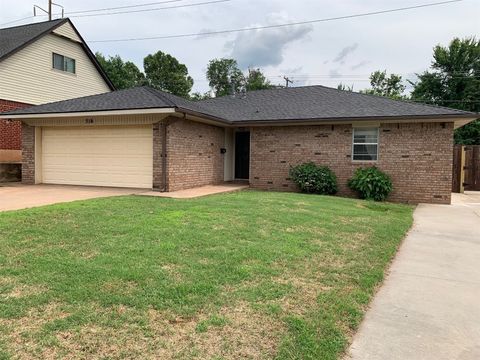
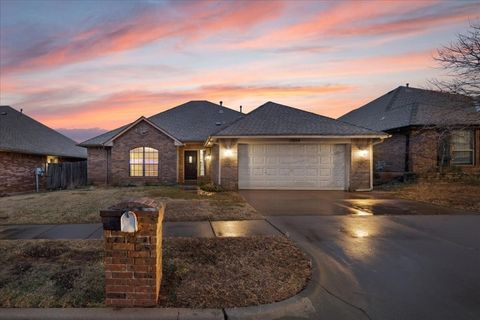
Active
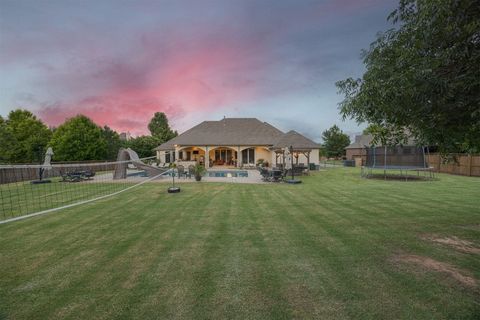
$145,900
2
bds
|
2
ba
|
0
sqft
|
built
1983
727 Rockridge Cir, Edmond, OK 73034
$182
Cash flow
6.5%
Cash-on-Cash Return
7.2%
Cap rate
1.0%
Rent to Value Ratio
2,106 out of 2,924 properties for sale in Oklahoma County
Limited Results Shown
Create a free account, or log in to reveal all property listings and enjoy the complete experience.
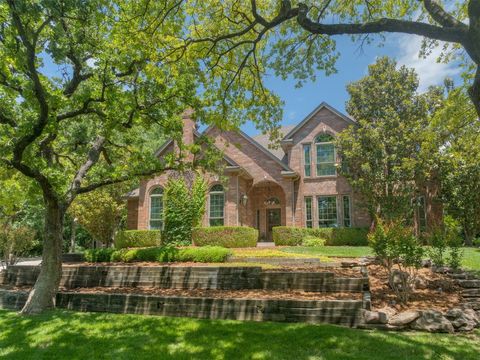
Active
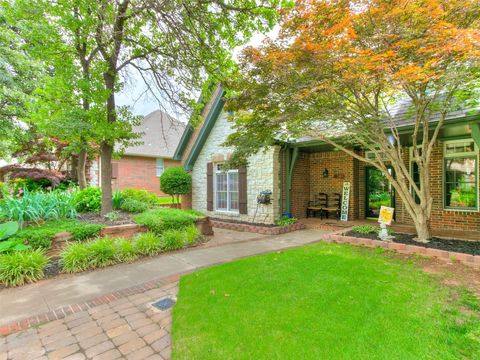
$915,000
4
bds
|
5
ba
|
0
sqft
|
built
2011
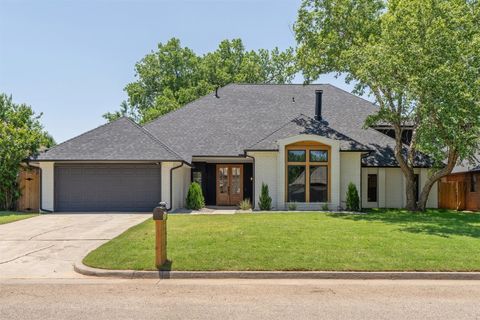
3617 Stagmoor Rd, Edmond, OK 73034
$-2,780
Cash flow
-15.9%
Cash-on-Cash Return
2.0%
Cap rate
0.4%
Rent to Value Ratio
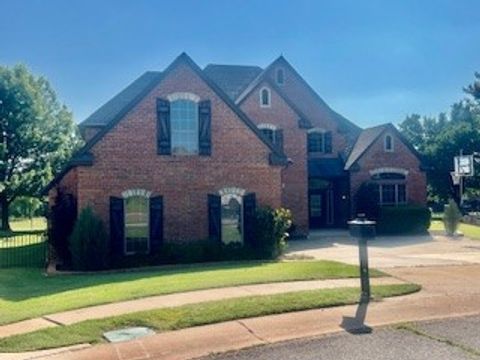
Active
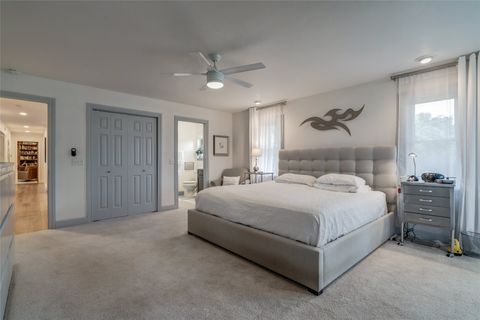
$489,900
4
bds
|
4
ba
|
0
sqft
|
built
1991
4304 Riders Mark, Edmond, OK 73025
$-319
Cash flow
-3.4%
Cash-on-Cash Return
4.9%
Cap rate
0.7%
Rent to Value Ratio
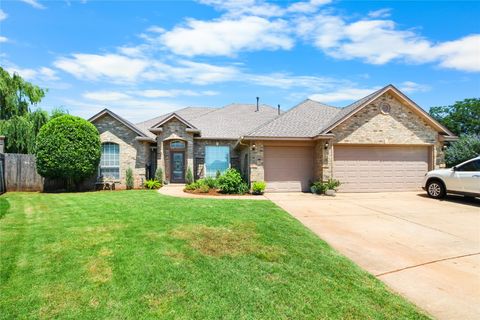
Active
$657,200
3
bds
|
5
ba
|
0
sqft
|
built
1975
15700 N Western Ave, Edmond, OK 73013
$-1,334
Cash flow
-10.6%
Cash-on-Cash Return
3.2%
Cap rate
0.5%
Rent to Value Ratio
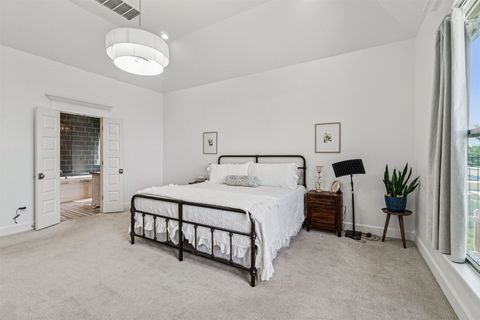
Active
$330,000
4
bds
|
4
ba
|
0
sqft
|
built
1938
3157 NW 25th St, Oklahoma City, OK 73107
$-707
Cash flow
-11.2%
Cash-on-Cash Return
3.1%
Cap rate
0.5%
Rent to Value Ratio
Active
$210,000
5
bds
|
2
ba
|
0
sqft
|
built
1954
813 SW 56th St, Oklahoma City, OK 73109
$-170
Cash flow
-4.2%
Cash-on-Cash Return
4.7%
Cap rate
0.6%
Rent to Value Ratio
Active
$95,000
2
bds
|
2
ba
|
0
sqft
|
built
1984
6225 SE 46th St, Oklahoma City, OK 73135
$210
Cash flow
11.5%
Cash-on-Cash Return
8.3%
Cap rate
1.2%
Rent to Value Ratio
Active
$234,500
3
bds
|
2
ba
|
0
sqft
|
built
1978
516 Ridgecrest Rd, Edmond, OK 73013
$-220
Cash flow
-4.9%
Cash-on-Cash Return
4.6%
Cap rate
0.7%
Rent to Value Ratio

Active
$330,000
4
bds
|
4
ba
|
0
sqft
|
built
1971
2317 NW 119th St, Oklahoma City, OK 73120
$-380
Cash flow
-6.0%
Cash-on-Cash Return
4.3%
Cap rate
0.6%
Rent to Value Ratio

Active
$1,150,000
4
bds
|
4
ba
|
0
sqft
|
built
2021
1700 Runway Blvd, Oklahoma City, OK 73108
$-4,517
Cash flow
-20.5%
Cash-on-Cash Return
1.0%
Cap rate
0.3%
Rent to Value Ratio

Active
$282,500
3
bds
|
2
ba
|
0
sqft
|
built
1969
1317 N Wisconsin Ave, Oklahoma City, OK 73117
$-204
Cash flow
-3.8%
Cash-on-Cash Return
4.8%
Cap rate
0.7%
Rent to Value Ratio
Active
$899,000
5
bds
|
4
ba
|
0
sqft
|
built
1996
1300 Oak Springs Ln, Edmond, OK 73034
$-2,924
Cash flow
-17.0%
Cash-on-Cash Return
2.4%
Cap rate
0.4%
Rent to Value Ratio

Active
$249,900
3
bds
|
2
ba
|
0
sqft
|
built
2006
5109 SE 80th St, Oklahoma City, OK 73135
$-231
Cash flow
-4.8%
Cash-on-Cash Return
4.6%
Cap rate
0.7%
Rent to Value Ratio

Active
$260,000
3
bds
|
3
ba
|
0
sqft
|
built
1969
3405 Oak Grove Dr, Midwest City, OK 73110
$-179
Cash flow
-3.6%
Cash-on-Cash Return
4.9%
Cap rate
0.7%
Rent to Value Ratio
Active
$159,000
3
bds
|
2
ba
|
0
sqft
|
built
1966
601 Woodland Way, Oklahoma City, OK 73127
$122
Cash flow
4.0%
Cash-on-Cash Return
6.6%
Cap rate
0.9%
Rent to Value Ratio

Active
$885,000
6
bds
|
4
ba
|
0
sqft
|
built
1914
830 NW 17th St, Oklahoma City, OK 73106
$-1,973
Cash flow
-11.6%
Cash-on-Cash Return
3.0%
Cap rate
0.5%
Rent to Value Ratio

Active
$675,000
4
bds
|
5
ba
|
0
sqft
|
built
2004
5616 NW 132nd St, Oklahoma City, OK 73142
$-1,769
Cash flow
-13.7%
Cash-on-Cash Return
2.5%
Cap rate
0.5%
Rent to Value Ratio
Active
$280,000
3
bds
|
2
ba
|
0
sqft
|
built
2005
17029 Woodvine Dr, Edmond, OK 73012
$-361
Cash flow
-6.7%
Cash-on-Cash Return
4.1%
Cap rate
0.6%
Rent to Value Ratio
Active
$189,000
3
bds
|
2
ba
|
0
sqft
|
built
1957
709 S Santa Fe Dr, Edmond, OK 73003
$-29
Cash flow
-0.8%
Cash-on-Cash Return
5.5%
Cap rate
0.7%
Rent to Value Ratio

Active
$299,999
3
bds
|
2
ba
|
0
sqft
|
built
2001
8300 NW 71st St, Oklahoma City, OK 73132
$-163
Cash flow
-2.8%
Cash-on-Cash Return
5.0%
Cap rate
0.7%
Rent to Value Ratio
Active
$145,900
2
bds
|
2
ba
|
0
sqft
|
built
1983
727 Rockridge Cir, Edmond, OK 73034
$182
Cash flow
6.5%
Cash-on-Cash Return
7.2%
Cap rate
1.0%
Rent to Value Ratio

Active
$159,999
3
bds
|
1
ba
|
0
sqft
|
built
1949
312 SE 45th St, Oklahoma City, OK 73129
$90
Cash flow
2.9%
Cash-on-Cash Return
6.4%
Cap rate
0.8%
Rent to Value Ratio

Active
$229,900
3
bds
|
2
ba
|
0
sqft
|
built
1979
9703 Woodrock Ct, Midwest City, OK 73130
$-40
Cash flow
-0.9%
Cash-on-Cash Return
5.5%
Cap rate
0.8%
Rent to Value Ratio
Active
$750,000
3
bds
|
3
ba
|
0
sqft
|
built
2014
925 NW 8th St, Oklahoma City, OK 73106
$-2,366
Cash flow
-16.5%
Cash-on-Cash Return
1.9%
Cap rate
0.3%
Rent to Value Ratio

Active
$172,000
3
bds
|
2
ba
|
0
sqft
|
built
1966
1540 Bradley Pl, Oklahoma City, OK 73127
$-53
Cash flow
-1.6%
Cash-on-Cash Return
5.3%
Cap rate
0.8%
Rent to Value Ratio
Active
$644,000
5
bds
|
4
ba
|
0
sqft
|
built
1985
14029 Osage Dr, Edmond, OK 73013
$-1,568
Cash flow
-12.7%
Cash-on-Cash Return
2.8%
Cap rate
0.4%
Rent to Value Ratio

Active
$165,000
3
bds
|
2
ba
|
0
sqft
|
built
1979
833 NW 118th St, Oklahoma City, OK 73114
$99
Cash flow
3.1%
Cash-on-Cash Return
6.4%
Cap rate
0.8%
Rent to Value Ratio

Active
$239,000
3
bds
|
2
ba
|
0
sqft
|
built
1983
7204 Walnut Creek Dr, Oklahoma City, OK 73142
$-205
Cash flow
-4.5%
Cash-on-Cash Return
4.6%
Cap rate
0.7%
Rent to Value Ratio

Active
$169,000
4
bds
|
1
ba
|
0
sqft
|
built
1959
2805 SW 60th St, Oklahoma City, OK 73159
$-137
Cash flow
-4.2%
Cash-on-Cash Return
4.7%
Cap rate
0.7%
Rent to Value Ratio

Active
$135,000
3
bds
|
2
ba
|
0
sqft
|
built
1961
325 NW 84th St, Oklahoma City, OK 73114
$22
Cash flow
0.9%
Cash-on-Cash Return
5.9%
Cap rate
0.8%
Rent to Value Ratio

Active
$229,500
3
bds
|
2
ba
|
0
sqft
|
built
1979
1321 Alviola Ave, Midwest City, OK 73110
$-215
Cash flow
-4.9%
Cash-on-Cash Return
4.6%
Cap rate
0.7%
Rent to Value Ratio
Active
$555,200
4
bds
|
3
ba
|
0
sqft
|
built
1999
3805 Highridge, Edmond, OK 73003
$-919
Cash flow
-8.6%
Cash-on-Cash Return
3.7%
Cap rate
0.6%
Rent to Value Ratio
Active
$325,000
4
bds
|
3
ba
|
0
sqft
|
built
2003
1857 Tall Grass Ct, Edmond, OK 73012
$-481
Cash flow
-7.7%
Cash-on-Cash Return
3.9%
Cap rate
0.6%
Rent to Value Ratio
Active
$729,000
4
bds
|
4
ba
|
0
sqft
|
built
2014
16761 Little Leaf Ct, Edmond, OK 73012
$-1,663
Cash flow
-11.9%
Cash-on-Cash Return
2.9%
Cap rate
0.5%
Rent to Value Ratio
Active
$410,000
4
bds
|
2
ba
|
0
sqft
|
built
2016
501 NW 197th St, Edmond, OK 73012
$-626
Cash flow
-8.0%
Cash-on-Cash Return
3.8%
Cap rate
0.6%
Rent to Value Ratio

Active
$450,000
3
bds
|
2
ba
|
0
sqft
|
built
1920
1218 NW 21st St, Oklahoma City, OK 73106
$-555
Cash flow
-6.4%
Cash-on-Cash Return
4.2%
Cap rate
0.6%
Rent to Value Ratio

Active
$350,000
4
bds
|
3
ba
|
0
sqft
|
built
1982
6513 NW 95th St, Oklahoma City, OK 73162
$-477
Cash flow
-7.1%
Cash-on-Cash Return
4.0%
Cap rate
0.6%
Rent to Value Ratio

Active
$316,630
3
bds
|
2
ba
|
0
sqft
|
built
2025
8616 SW 75th St, Oklahoma City, OK 73169
$-350
Cash flow
-5.8%
Cash-on-Cash Return
4.4%
Cap rate
0.5%
Rent to Value Ratio

Active
$995,000
4
bds
|
5
ba
|
0
sqft
|
built
1973
3312 E Hefner Rd, Oklahoma City, OK 73131
$-2,990
Cash flow
-15.7%
Cash-on-Cash Return
2.1%
Cap rate
0.3%
Rent to Value Ratio

Active
$375,000
4
bds
|
2
ba
|
0
sqft
|
built
1987
1408 Carlton, Edmond, OK 73034
$-499
Cash flow
-6.9%
Cash-on-Cash Return
4.1%
Cap rate
0.6%
Rent to Value Ratio

Active
$400,000
3
bds
|
3
ba
|
0
sqft
|
built
1940
2310 N Francis Ave, Oklahoma City, OK 73106
$-821
Cash flow
-10.7%
Cash-on-Cash Return
3.2%
Cap rate
0.4%
Rent to Value Ratio