Oklahoma County Investment Properties for Sale
Browse homes for sale and investment properties in Oklahoma County. Refine your search by price, property type, or more.
Best cash flowing properties in Oklahoma County
Active
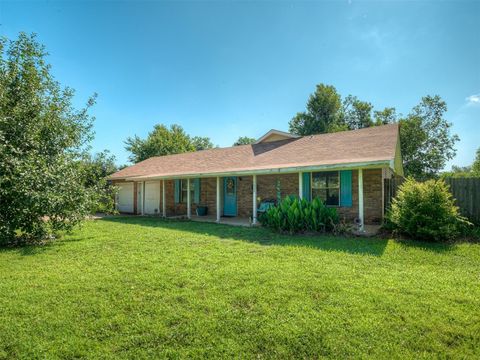
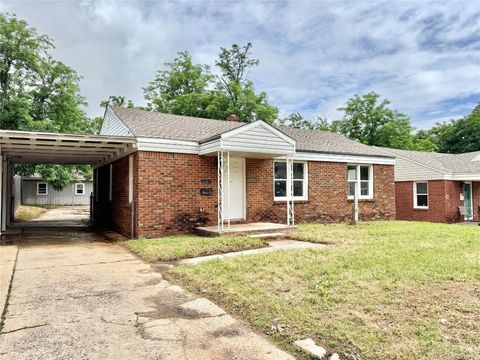
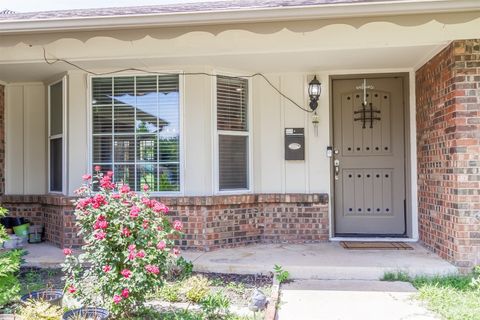
$197,000
3
bds
|
3
ba
|
0
sqft
|
built
1938
7024 S Kleiner Ave, Oklahoma City, OK 73106
$180
Cash flow
4.8%
Cash-on-Cash Return
6.8%
Cap rate
1.0%
Rent to Value Ratio
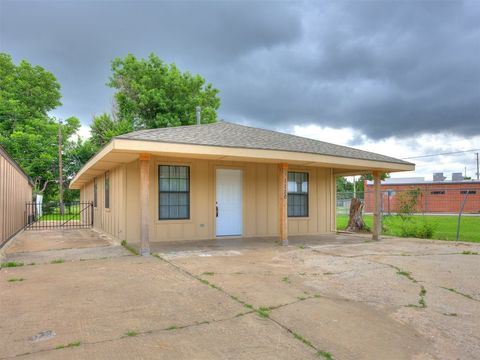
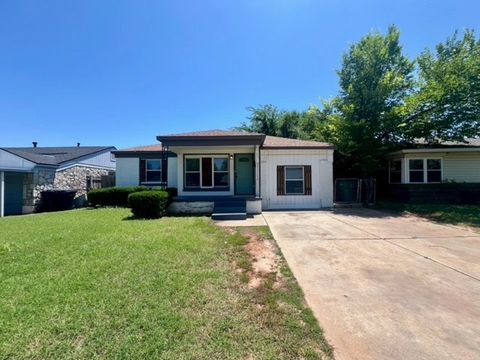
Active
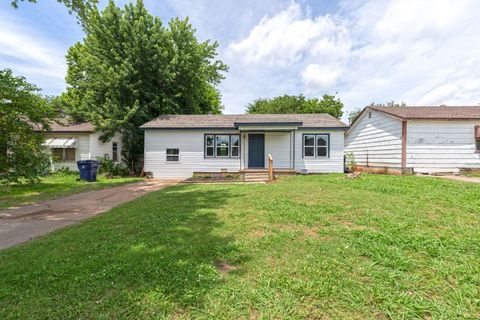
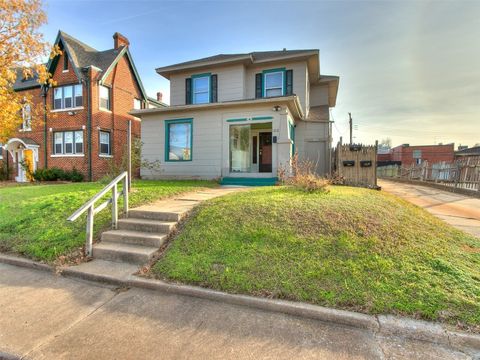
$135,000
3
bds
|
1
ba
|
0
sqft
|
built
1952
239 SE 48th St, Oklahoma City, OK 73129
$104
Cash flow
4.0%
Cash-on-Cash Return
6.6%
Cap rate
0.8%
Rent to Value Ratio
2,111 out of 2,931 properties for sale in Oklahoma County
Limited Results Shown
Create a free account, or log in to reveal all property listings and enjoy the complete experience.
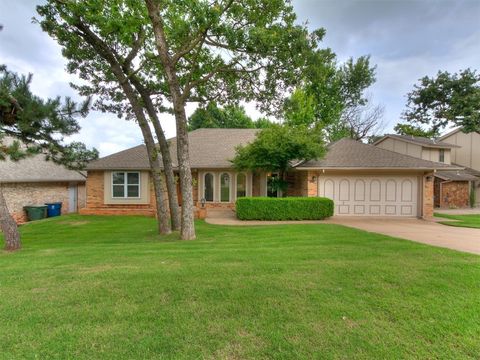
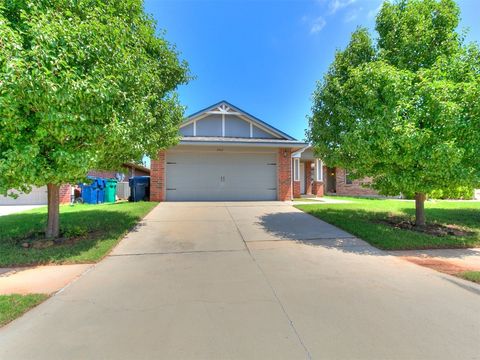
Active
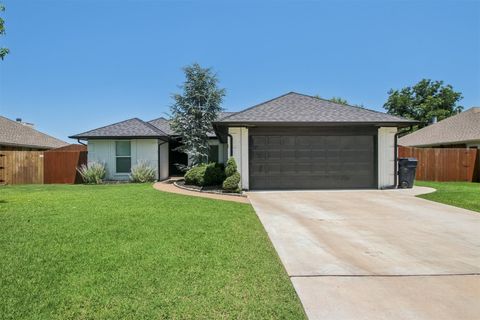
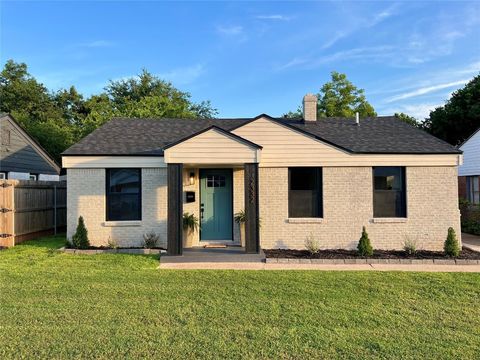
$289,900
3
bds
|
2
ba
|
0
sqft
|
built
1988
1705 NW 176th Ter, Edmond, OK 73012
$-628
Cash flow
-11.3%
Cash-on-Cash Return
3.7%
Cap rate
0.6%
Rent to Value Ratio
Active
$197,000
3
bds
|
3
ba
|
0
sqft
|
built
1938
7024 S Kleiner Ave, Oklahoma City, OK 73106
$180
Cash flow
4.8%
Cash-on-Cash Return
6.8%
Cap rate
1.0%
Rent to Value Ratio
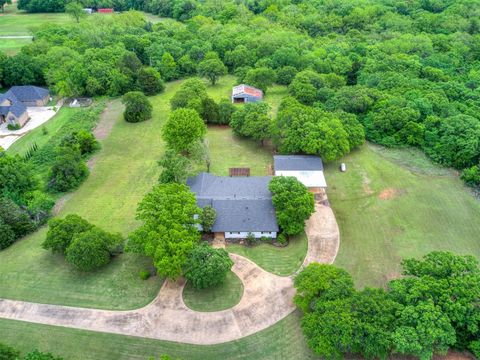
Active
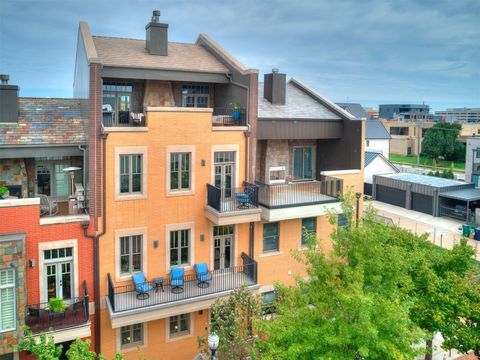
$980,000
3
bds
|
4
ba
|
0
sqft
|
built
2022
117 NE 3rd St, Oklahoma City, OK 73104
$-2,452
Cash flow
-13.1%
Cash-on-Cash Return
2.7%
Cap rate
0.4%
Rent to Value Ratio
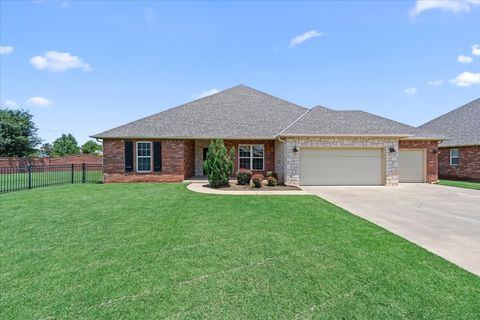
Active
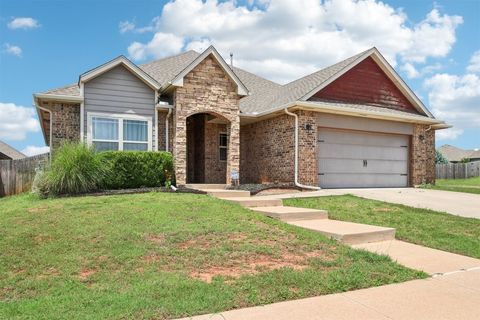
$319,000
4
bds
|
2
ba
|
0
sqft
|
built
1997
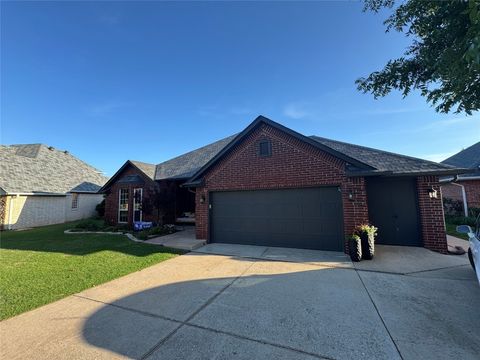
6300 NW 132nd St, Oklahoma City, OK 73142
$-563
Cash flow
-9.2%
Cash-on-Cash Return
3.6%
Cap rate
0.6%
Rent to Value Ratio
Active
$400,000
4
bds
|
2
ba
|
0
sqft
|
built
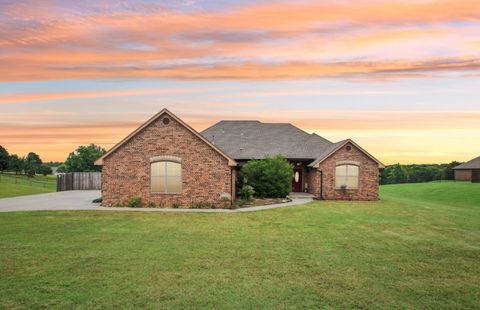
2011
7732 Jesse Trl, Oklahoma City, OK 73150
$-571
Cash flow
-7.4%
Cash-on-Cash Return
4.0%
Cap rate
0.6%
Rent to Value Ratio
Active
$130,000
2
bds
|
2
ba
|
0
sqft
|
built
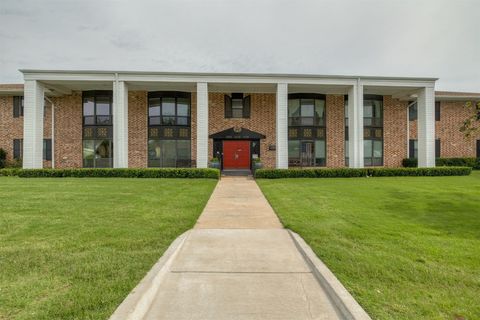
1964
2527 NW 62nd St, Oklahoma City, OK 73112
$-368
Cash flow
-14.8%
Cash-on-Cash Return
2.3%
Cap rate
1.0%
Rent to Value Ratio
Active
$1,995,000
4
bds
|
5
ba
|
0
sqft
|
built
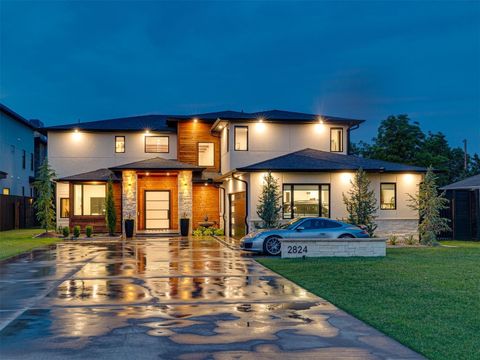
2021
2824 Guilford Ln, Oklahoma City, OK 73120
$-8,551
Cash flow
-22.4%
Cash-on-Cash Return
0.5%
Cap rate
0.2%
Rent to Value Ratio
Active
$495,000
4
bds
|
3
ba
|
0
sqft
|
built
2020
16405 Brookefield Dr, Edmond, OK 73013
$-961
Cash flow
-10.1%
Cash-on-Cash Return
3.9%
Cap rate
0.6%
Rent to Value Ratio
Active
$135,000
1
bds
|
1
ba
|
0
sqft
|
built
1984
931 NW 7th St, Oklahoma City, OK 73106
$-236
Cash flow
-9.1%
Cash-on-Cash Return
3.6%
Cap rate
0.8%
Rent to Value Ratio
Active
$366,000
3
bds
|
2
ba
|
0
sqft
|
built
1919
416 NW 28th St, Oklahoma City, OK 73103
$-389
Cash flow
-5.5%
Cash-on-Cash Return
4.4%
Cap rate
0.7%
Rent to Value Ratio
Active
$499,900
4
bds
|
4
ba
|
0
sqft
|
built
2017
508 Mirano Ln, Edmond, OK 73034
$-805
Cash flow
-8.4%
Cash-on-Cash Return
4.3%
Cap rate
0.6%
Rent to Value Ratio
Active
$380,000
3
bds
|
3
ba
|
0
sqft
|
built
2004
732 Tuscany Way, Edmond, OK 73034
$-776
Cash flow
-10.7%
Cash-on-Cash Return
3.8%
Cap rate
0.6%
Rent to Value Ratio
Active
$365,000
4
bds
|
3
ba
|
0
sqft
|
built
1983
904 Carfax Rd, Edmond, OK 73034
$-551
Cash flow
-7.9%
Cash-on-Cash Return
4.5%
Cap rate
0.7%
Rent to Value Ratio
Active
$187,000
1
bds
|
1
ba
|
0
sqft
|
built
1921
121 NW 26th St, Oklahoma City, OK 73103
$-13
Cash flow
-0.4%
Cash-on-Cash Return
5.6%
Cap rate
0.7%
Rent to Value Ratio
Active
$120,000
1
bds
|
1
ba
|
0
sqft
|
built
1982
14405 N Pennsylvania Ave, Oklahoma City, OK 73134
$-178
Cash flow
-7.7%
Cash-on-Cash Return
3.9%
Cap rate
0.8%
Rent to Value Ratio
Active
$369,000
3
bds
|
2
ba
|
0
sqft
|
built
2008
4501 NW 164th Ter, Edmond, OK 73013
$-765
Cash flow
-10.8%
Cash-on-Cash Return
3.8%
Cap rate
0.6%
Rent to Value Ratio
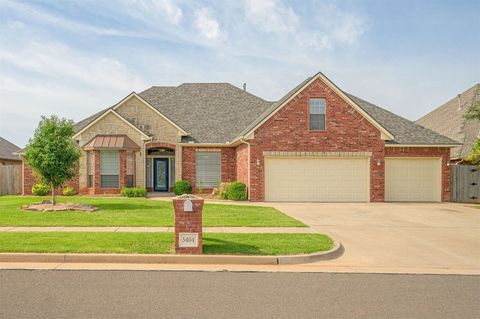
Active
$476,900
5
bds
|
3
ba
|
0
sqft
|
built
2005
5404 NW 119th St, Oklahoma City, OK 73162
$-1,036
Cash flow
-11.3%
Cash-on-Cash Return
3.1%
Cap rate
0.5%
Rent to Value Ratio
Active
$576,000
4
bds
|
3
ba
|
0
sqft
|
built
2007
20301 Flowered Meadows Way, Edmond, OK 73012
$-1,831
Cash flow
-16.6%
Cash-on-Cash Return
2.5%
Cap rate
0.4%
Rent to Value Ratio
Active
$440,000
4
bds
|
3
ba
|
0
sqft
|
built
2022
1416 Devonshire Ct, Edmond, OK 73034
$-1,283
Cash flow
-15.2%
Cash-on-Cash Return
2.8%
Cap rate
0.5%
Rent to Value Ratio
Active
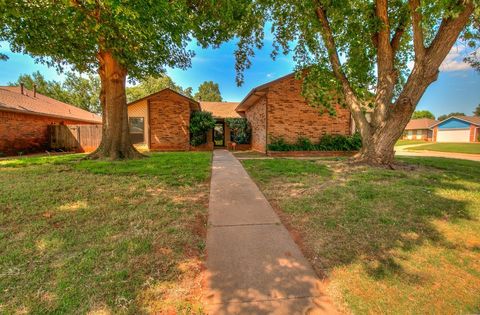
$365,000
4
bds
|
3
ba
|
0
sqft
|
built
1984
908 Carfax Rd, Edmond, OK 73034
$-689
Cash flow
-9.8%
Cash-on-Cash Return
4.0%
Cap rate
0.6%
Rent to Value Ratio
Active
$149,900
3
bds
|
2
ba
|
0
sqft
|
built
1920
1130 S Pennsylvania Ave, Oklahoma City, OK 73108
$1
Cash flow
0.0%
Cash-on-Cash Return
5.7%
Cap rate
0.7%
Rent to Value Ratio
Active
$440,000
4
bds
|
3
ba
|
0
sqft
|
built
2015
641 Geneva Dr, Edmond, OK 73025
$-1,129
Cash flow
-13.4%
Cash-on-Cash Return
3.2%
Cap rate
0.6%
Rent to Value Ratio
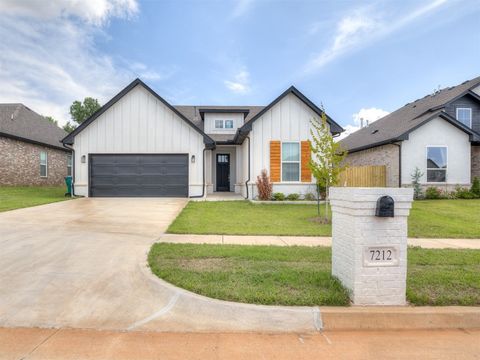
Active
$395,000
3
bds
|
2
ba
|
0
sqft
|
built
2023
7212 NW 152nd St, Edmond, OK 73013
$-911
Cash flow
-12.0%
Cash-on-Cash Return
3.5%
Cap rate
0.6%
Rent to Value Ratio
Active
$236,900
4
bds
|
3
ba
|
0
sqft
|
built
1942
2349 NW 33rd St, Oklahoma City, OK 73112
$-349
Cash flow
-7.7%
Cash-on-Cash Return
3.9%
Cap rate
0.6%
Rent to Value Ratio
Active
$172,000
3
bds
|
2
ba
|
0
sqft
|
built
1950
4020 NW 28th St, Oklahoma City, OK 73107
$-129
Cash flow
-3.9%
Cash-on-Cash Return
4.8%
Cap rate
0.7%
Rent to Value Ratio
Active
$225,000
3
bds
|
2
ba
|
0
sqft
|
built
2013
2365 NW 197th St, Edmond, OK 73012
$-287
Cash flow
-6.7%
Cash-on-Cash Return
4.7%
Cap rate
0.7%
Rent to Value Ratio
Active
$634,000
4
bds
|
3
ba
|
0
sqft
|
built
1964
400 Carpenter Trl, Arcadia, OK 73007
$-1,018
Cash flow
-8.4%
Cash-on-Cash Return
3.8%
Cap rate
0.5%
Rent to Value Ratio
Active
$338,900
4
bds
|
2
ba
|
0
sqft
|
built
2008
19105 Green Springs Dr, Edmond, OK 73012
$-603
Cash flow
-9.3%
Cash-on-Cash Return
4.1%
Cap rate
0.6%
Rent to Value Ratio
Active
$439,000
3
bds
|
3
ba
|
0
sqft
|
built
1968
11100 Willow Grove Rd, Oklahoma City, OK 73120
$-854
Cash flow
-10.1%
Cash-on-Cash Return
3.3%
Cap rate
0.5%
Rent to Value Ratio
Active
$465,000
4
bds
|
3
ba
|
0
sqft
|
built
2019
8520 NW 123rd St, Oklahoma City, OK 73142
$-771
Cash flow
-8.7%
Cash-on-Cash Return
3.7%
Cap rate
0.6%
Rent to Value Ratio
Active
$375,000
3
bds
|
2
ba
|
0
sqft
|
built
2012
2432 NW 175th St, Edmond, OK 73012
$-826
Cash flow
-11.5%
Cash-on-Cash Return
3.6%
Cap rate
0.6%
Rent to Value Ratio
Active
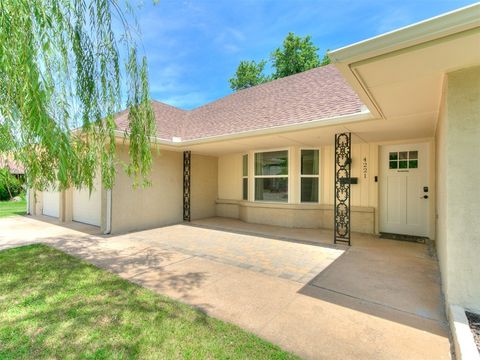
$350,000
4
bds
|
2
ba
|
0
sqft
|
built
1960
4221 NW 60th Pl, Oklahoma City, OK 73112
$-636
Cash flow
-9.5%
Cash-on-Cash Return
3.5%
Cap rate
0.5%
Rent to Value Ratio
Active
$244,900
3
bds
|
2
ba
|
0
sqft
|
built
1983
1405 Creston Way, Edmond, OK 73012
$-231
Cash flow
-4.9%
Cash-on-Cash Return
5.1%
Cap rate
0.7%
Rent to Value Ratio
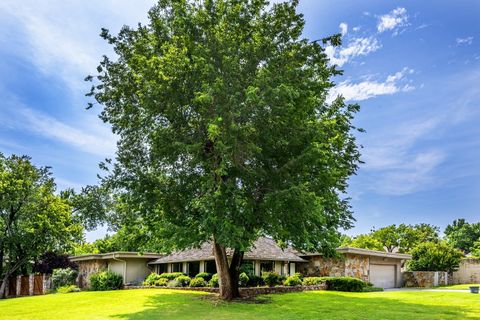
Active
$497,000
3
bds
|
3
ba
|
0
sqft
|
built
1975
2933 Browne Stone Rd, Oklahoma City, OK 73120
$-613
Cash flow
-6.4%
Cash-on-Cash Return
4.2%
Cap rate
0.6%
Rent to Value Ratio
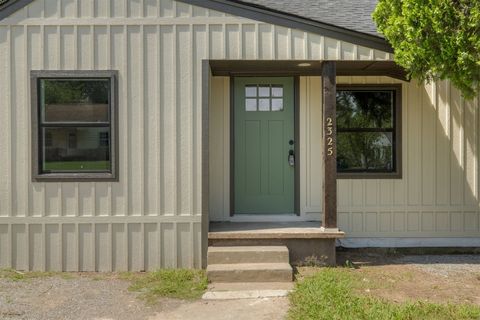
Active
$160,000
3
bds
|
1
ba
|
0
sqft
|
built
1940
2325 SW Binkley St, Oklahoma City, OK 73119
$-49
Cash flow
-1.6%
Cash-on-Cash Return
5.3%
Cap rate
0.7%
Rent to Value Ratio
Active
$135,000
3
bds
|
1
ba
|
0
sqft
|
built
1952
239 SE 48th St, Oklahoma City, OK 73129
$104
Cash flow
4.0%
Cash-on-Cash Return
6.6%
Cap rate
0.8%
Rent to Value Ratio
Active
$235,000
3
bds
|
2
ba
|
0
sqft
|
built
1962
5717 NW 31st Ter, Oklahoma City, OK 73122
$-186
Cash flow
-4.1%
Cash-on-Cash Return
4.7%
Cap rate
0.7%
Rent to Value Ratio
Active
$457,900
6
bds
|
4
ba
|
0
sqft
|
built
1910
312 NW 24th St, Oklahoma City, OK 73103
$-994
Cash flow
-11.3%
Cash-on-Cash Return
3.1%
Cap rate
0.4%
Rent to Value Ratio
Active
$219,900
3
bds
|
1
ba
|
0
sqft
|
built
1944
2332 NW 31st St, Oklahoma City, OK 73112
$-238
Cash flow
-5.6%
Cash-on-Cash Return
4.4%
Cap rate
0.6%
Rent to Value Ratio
Active
$360,000
3
bds
|
2
ba
|
0
sqft
|
built
2013
8401 NW 140th St, Oklahoma City, OK 73142
$-474
Cash flow
-6.9%
Cash-on-Cash Return
4.1%
Cap rate
0.6%
Rent to Value Ratio