Oklahoma County Investment Properties for Sale
Browse homes for sale and investment properties in Oklahoma County. Refine your search by price, property type, or more.
Best cash flowing properties in Oklahoma County
Active
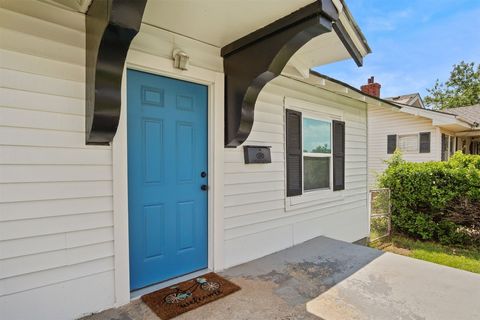
$139,900
3
bds
|
2
ba
|
0
sqft
|
built
1928
940 NE 32nd St, Oklahoma City, OK 73105
$246
Cash flow
9.2%
Cash-on-Cash Return
7.8%
Cap rate
1.0%
Rent to Value Ratio
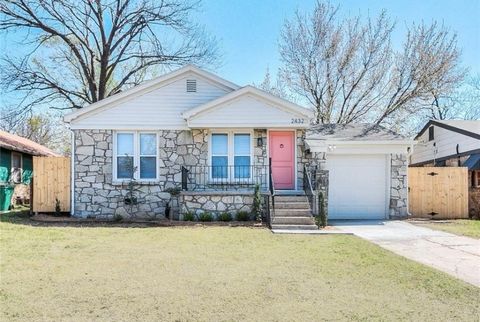
Active
$155,000
2
bds
|
1
ba
|
0
sqft
|
built
1948
2432 NW 36th St, Oklahoma City, OK 73112
$211
Cash flow
7.1%
Cash-on-Cash Return
7.3%
Cap rate
1.0%
Rent to Value Ratio
2,111 out of 2,931 properties for sale in Oklahoma County
Limited Results Shown
Create a free account, or log in to reveal all property listings and enjoy the complete experience.
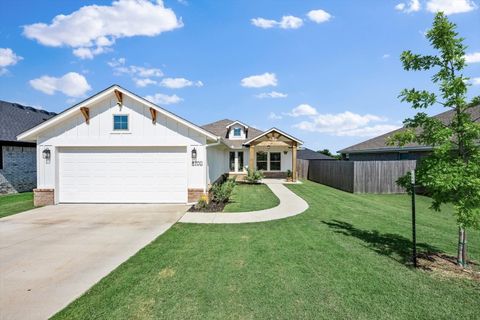
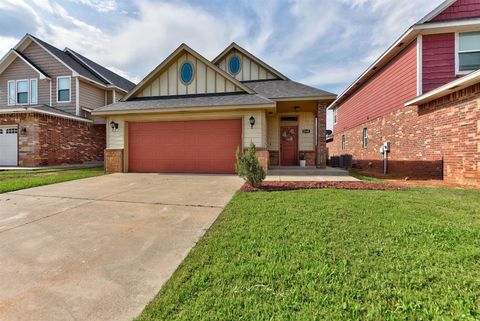
Active
$305,000
3
bds
|
2
ba
|
0
sqft
|
built
2023
8700 Ricard Dr, Oklahoma City, OK 73135
$-413
Cash flow
-7.1%
Cash-on-Cash Return
4.1%
Cap rate
0.7%
Rent to Value Ratio
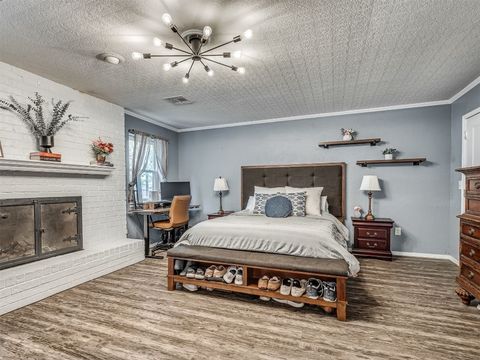
Active
$275,000
3
bds
|
2
ba
|
0
sqft
|
built
1937
2505 NW 25th St, Oklahoma City, OK 73107
$-201
Cash flow
-3.8%
Cash-on-Cash Return
4.8%
Cap rate
0.7%
Rent to Value Ratio
Active
$255,000
3
bds
|
2
ba
|
0
sqft
|
built
2017
8340 NW 137th St, Oklahoma City, OK 73142
$-223
Cash flow
-4.6%
Cash-on-Cash Return
4.6%
Cap rate
0.7%
Rent to Value Ratio
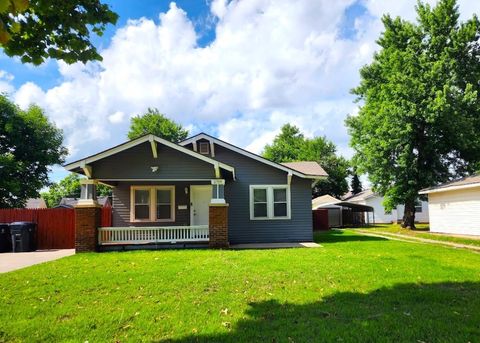
Active
$178,000
2
bds
|
1
ba
|
0
sqft
|
built
1920
2719 NW 14th St, Oklahoma City, OK 73107
$-105
Cash flow
-3.1%
Cash-on-Cash Return
5.0%
Cap rate
0.7%
Rent to Value Ratio
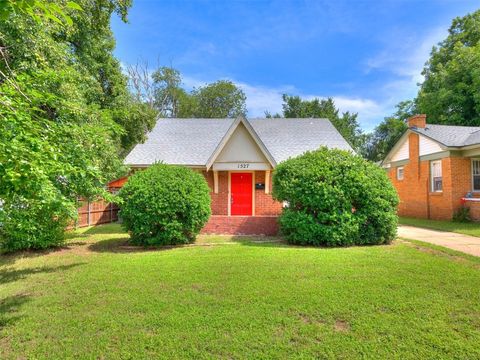
Active
$210,000
3
bds
|
2
ba
|
0
sqft
|
built
1926
1527 NW 43rd St, Oklahoma City, OK 73118
$-208
Cash flow
-5.2%
Cash-on-Cash Return
4.5%
Cap rate
0.7%
Rent to Value Ratio
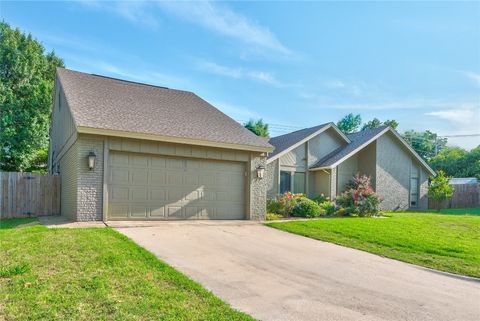
Active
$369,900
4
bds
|
4
ba
|
0
sqft
|
built
1979
6348 Hyde Park Dr, Oklahoma City, OK 73162
$-471
Cash flow
-6.6%
Cash-on-Cash Return
4.1%
Cap rate
0.7%
Rent to Value Ratio
Active
$425,000
3
bds
|
3
ba
|
0
sqft
|
built
2013
17333 Shadow Hawk Ln, Edmond, OK 73012
$-703
Cash flow
-8.6%
Cash-on-Cash Return
4.3%
Cap rate
0.7%
Rent to Value Ratio
Active
$350,000
7
bds
|
4
ba
|
0
sqft
|
built
1949
6101 S Douglas Ave, Oklahoma City, OK 73139
$-690
Cash flow
-10.3%
Cash-on-Cash Return
3.3%
Cap rate
0.4%
Rent to Value Ratio
Active
$155,000
2
bds
|
1
ba
|
0
sqft
|
built
1948
2432 NW 36th St, Oklahoma City, OK 73112
$211
Cash flow
7.1%
Cash-on-Cash Return
7.3%
Cap rate
1.0%
Rent to Value Ratio
Active
$385,000
3
bds
|
3
ba
|
0
sqft
|
built
2003
2701 NW 151st St, Edmond, OK 73013
$-925
Cash flow
-12.5%
Cash-on-Cash Return
3.4%
Cap rate
0.6%
Rent to Value Ratio
Active
$342,500
3
bds
|
2
ba
|
0
sqft
|
built
2014
1012 NW 191st St, Edmond, OK 73012
$-592
Cash flow
-9.0%
Cash-on-Cash Return
4.2%
Cap rate
0.6%
Rent to Value Ratio
Active
$547,000
4
bds
|
3
ba
|
0
sqft
|
built
2015
1508 Station St, Edmond, OK 73034
$-910
Cash flow
-8.7%
Cash-on-Cash Return
4.3%
Cap rate
0.6%
Rent to Value Ratio
Active
$500,000
2
bds
|
3
ba
|
0
sqft
|
built
2005
3424 Stone Brook Ct, Oklahoma City, OK 73120
$-997
Cash flow
-10.4%
Cash-on-Cash Return
3.3%
Cap rate
0.6%
Rent to Value Ratio
Active
$269,900
3
bds
|
2
ba
|
0
sqft
|
built
2014
2945 NW 181st St, Edmond, OK 73012
$-558
Cash flow
-10.8%
Cash-on-Cash Return
3.8%
Cap rate
0.6%
Rent to Value Ratio
Active
$400,000
3
bds
|
3
ba
|
0
sqft
|
built
2003
1688 Graces Ter, Edmond, OK 73025
$-845
Cash flow
-11.0%
Cash-on-Cash Return
3.7%
Cap rate
0.6%
Rent to Value Ratio
Active
$269,000
3
bds
|
2
ba
|
0
sqft
|
built
1978
801 Belle Air Ave, Edmond, OK 73013
$-381
Cash flow
-7.4%
Cash-on-Cash Return
4.6%
Cap rate
0.7%
Rent to Value Ratio
Active
$380,000
4
bds
|
3
ba
|
0
sqft
|
built
2001
2501 Brenton Dr, Edmond, OK 73012
$-712
Cash flow
-9.8%
Cash-on-Cash Return
4.0%
Cap rate
0.6%
Rent to Value Ratio
Active
$349,900
4
bds
|
3
ba
|
0
sqft
|
built
1985
4113 Old Farm Rd, Oklahoma City, OK 73120
$-575
Cash flow
-8.6%
Cash-on-Cash Return
3.7%
Cap rate
0.6%
Rent to Value Ratio
Active
$175,000
3
bds
|
2
ba
|
0
sqft
|
built
1976
4904 Washington Sq, Oklahoma City, OK 73135
$108
Cash flow
3.2%
Cash-on-Cash Return
6.4%
Cap rate
0.9%
Rent to Value Ratio
Active
$950,000
5
bds
|
6
ba
|
0
sqft
|
built
1991
6540 S Donna Ln, Oklahoma City, OK 73150
$-2,570
Cash flow
-14.1%
Cash-on-Cash Return
2.4%
Cap rate
0.4%
Rent to Value Ratio
Active
$225,000
3
bds
|
2
ba
|
0
sqft
|
built
1978
8228 NW 90th Ter, Oklahoma City, OK 73132
$-15
Cash flow
-0.3%
Cash-on-Cash Return
5.6%
Cap rate
0.8%
Rent to Value Ratio
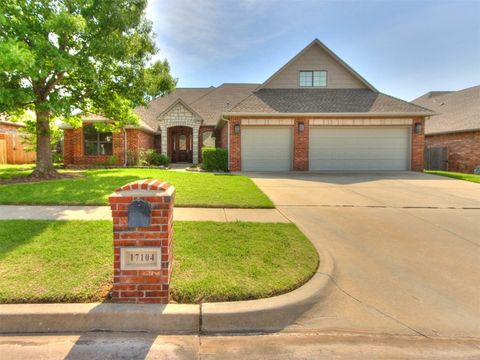
Active
$440,000
4
bds
|
4
ba
|
0
sqft
|
built
2005
17104 Wales Green Ave, Edmond, OK 73012
$-946
Cash flow
-11.2%
Cash-on-Cash Return
3.7%
Cap rate
0.6%
Rent to Value Ratio
Active
$1,250,000
6
bds
|
5
ba
|
0
sqft
|
built
2006
1918 Winding Ridge Rd, Edmond, OK 73034
$-4,264
Cash flow
-17.8%
Cash-on-Cash Return
2.2%
Cap rate
0.4%
Rent to Value Ratio
Active
$289,900
3
bds
|
2
ba
|
0
sqft
|
built
2020
6712 NW 155th St, Edmond, OK 73013
$-639
Cash flow
-11.5%
Cash-on-Cash Return
3.6%
Cap rate
0.6%
Rent to Value Ratio
Active
$499,900
3
bds
|
3
ba
|
0
sqft
|
built
2020
4304 NW 154th Pl, Edmond, OK 73013
$-987
Cash flow
-10.3%
Cash-on-Cash Return
3.9%
Cap rate
0.6%
Rent to Value Ratio
Active
$3,000,000
5
bds
|
6
ba
|
0
sqft
|
built
1985
4005 NE 122nd St, Edmond, OK 73013
$-14,729
Cash flow
-25.6%
Cash-on-Cash Return
0.4%
Cap rate
0.1%
Rent to Value Ratio
Active
$810,000
4
bds
|
6
ba
|
0
sqft
|
built
1992
2817 Sweetbriar, Edmond, OK 73034
$-1,390
Cash flow
-9.0%
Cash-on-Cash Return
3.6%
Cap rate
0.6%
Rent to Value Ratio
Active
$875,000
3
bds
|
4
ba
|
0
sqft
|
built
2008
223 NE 4th St, Oklahoma City, OK 73104
$-2,668
Cash flow
-15.9%
Cash-on-Cash Return
2.0%
Cap rate
0.5%
Rent to Value Ratio
Active
$284,950
3
bds
|
2
ba
|
0
sqft
|
built
2012
18400 Haslemere Ln, Edmond, OK 73012
$-283
Cash flow
-5.2%
Cash-on-Cash Return
4.5%
Cap rate
0.7%
Rent to Value Ratio
Active
$239,990
4
bds
|
2
ba
|
0
sqft
|
built
1971
8533 SW 76th St, Oklahoma City, OK 73169
$-369
Cash flow
-8.0%
Cash-on-Cash Return
3.8%
Cap rate
0.6%
Rent to Value Ratio
Active
$795,000
4
bds
|
4
ba
|
0
sqft
|
built
2022
1205 NW 42nd St, Oklahoma City, OK 73118
$-1,965
Cash flow
-12.9%
Cash-on-Cash Return
2.7%
Cap rate
0.5%
Rent to Value Ratio
Active
$430,000
4
bds
|
3
ba
|
0
sqft
|
built
2018
12917 Treemont Ln, Oklahoma City, OK 73142
$-824
Cash flow
-10.0%
Cash-on-Cash Return
3.4%
Cap rate
0.6%
Rent to Value Ratio
Active
$535,000
4
bds
|
6
ba
|
0
sqft
|
built
2023
19608 Dalemead Way, Edmond, OK 73012
$-1,254
Cash flow
-12.2%
Cash-on-Cash Return
3.5%
Cap rate
0.6%
Rent to Value Ratio
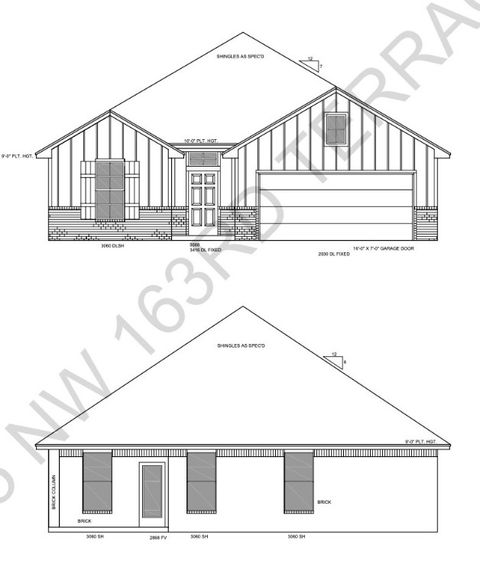
Active
$319,196
3
bds
|
2
ba
|
0
sqft
|
built
2025
8325 NW 163rd St, Edmond, OK 73013
$-440
Cash flow
-7.2%
Cash-on-Cash Return
4.6%
Cap rate
0.7%
Rent to Value Ratio
Active
$139,900
3
bds
|
2
ba
|
0
sqft
|
built
1928
940 NE 32nd St, Oklahoma City, OK 73105
$246
Cash flow
9.2%
Cash-on-Cash Return
7.8%
Cap rate
1.0%
Rent to Value Ratio
Active
$511,900
4
bds
|
3
ba
|
0
sqft
|
built
2023
209 Pont Neuf Ct, Edmond, OK 73034
$-736
Cash flow
-7.5%
Cash-on-Cash Return
4.0%
Cap rate
0.7%
Rent to Value Ratio
Active
$89,000
2
bds
|
1
ba
|
0
sqft
|
built
1953
9424 NE 28th St, Oklahoma City, OK 73141
$136
Cash flow
8.0%
Cash-on-Cash Return
7.5%
Cap rate
1.0%
Rent to Value Ratio
Active
$185,000
3
bds
|
1
ba
|
0
sqft
|
built
1954
3012 NW 67th St, Oklahoma City, OK 73116
$-79
Cash flow
-2.2%
Cash-on-Cash Return
5.2%
Cap rate
0.8%
Rent to Value Ratio
Active
$109,900
2
bds
|
2
ba
|
0
sqft
|
built
1984
11130 Stratford Dr, Oklahoma City, OK 73120
$22
Cash flow
1.0%
Cash-on-Cash Return
5.9%
Cap rate
1.1%
Rent to Value Ratio
Active
$335,000
3
bds
|
3
ba
|
0
sqft
|
built
2006
1205 NW 190th Pl, Edmond, OK 73012
$-683
Cash flow
-10.6%
Cash-on-Cash Return
3.8%
Cap rate
0.6%
Rent to Value Ratio