Oklahoma County Investment Properties for Sale
Browse homes for sale and investment properties in Oklahoma County. Refine your search by price, property type, or more.
Best cash flowing properties in Oklahoma County
Active
$100,000
2
bds
|
2
ba
|
0
sqft
|
built
1985
2720 SW 74th St, Oklahoma City, OK 73159
$578
Cash flow
30.2%
Cash-on-Cash Return
12.6%
Cap rate
1.6%
Rent to Value Ratio
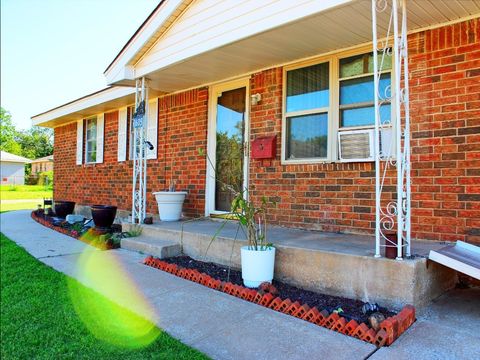
Active
$159,000
3
bds
|
1
ba
|
0
sqft
|
built
1930
334 SE 24th St, Oklahoma City, OK 73129
$201
Cash flow
6.6%
Cash-on-Cash Return
7.2%
Cap rate
1.0%
Rent to Value Ratio
2,111 out of 2,931 properties for sale in Oklahoma County
Limited Results Shown
Create a free account, or log in to reveal all property listings and enjoy the complete experience.
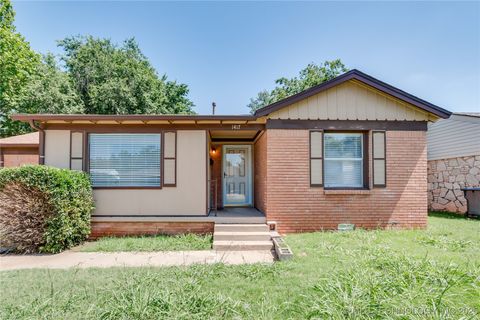
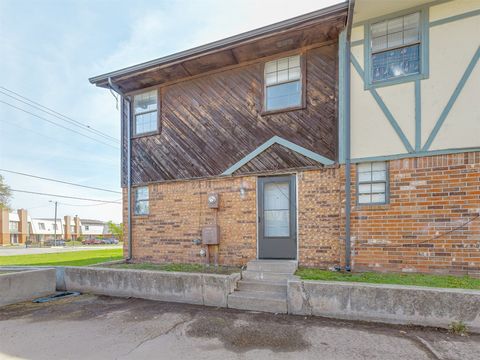
Active
$169,950
2
bds
|
1
ba
|
902
sqft
|
built
1950
1417 Downing St, Oklahoma City, OK 73120
$58
Cash flow
1.8%
Cash-on-Cash Return
6.1%
Cap rate
0.8%
Rent to Value Ratio
Active
$196,000
3
bds
|
1
ba
|
0
sqft
|
built
1955
3700 N Land Ave, Oklahoma City, OK 73112
$-101
Cash flow
-2.7%
Cash-on-Cash Return
5.1%
Cap rate
0.8%
Rent to Value Ratio
Active
$899,000
3
bds
|
5
ba
|
0
sqft
|
built
1961
8700 Waverly Ave, Oklahoma City, OK 73120
$-2,810
Cash flow
-16.3%
Cash-on-Cash Return
1.9%
Cap rate
0.3%
Rent to Value Ratio
Active
$175,000
2
bds
|
2
ba
|
0
sqft
|
built
1978
2920 Colonial Ln, Edmond, OK 73013
$-260
Cash flow
-7.8%
Cash-on-Cash Return
4.5%
Cap rate
0.8%
Rent to Value Ratio
Active
$239,900
3
bds
|
2
ba
|
0
sqft
|
built
1978
6708 Lyrewood Cir, Oklahoma City, OK 73132
$-131
Cash flow
-2.8%
Cash-on-Cash Return
5.0%
Cap rate
0.7%
Rent to Value Ratio
Active
$189,000
3
bds
|
2
ba
|
0
sqft
|
built
2002
2644 S Land Ave, Oklahoma City, OK 73108
$-16
Cash flow
-0.4%
Cash-on-Cash Return
5.6%
Cap rate
0.7%
Rent to Value Ratio
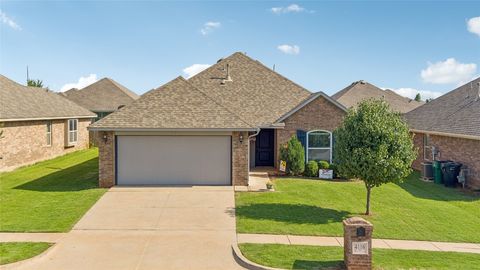
Active
$269,500
3
bds
|
2
ba
|
0
sqft
|
built
2017
4116 NW 154th St, Edmond, OK 73013
$-453
Cash flow
-8.8%
Cash-on-Cash Return
4.2%
Cap rate
0.7%
Rent to Value Ratio
Active
$226,000
3
bds
|
2
ba
|
0
sqft
|
built
1968
2821 SW 86th St, Oklahoma City, OK 73159
$-168
Cash flow
-3.9%
Cash-on-Cash Return
4.8%
Cap rate
0.7%
Rent to Value Ratio
Active
$245,000
3
bds
|
2
ba
|
0
sqft
|
built
2004
21854 Meadow Mist Cir, Edmond, OK 73012
$-367
Cash flow
-7.8%
Cash-on-Cash Return
4.5%
Cap rate
0.7%
Rent to Value Ratio
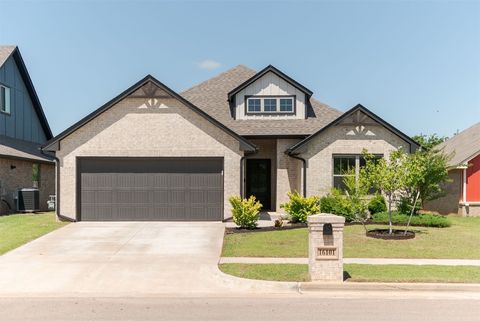
Active
$328,000
3
bds
|
2
ba
|
0
sqft
|
built
2021
16101 Villa Valeria Way, Edmond, OK 73013
$-723
Cash flow
-11.5%
Cash-on-Cash Return
3.6%
Cap rate
0.6%
Rent to Value Ratio
Active
$749,900
4
bds
|
5
ba
|
0
sqft
|
built
2014
4925 Shades Bridge Rd, Edmond, OK 73034
$-1,772
Cash flow
-12.3%
Cash-on-Cash Return
2.8%
Cap rate
0.5%
Rent to Value Ratio
Active
$697,000
4
bds
|
3
ba
|
0
sqft
|
built
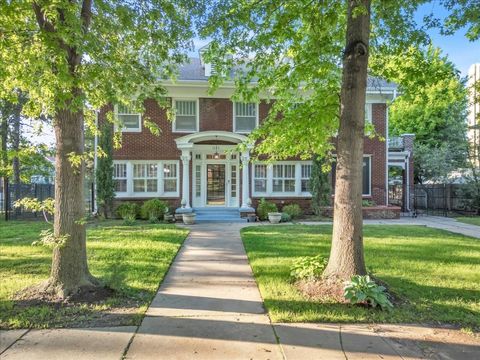
1925
1223 NW 20th St, Oklahoma City, OK 73106
$-2,003
Cash flow
-15.0%
Cash-on-Cash Return
2.2%
Cap rate
0.4%
Rent to Value Ratio
Active
$1,500,000
8
bds
|
8
ba
|
0
sqft
|
built
1930
506 SW 24th St, Oklahoma City, OK 73109
$-5,923
Cash flow
-20.6%
Cash-on-Cash Return
0.9%
Cap rate
0.1%
Rent to Value Ratio
Active
$279,900
3
bds
|
2
ba
|
0
sqft
|
built
1959
3957 NW 58th Ter, Oklahoma City, OK 73112
$-402
Cash flow
-7.5%
Cash-on-Cash Return
4.0%
Cap rate
0.6%
Rent to Value Ratio
Active
$644,500
3
bds
|
3
ba
|
0
sqft
|
built
2022
3824 Library Ln, Edmond, OK 73034
$-1,632
Cash flow
-13.2%
Cash-on-Cash Return
3.2%
Cap rate
0.5%
Rent to Value Ratio
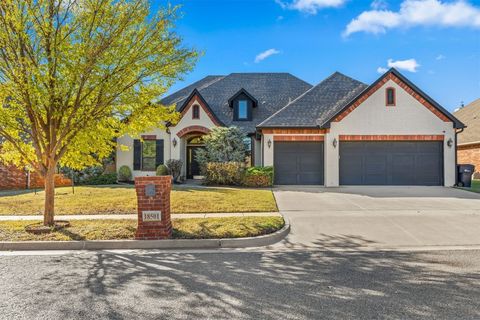
Active
$449,000
3
bds
|
3
ba
|
0
sqft
|
built
2012
18501 Salvador Rd, Edmond, OK 73012
$-753
Cash flow
-8.7%
Cash-on-Cash Return
3.7%
Cap rate
0.6%
Rent to Value Ratio
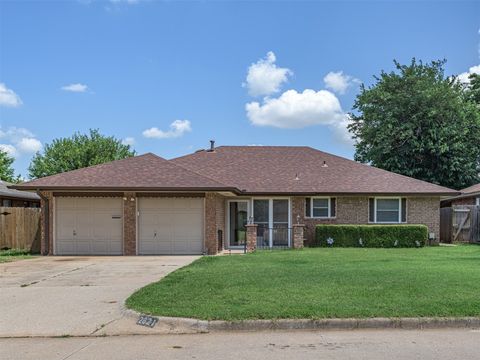
Active
$329,000
3
bds
|
2
ba
|
0
sqft
|
built
1978
2104 Brookhaven Dr, Edmond, OK 73034
$-592
Cash flow
-9.4%
Cash-on-Cash Return
4.1%
Cap rate
0.5%
Rent to Value Ratio
Active
$335,000
3
bds
|
2
ba
|
0
sqft
|
built
2019
17817 Morning Sky Ct, Edmond, OK 73012
$-547
Cash flow
-8.5%
Cash-on-Cash Return
3.7%
Cap rate
0.6%
Rent to Value Ratio
Active
$324,900
3
bds
|
2
ba
|
0
sqft
|
built
1958
3205 NW 62nd St, Oklahoma City, OK 73112
$-633
Cash flow
-10.2%
Cash-on-Cash Return
3.3%
Cap rate
0.5%
Rent to Value Ratio
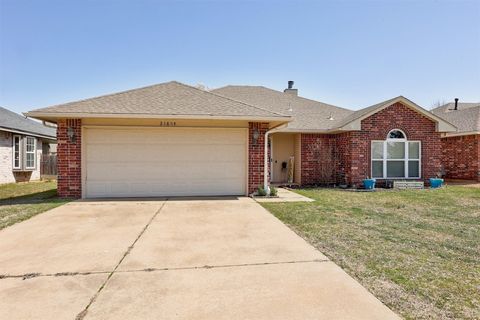
Active
$249,900
3
bds
|
2
ba
|
0
sqft
|
built
2011
1609 NW 144th Ter, Edmond, OK 73013
$-433
Cash flow
-9.0%
Cash-on-Cash Return
4.2%
Cap rate
0.6%
Rent to Value Ratio
Active
$165,000
4
bds
|
1
ba
|
0
sqft
|
built
1960
321 NW 80th St, Oklahoma City, OK 73114
$130
Cash flow
4.1%
Cash-on-Cash Return
6.6%
Cap rate
0.8%
Rent to Value Ratio
Active
$334,900
3
bds
|
2
ba
|
0
sqft
|
built
2000
1800 NW 161st Pl, Edmond, OK 73013
$-982
Cash flow
-15.3%
Cash-on-Cash Return
2.7%
Cap rate
0.5%
Rent to Value Ratio
Active
$424,900
3
bds
|
3
ba
|
0
sqft
|
built
2015
917 NW 186th St, Edmond, OK 73012
$-815
Cash flow
-10.0%
Cash-on-Cash Return
4.0%
Cap rate
0.7%
Rent to Value Ratio
Active
$159,000
3
bds
|
1
ba
|
0
sqft
|
built
1930
334 SE 24th St, Oklahoma City, OK 73129
$201
Cash flow
6.6%
Cash-on-Cash Return
7.2%
Cap rate
1.0%
Rent to Value Ratio
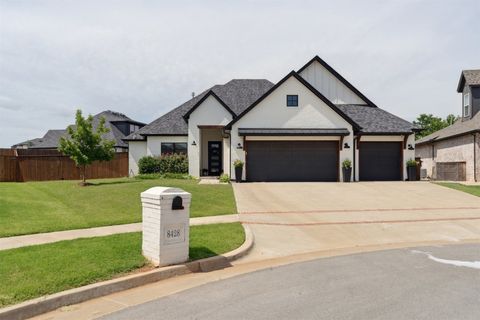
Active
$549,900
4
bds
|
3
ba
|
0
sqft
|
built
2020
8428 NW 132nd St, Oklahoma City, OK 73142
$-1,240
Cash flow
-11.8%
Cash-on-Cash Return
3.0%
Cap rate
0.5%
Rent to Value Ratio
Active
$189,900
3
bds
|
1
ba
|
0
sqft
|
built
1959
2837 SW 63rd St, Oklahoma City, OK 73159
$-79
Cash flow
-2.2%
Cash-on-Cash Return
5.2%
Cap rate
0.7%
Rent to Value Ratio
Active
$574,000
5
bds
|
4
ba
|
0
sqft
|
built
2001
1608 Sunset Ln, Oklahoma City, OK 73127
$-915
Cash flow
-8.3%
Cash-on-Cash Return
3.8%
Cap rate
0.6%
Rent to Value Ratio
Active
$225,000
3
bds
|
1
ba
|
0
sqft
|
built
1929
1828 NW 40th St, Oklahoma City, OK 73118
$-46
Cash flow
-1.1%
Cash-on-Cash Return
5.4%
Cap rate
0.8%
Rent to Value Ratio
Active
$390,000
4
bds
|
4
ba
|
0
sqft
|
built
1990
2404 Pawnee Xing, Edmond, OK 73034
$-271
Cash flow
-3.6%
Cash-on-Cash Return
4.8%
Cap rate
0.7%
Rent to Value Ratio
Active
$295,000
2
bds
|
2
ba
|
0
sqft
|
built
1957
9908 Harbor Dr, Oklahoma City, OK 73162
$-492
Cash flow
-8.7%
Cash-on-Cash Return
3.7%
Cap rate
0.5%
Rent to Value Ratio
Active
$445,000
4
bds
|
2
ba
|
0
sqft
|
built
1967
2617 NW 58th St, Oklahoma City, OK 73112
$-951
Cash flow
-11.1%
Cash-on-Cash Return
3.1%
Cap rate
0.5%
Rent to Value Ratio
Active
$450,000
3
bds
|
3
ba
|
0
sqft
|
built
1999
3809 Kings Ct, Oklahoma City, OK 73121
$-888
Cash flow
-10.3%
Cash-on-Cash Return
3.3%
Cap rate
0.4%
Rent to Value Ratio
Active
$350,000
4
bds
|
3
ba
|
0
sqft
|
built
2006
1840 Kamber Ter, Edmond, OK 73003
$-725
Cash flow
-10.8%
Cash-on-Cash Return
3.8%
Cap rate
0.6%
Rent to Value Ratio
Active
$100,000
2
bds
|
2
ba
|
0
sqft
|
built
1985
2720 SW 74th St, Oklahoma City, OK 73159
$578
Cash flow
30.2%
Cash-on-Cash Return
12.6%
Cap rate
1.6%
Rent to Value Ratio
Active
$765,000
4
bds
|
3
ba
|
0
sqft
|
built
1978
11209 Thorn Ridge Rd, Oklahoma City, OK 73120
$-1,000
Cash flow
-6.8%
Cash-on-Cash Return
4.1%
Cap rate
0.6%
Rent to Value Ratio
Active
$460,000
4
bds
|
4
ba
|
0
sqft
|
built
2012
13328 Apple Valley Dr, Oklahoma City, OK 73120
$-849
Cash flow
-9.6%
Cash-on-Cash Return
3.5%
Cap rate
0.5%
Rent to Value Ratio
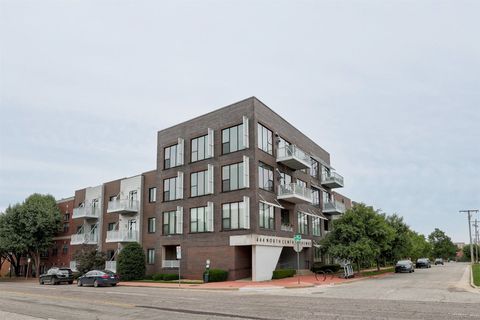
Active
$285,000
2
bds
|
2
ba
|
0
sqft
|
built
2008
444 N Central Ave, Oklahoma City, OK 73104
$-980
Cash flow
-17.9%
Cash-on-Cash Return
2.1%
Cap rate
0.6%
Rent to Value Ratio
Active
$120,000
3
bds
|
1
ba
|
0
sqft
|
built
1969
2605 N Kate Ave, Oklahoma City, OK 73111
$167
Cash flow
7.3%
Cash-on-Cash Return
7.4%
Cap rate
0.9%
Rent to Value Ratio
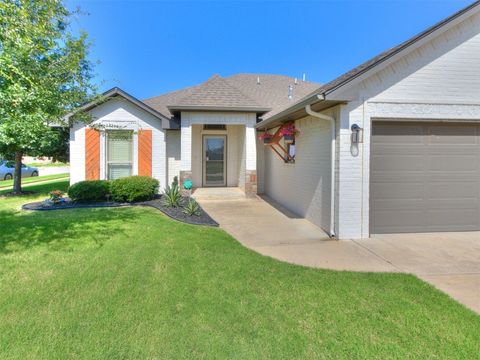
Active
$339,970
3
bds
|
3
ba
|
0
sqft
|
built
2016
7313 Jack Dr, Oklahoma City, OK 73132
$-363
Cash flow
-5.6%
Cash-on-Cash Return
4.4%
Cap rate
0.7%
Rent to Value Ratio
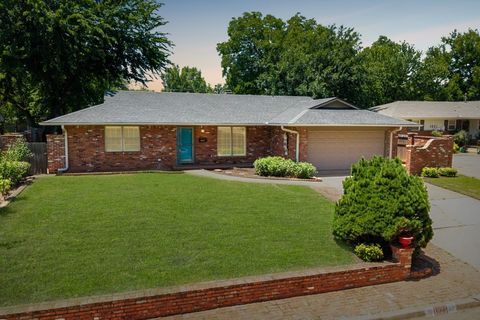
Active
$252,500
3
bds
|
2
ba
|
0
sqft
|
built
1963
1825 Kings Rd, Edmond, OK 73013
$-286
Cash flow
-5.9%
Cash-on-Cash Return
4.9%
Cap rate
0.7%
Rent to Value Ratio