Sugar Land, TX Investment Properties for Sale
Browse homes for sale and investment properties in Sugar Land, TX. Refine your search by price, property type, or more.
Best cash flowing properties in Sugar Land, TX

Active
$293,000
3
bds
|
0
ba
|
1,329
sqft
|
built
1983
3938 Kitchen Hill Ln, Sugar Land, TX 77479
$-200
Cash flow
-3.6%
Cash-on-Cash Return
5.4%
Cap rate
0.7%
Rent to Value Ratio

Active
$224,000
2
bds
|
0
ba
|
1,013
sqft
|
built
1982
17002 Rippling Mill Dr, Sugar Land, TX 77498
$-385
Cash flow
-9.0%
Cash-on-Cash Return
4.2%
Cap rate
0.8%
Rent to Value Ratio
420 out of 427 properties for sale in Sugar Land, TX
Limited Results Shown
Create a free account, or log in to reveal all property listings and enjoy the complete experience.
Active
$389,000
4
bds
|
0
ba
|
2,415
sqft
|
built
2004
10326 Low Bridge Ln, Sugar Land, TX 77498
$-954
Cash flow
-12.8%
Cash-on-Cash Return
3.3%
Cap rate
0.6%
Rent to Value Ratio
Active
$749,900
5
bds
|
0
ba
|
3,674
sqft
|
built
1990
3402 Haywood Ct, Sugar Land, TX 77478
$-1,905
Cash flow
-13.3%
Cash-on-Cash Return
3.2%
Cap rate
0.6%
Rent to Value Ratio
Active
$558,800
4
bds
|
0
ba
|
3,294
sqft
|
built
2008
3818 Orchard Springs Ct, Sugar Land, TX 77479
$-773
Cash flow
-7.2%
Cash-on-Cash Return
4.6%
Cap rate
0.6%
Rent to Value Ratio
Active
$1,850,000
6
bds
|
0
ba
|
6,793
sqft
|
built
2008
61 Open Sands Ct, Sugar Land, TX 77479
$-5,340
Cash flow
-15.1%
Cash-on-Cash Return
2.2%
Cap rate
0.5%
Rent to Value Ratio
Active
$280,000
3
bds
|
2.5
ba
|
1,620
sqft
|
built
1999
13415 Naples Bridge Rd, Sugar Land, TX 77498
$-403
Cash flow
-7.5%
Cash-on-Cash Return
4.0%
Cap rate
0.7%
Rent to Value Ratio
Active
$330,000
3
bds
|
0
ba
|
1,995
sqft
|
built
1997
4514 Casey Cir, Sugar Land, TX 77479
$-649
Cash flow
-10.3%
Cash-on-Cash Return
3.3%
Cap rate
0.7%
Rent to Value Ratio
Active
$1,110,000
5
bds
|
0
ba
|
4,858
sqft
|
built
2006
7010 Mc Clellan Ln, Sugar Land, TX 77479
$-4,791
Cash flow
-22.5%
Cash-on-Cash Return
1.1%
Cap rate
0.4%
Rent to Value Ratio

Active
$489,000
4
bds
|
3.5
ba
|
3,092
sqft
|
built
1978
2714 Sugarwood Dr, Sugar Land, TX 77478
$-891
Cash flow
-9.5%
Cash-on-Cash Return
3.5%
Cap rate
0.6%
Rent to Value Ratio
Active
$249,900
3
bds
|
0
ba
|
1,508
sqft
|
built
1977
1222 Ashwood Dr, Sugar Land, TX 77498
$-443
Cash flow
-9.2%
Cash-on-Cash Return
4.1%
Cap rate
0.7%
Rent to Value Ratio
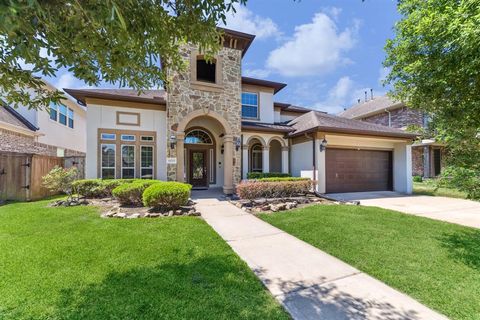
Active
$898,888
4
bds
|
0
ba
|
3,980
sqft
|
built
2013
6015 Turner Shadow Ln, Sugar Land, TX 77479
$-3,226
Cash flow
-18.7%
Cash-on-Cash Return
2.0%
Cap rate
0.5%
Rent to Value Ratio

Active
$750,000
3
bds
|
0
ba
|
2,697
sqft
|
built
2016
67 Quiet Vista Dr, Sugar Land, TX 77498
$-3,319
Cash flow
-23.1%
Cash-on-Cash Return
1.0%
Cap rate
0.4%
Rent to Value Ratio

Active
$215,000
3
bds
|
0
ba
|
1,283
sqft
|
built
1983
2510 Grants Lake Blvd, Sugar Land, TX 77479
$-688
Cash flow
-16.7%
Cash-on-Cash Return
2.4%
Cap rate
0.8%
Rent to Value Ratio

Active
$480,000
5
bds
|
0
ba
|
3,280
sqft
|
built
1995
14314 Strutton Dr, Sugar Land, TX 77498
$-1,299
Cash flow
-14.1%
Cash-on-Cash Return
3.0%
Cap rate
0.6%
Rent to Value Ratio
Active
$289,000
3
bds
|
0
ba
|
1,934
sqft
|
built
1988
1915 Summerfield Pl, Sugar Land, TX 77478
$-576
Cash flow
-10.4%
Cash-on-Cash Return
3.9%
Cap rate
0.7%
Rent to Value Ratio
Active
$739,900
5
bds
|
0
ba
|
4,646
sqft
|
built
1993
16 Treverstone Ct, Sugar Land, TX 77479
$-2,532
Cash flow
-17.9%
Cash-on-Cash Return
2.2%
Cap rate
0.5%
Rent to Value Ratio
Active
$565,000
5
bds
|
0
ba
|
4,460
sqft
|
built
2007
12522 E Nantucket Rd, Sugar Land, TX 77478
$-1,719
Cash flow
-15.9%
Cash-on-Cash Return
2.6%
Cap rate
0.5%
Rent to Value Ratio

Active
$399,990
3
bds
|
0
ba
|
1,835
sqft
|
built
1970
154 Camellia St, Sugar Land, TX 77478
$-570
Cash flow
-7.4%
Cash-on-Cash Return
4.6%
Cap rate
0.7%
Rent to Value Ratio

Active
$599,000
4
bds
|
0
ba
|
3,426
sqft
|
built
1989
2715 Oakland Dr, Sugar Land, TX 77479
$-1,316
Cash flow
-11.5%
Cash-on-Cash Return
3.6%
Cap rate
0.7%
Rent to Value Ratio
Active
$425,000
4
bds
|
0
ba
|
2,089
sqft
|
built
1984
3327 Larkwood Ln, Sugar Land, TX 77479
$-570
Cash flow
-7.0%
Cash-on-Cash Return
4.7%
Cap rate
0.6%
Rent to Value Ratio
Active
$765,000
5
bds
|
0
ba
|
4,603
sqft
|
built
1985
102 Blancroft Ct, Sugar Land, TX 77478
$-2,544
Cash flow
-17.4%
Cash-on-Cash Return
2.3%
Cap rate
0.5%
Rent to Value Ratio
Active
$417,500
3
bds
|
0
ba
|
2,395
sqft
|
built
1990
6719 Shady Ln, Sugar Land, TX 77479
$-1,160
Cash flow
-14.5%
Cash-on-Cash Return
2.9%
Cap rate
0.6%
Rent to Value Ratio

Active
$495,000
4
bds
|
0
ba
|
3,719
sqft
|
built
2001
13214 Dusty Grove Ln, Sugar Land, TX 77498
$-1,359
Cash flow
-14.3%
Cash-on-Cash Return
3.0%
Cap rate
0.6%
Rent to Value Ratio
Active
$375,000
4
bds
|
0
ba
|
2,454
sqft
|
built
1984
3714 Green Fields Dr, Sugar Land, TX 77479
$-941
Cash flow
-13.1%
Cash-on-Cash Return
3.3%
Cap rate
0.6%
Rent to Value Ratio

Active
$278,000
3
bds
|
0
ba
|
1,499
sqft
|
built
1973
13610 Lynnwood Ln, Sugar Land, TX 77498
$-680
Cash flow
-12.8%
Cash-on-Cash Return
3.3%
Cap rate
0.6%
Rent to Value Ratio

Active
$599,500
3
bds
|
0
ba
|
2,587
sqft
|
built
2008
910 Floriencia St, Sugar Land, TX 77479
$-1,059
Cash flow
-9.2%
Cash-on-Cash Return
4.1%
Cap rate
0.5%
Rent to Value Ratio

Active
$350,000
3
bds
|
0
ba
|
1,888
sqft
|
built
1976
13526 Sherwood St, Sugar Land, TX 77498
$-904
Cash flow
-13.5%
Cash-on-Cash Return
3.2%
Cap rate
0.6%
Rent to Value Ratio
Active
$560,000
4
bds
|
0
ba
|
3,023
sqft
|
built
1998
1623 Heddon Falls Dr, Sugar Land, TX 77479
$-1,710
Cash flow
-15.9%
Cash-on-Cash Return
2.6%
Cap rate
0.6%
Rent to Value Ratio

Active
$725,000
5
bds
|
0
ba
|
3,412
sqft
|
built
1991
311 Lake Bend Dr, Sugar Land, TX 77479
$-2,368
Cash flow
-17.0%
Cash-on-Cash Return
2.3%
Cap rate
0.5%
Rent to Value Ratio

Active
$320,000
1
bds
|
0
ba
|
993
sqft
|
built
2004
2299 Lone Star Dr, Sugar Land, TX 77479
$-1,280
Cash flow
-20.9%
Cash-on-Cash Return
1.5%
Cap rate
0.6%
Rent to Value Ratio
Active
$760,000
5
bds
|
0
ba
|
3,775
sqft
|
built
1994
4706 April Meadow Way, Sugar Land, TX 77479
$-2,574
Cash flow
-17.7%
Cash-on-Cash Return
2.2%
Cap rate
0.5%
Rent to Value Ratio
Active
$315,500
1
bds
|
0
ba
|
930
sqft
|
built
2004
2299 Lone Star Dr, Sugar Land, TX 77479
$-867
Cash flow
-14.3%
Cash-on-Cash Return
3.0%
Cap rate
0.6%
Rent to Value Ratio

Active
$539,000
4
bds
|
0
ba
|
3,010
sqft
|
built
1989
4607 Colony Hills Dr, Sugar Land, TX 77479
$-957
Cash flow
-9.3%
Cash-on-Cash Return
4.1%
Cap rate
0.5%
Rent to Value Ratio

Active
$630,000
4
bds
|
0
ba
|
3,356
sqft
|
built
1991
4027 Austin Meadow Dr, Sugar Land, TX 77479
$-1,846
Cash flow
-15.3%
Cash-on-Cash Return
2.7%
Cap rate
0.6%
Rent to Value Ratio

Active
$1,299,000
5
bds
|
0
ba
|
5,074
sqft
|
built
2011
2915 Sentry Oak Way, Sugar Land, TX 77479
$-5,052
Cash flow
-20.3%
Cash-on-Cash Return
1.6%
Cap rate
0.4%
Rent to Value Ratio
Active
$1,550,000
5
bds
|
0
ba
|
6,302
sqft
|
built
1984
45 Queen Mary Ct, Sugar Land, TX 77479
$-4,904
Cash flow
-16.5%
Cash-on-Cash Return
2.5%
Cap rate
0.5%
Rent to Value Ratio
Active
$429,000
4
bds
|
0
ba
|
2,148
sqft
|
built
1982
2810 Pineleaf Dr, Sugar Land, TX 77479
$-1,077
Cash flow
-13.1%
Cash-on-Cash Return
3.3%
Cap rate
0.6%
Rent to Value Ratio

Active
$629,000
3
bds
|
0
ba
|
2,795
sqft
|
built
2017
4926 Thunder Creek Ln, Sugar Land, TX 77479
$-1,972
Cash flow
-16.4%
Cash-on-Cash Return
2.5%
Cap rate
0.5%
Rent to Value Ratio
Active
$445,000
4
bds
|
0
ba
|
2,961
sqft
|
built
1998
2627 Brazos Ridge Dr, Sugar Land, TX 77479
$-1,192
Cash flow
-14.0%
Cash-on-Cash Return
3.0%
Cap rate
0.7%
Rent to Value Ratio