Sugar Land, TX Investment Properties for Sale
Browse homes for sale and investment properties in Sugar Land, TX. Refine your search by price, property type, or more.
Best cash flowing properties in Sugar Land, TX
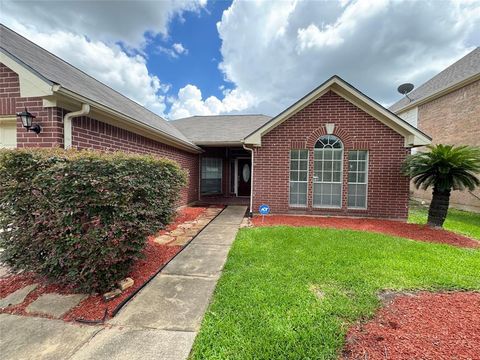
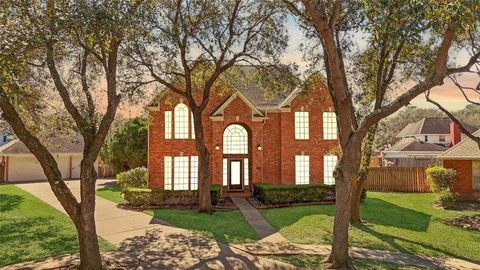
Active
$314,900
3
bds
|
0
ba
|
1,875
sqft
|
built
1998
3619 Stratford Arms Ln, Sugar Land, TX 77498
$-6
Cash flow
-0.1%
Cash-on-Cash Return
5.7%
Cap rate
0.7%
Rent to Value Ratio
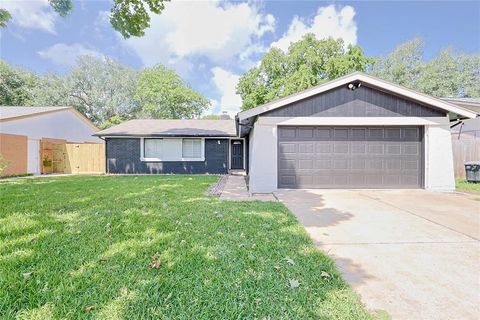
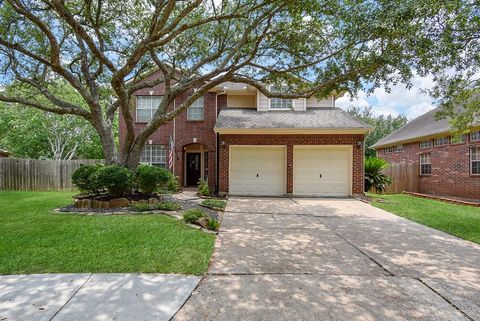
Active
$269,900
3
bds
|
0
ba
|
1,488
sqft
|
built
1977
9910 Kent Towne Ln, Sugar Land, TX 77498
$-60
Cash flow
-1.2%
Cash-on-Cash Return
6.0%
Cap rate
0.7%
Rent to Value Ratio
435 out of 442 properties for sale in Sugar Land, TX
Limited Results Shown
Create a free account, or log in to reveal all property listings and enjoy the complete experience.
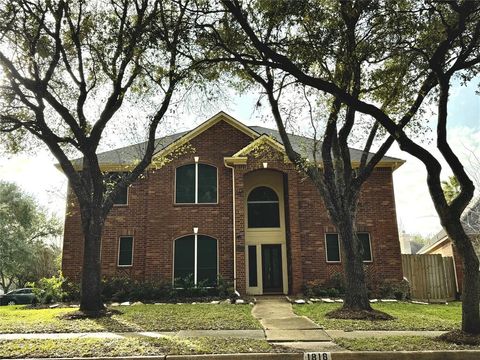
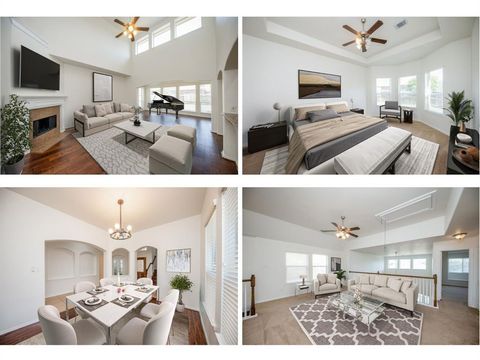
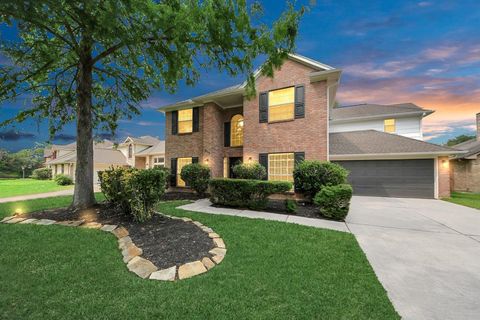
Active
$559,500
5
bds
|
0
ba
|
2,979
sqft
|
built
1997
1818 Maidenhair Ln, Sugar Land, TX 77479
$-1,564
Cash flow
-14.6%
Cash-on-Cash Return
2.9%
Cap rate
0.6%
Rent to Value Ratio
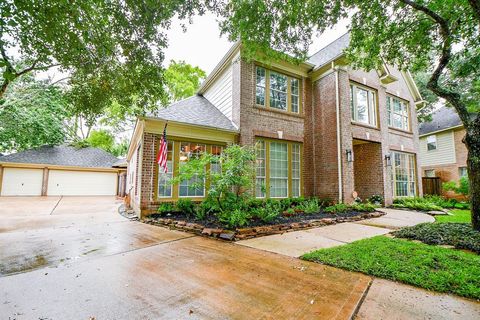
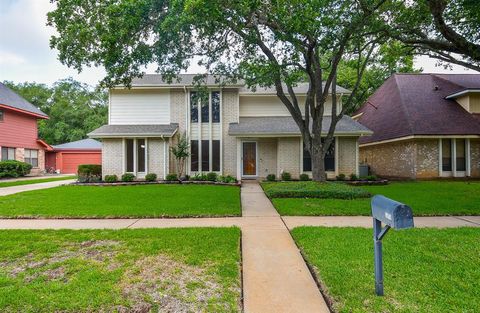
Active
$490,000
4
bds
|
0
ba
|
3,101
sqft
|
built
1998
2446 Plantation Bend Dr, Sugar Land, TX 77478
$-1,189
Cash flow
-12.7%
Cash-on-Cash Return
3.4%
Cap rate
0.6%
Rent to Value Ratio

Active
$420,000
5
bds
|
0
ba
|
2,272
sqft
|
built
1981
417 W Hillary Cir, Sugar Land, TX 77498
$-945
Cash flow
-11.7%
Cash-on-Cash Return
3.6%
Cap rate
0.6%
Rent to Value Ratio

Active
$245,990
2
bds
|
0
ba
|
1,196
sqft
|
built
1985
4144 Greystone Way, Sugar Land, TX 77479
$-1,038
Cash flow
-22.0%
Cash-on-Cash Return
1.2%
Cap rate
0.8%
Rent to Value Ratio

Active
$499,000
3
bds
|
0
ba
|
2,960
sqft
|
built
1973
506 Fox Briar Ln, Sugar Land, TX 77478
$-1,000
Cash flow
-10.5%
Cash-on-Cash Return
3.9%
Cap rate
0.7%
Rent to Value Ratio

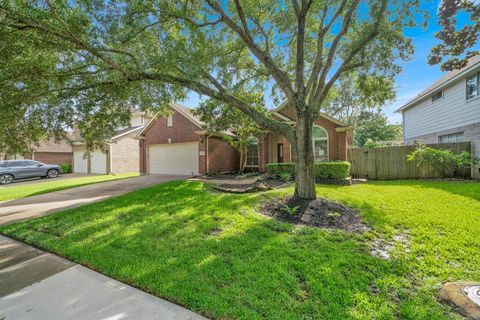
Active
$359,000
4
bds
|
0
ba
|
1,911
sqft
|
built
2003
15102 Millers Run Ln, Sugar Land, TX 77498
$-860
Cash flow
-12.5%
Cash-on-Cash Return
3.4%
Cap rate
0.6%
Rent to Value Ratio

Active
$438,000
4
bds
|
0
ba
|
2,561
sqft
|
built
1980
1646 Creekside Dr, Sugar Land, TX 77478
$-649
Cash flow
-7.7%
Cash-on-Cash Return
4.5%
Cap rate
0.7%
Rent to Value Ratio
Active
$795,000
5
bds
|
0
ba
|
4,323
sqft
|
built
1998
1930 Crisfield Dr, Sugar Land, TX 77479
$-2,644
Cash flow
-17.4%
Cash-on-Cash Return
2.3%
Cap rate
0.5%
Rent to Value Ratio
Active
$315,000
3
bds
|
0
ba
|
1,138
sqft
|
built
1982
3114 Whetrock Ln, Sugar Land, TX 77479
$-714
Cash flow
-11.8%
Cash-on-Cash Return
3.5%
Cap rate
0.6%
Rent to Value Ratio
Active
$590,000
4
bds
|
0
ba
|
3,236
sqft
|
built
1983
2215 Braesmeadow Ln, Sugar Land, TX 77479
$-1,708
Cash flow
-15.1%
Cash-on-Cash Return
2.8%
Cap rate
0.5%
Rent to Value Ratio
Active
$1,100,000
4
bds
|
0
ba
|
4,352
sqft
|
built
2008
902 Delford Way, Sugar Land, TX 77479
$-4,645
Cash flow
-22.0%
Cash-on-Cash Return
1.2%
Cap rate
0.4%
Rent to Value Ratio
Active
$369,990
3
bds
|
0
ba
|
2,148
sqft
|
built
2002
15215 Millers Run Ln, Sugar Land, TX 77498
$-776
Cash flow
-10.9%
Cash-on-Cash Return
3.2%
Cap rate
0.6%
Rent to Value Ratio
Active
$1,080,000
5
bds
|
0
ba
|
3,780
sqft
|
built
2016
6510 Brady Springs Ct, Sugar Land, TX 77479
$-3,597
Cash flow
-17.4%
Cash-on-Cash Return
1.7%
Cap rate
0.4%
Rent to Value Ratio
Active
$649,900
4
bds
|
0
ba
|
3,254
sqft
|
built
2013
5314 Belle Manor Ln, Sugar Land, TX 77479
$-1,291
Cash flow
-10.4%
Cash-on-Cash Return
3.9%
Cap rate
0.5%
Rent to Value Ratio
Active
$449,900
4
bds
|
0
ba
|
3,194
sqft
|
built
2000
15019 Cabin Run Ln, Sugar Land, TX 77498
$-1,058
Cash flow
-12.3%
Cash-on-Cash Return
3.4%
Cap rate
0.6%
Rent to Value Ratio
Active
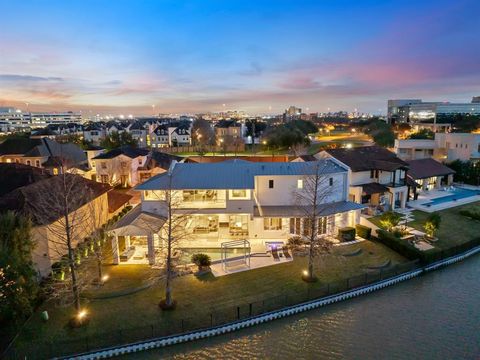
$2,999,000
3
bds
|
0
ba
|
4,940
sqft
|
built
2014
15618 Oyster Cove Dr, Sugar Land, TX 77478
$-13,975
Cash flow
-24.3%
Cash-on-Cash Return
0.1%
Cap rate
0.1%
Rent to Value Ratio
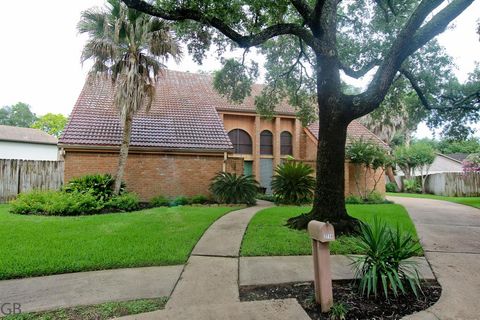
Active
$489,000
4
bds
|
0
ba
|
3,092
sqft
|
built
1978
2714 Sugarwood Dr, Sugar Land, TX 77478
$-891
Cash flow
-9.5%
Cash-on-Cash Return
3.5%
Cap rate
0.6%
Rent to Value Ratio
Active
$330,000
3
bds
|
0
ba
|
1,995
sqft
|
built
1997
4514 Casey Cir, Sugar Land, TX 77479
$-649
Cash flow
-10.3%
Cash-on-Cash Return
3.3%
Cap rate
0.7%
Rent to Value Ratio
Active
$1,110,000
5
bds
|
0
ba
|
4,858
sqft
|
built
2006
7010 Mc Clellan Ln, Sugar Land, TX 77479
$-4,791
Cash flow
-22.5%
Cash-on-Cash Return
1.1%
Cap rate
0.4%
Rent to Value Ratio
Active
$495,000
4
bds
|
0
ba
|
2,775
sqft
|
built
1990
1522 Briarbend Dr, Sugar Land, TX 77479
$-1,330
Cash flow
-14.0%
Cash-on-Cash Return
2.5%
Cap rate
0.6%
Rent to Value Ratio
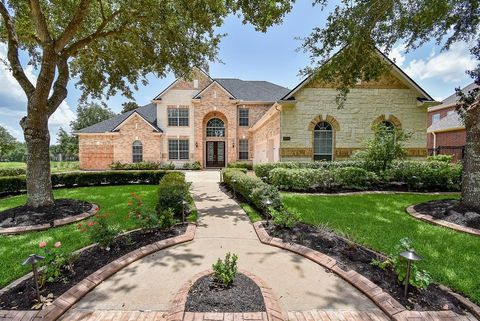
Active
$649,500
4
bds
|
0
ba
|
3,445
sqft
|
built
2013
4639 Regal Shadow Ln, Sugar Land, TX 77479
$-1,919
Cash flow
-15.4%
Cash-on-Cash Return
2.7%
Cap rate
0.5%
Rent to Value Ratio
Active
$389,000
4
bds
|
0
ba
|
2,415
sqft
|
built
2004
10326 Low Bridge Ln, Sugar Land, TX 77498
$-954
Cash flow
-12.8%
Cash-on-Cash Return
3.3%
Cap rate
0.6%
Rent to Value Ratio
Active
$749,900
5
bds
|
0
ba
|
3,674
sqft
|
built
1990
3402 Haywood Ct, Sugar Land, TX 77478
$-1,905
Cash flow
-13.3%
Cash-on-Cash Return
3.2%
Cap rate
0.6%
Rent to Value Ratio
Active
$558,800
4
bds
|
0
ba
|
3,294
sqft
|
built
2008
3818 Orchard Springs Ct, Sugar Land, TX 77479
$-773
Cash flow
-7.2%
Cash-on-Cash Return
4.6%
Cap rate
0.6%
Rent to Value Ratio
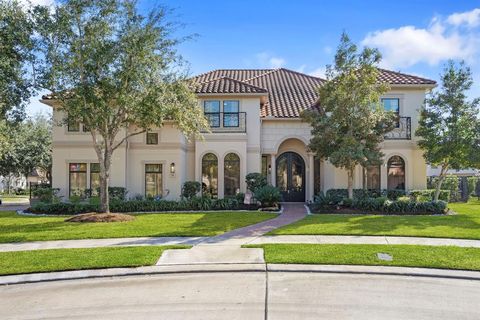
Active
$1,850,000
6
bds
|
0
ba
|
6,793
sqft
|
built
2008
61 Open Sands Ct, Sugar Land, TX 77479
$-5,340
Cash flow
-15.1%
Cash-on-Cash Return
2.2%
Cap rate
0.5%
Rent to Value Ratio
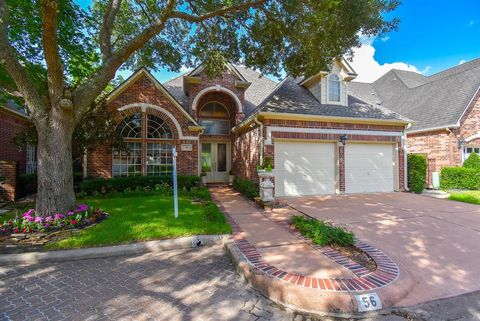
Active
$740,000
3
bds
|
2.5
ba
|
3,001
sqft
|
built
1991
56 Ambleside Crescent Dr, Sugar Land, TX 77479
$-2,431
Cash flow
-17.1%
Cash-on-Cash Return
1.7%
Cap rate
0.4%
Rent to Value Ratio
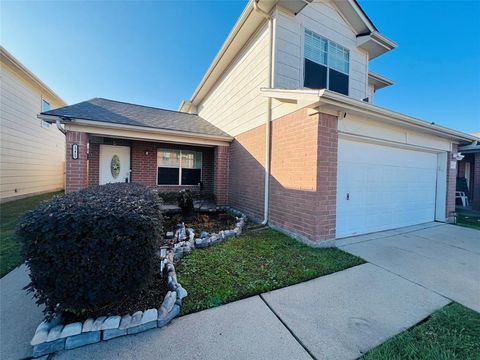
Active
$280,000
3
bds
|
2.5
ba
|
1,620
sqft
|
built
1999
13415 Naples Bridge Rd, Sugar Land, TX 77498
$-403
Cash flow
-7.5%
Cash-on-Cash Return
4.0%
Cap rate
0.7%
Rent to Value Ratio

Active
$435,000
3
bds
|
0
ba
|
2,424
sqft
|
built
1983
815 Millpond Dr, Sugar Land, TX 77498
$-1,183
Cash flow
-14.2%
Cash-on-Cash Return
3.0%
Cap rate
0.6%
Rent to Value Ratio
Active
$600,000
5
bds
|
0
ba
|
3,205
sqft
|
built
1989
2027 Richland Ct, Sugar Land, TX 77478
$-1,770
Cash flow
-15.4%
Cash-on-Cash Return
2.7%
Cap rate
0.5%
Rent to Value Ratio

Active
$6,995,000
6
bds
|
0
ba
|
17,020
sqft
|
built
2005
21 Grand Mnr, Sugar Land, TX 77479
$-36,070
Cash flow
-26.9%
Cash-on-Cash Return
0.1%
Cap rate
0.1%
Rent to Value Ratio
Active
$426,999
4
bds
|
0
ba
|
2,265
sqft
|
built
1998
1111 Cambrian Park Ct, Sugar Land, TX 77479
$-1,241
Cash flow
-15.2%
Cash-on-Cash Return
2.8%
Cap rate
0.6%
Rent to Value Ratio

Active
$369,500
5
bds
|
0
ba
|
2,267
sqft
|
built
1981
3022 Sam Houston Dr, Sugar Land, TX 77479
$-828
Cash flow
-11.7%
Cash-on-Cash Return
3.6%
Cap rate
0.6%
Rent to Value Ratio

Active
$345,000
4
bds
|
0
ba
|
2,562
sqft
|
built
2002
14910 Sugar Crystal Ct, Sugar Land, TX 77498
$-258
Cash flow
-3.9%
Cash-on-Cash Return
5.4%
Cap rate
0.7%
Rent to Value Ratio
Active
$418,000
4
bds
|
0
ba
|
2,647
sqft
|
built
1990
235 Cedar Elm Ln, Sugar Land, TX 77479
$-1,161
Cash flow
-14.5%
Cash-on-Cash Return
2.9%
Cap rate
0.6%
Rent to Value Ratio
Active
$415,000
4
bds
|
0
ba
|
2,378
sqft
|
built
1982
2814 River Birch Dr, Sugar Land, TX 77479
$-1,179
Cash flow
-14.8%
Cash-on-Cash Return
2.9%
Cap rate
0.6%
Rent to Value Ratio

Active
$234,500
2
bds
|
0
ba
|
1,330
sqft
|
built
2002
2710 Grants Lake Blvd, Sugar Land, TX 77479
$-477
Cash flow
-10.6%
Cash-on-Cash Return
3.8%
Cap rate
0.8%
Rent to Value Ratio
Active
$875,800
5
bds
|
0
ba
|
4,002
sqft
|
built
2013
5822 Crawford Hill Ln, Sugar Land, TX 77479
$-2,840
Cash flow
-16.9%
Cash-on-Cash Return
2.4%
Cap rate
0.5%
Rent to Value Ratio
Active
$1,495,000
4
bds
|
0
ba
|
4,362
sqft
|
built
1997
4111 Thistle Hill Ct, Sugar Land, TX 77479
$-6,894
Cash flow
-24.1%
Cash-on-Cash Return
0.7%
Cap rate
0.3%
Rent to Value Ratio