Harris County Investment Properties for Sale
Browse homes for sale and investment properties in Harris County. Refine your search by price, property type, or more.
Best cash flowing properties in Harris County

Active
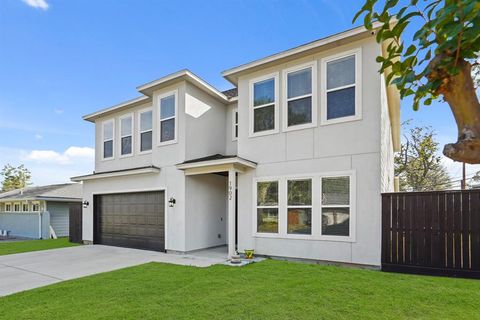
$290,000
3
bds
|
3
ba
|
1,710
sqft
|
built
2022
2115 Esther Dr, Houston, TX 77088
$215
Cash flow
3.9%
Cash-on-Cash Return
6.6%
Cap rate
0.8%
Rent to Value Ratio
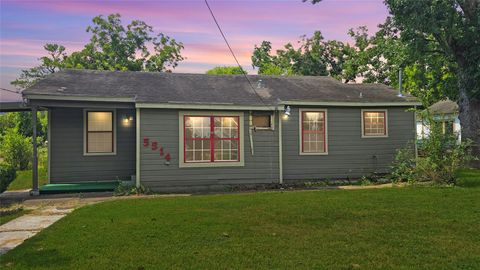
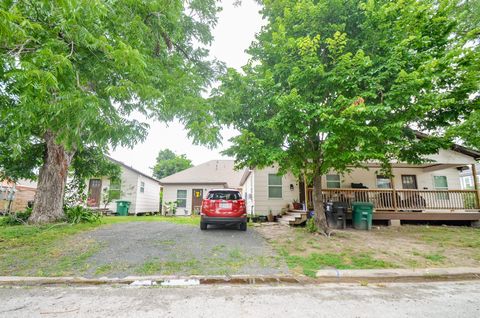
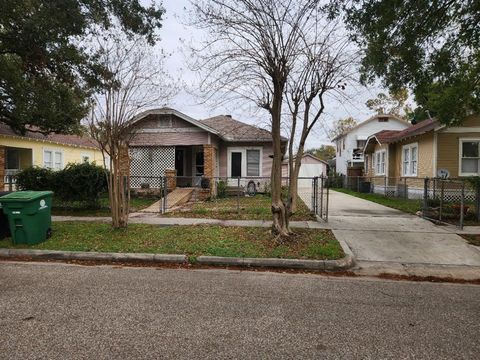
Active
$165,000
2
bds
|
1
ba
|
1,089
sqft
|
built
1940
5514 Pardee St, Houston, TX 77026
$140
Cash flow
4.4%
Cash-on-Cash Return
6.7%
Cap rate
1.0%
Rent to Value Ratio
8,521 out of 14,377 properties for sale in Harris County
Limited Results Shown
Create a free account, or log in to reveal all property listings and enjoy the complete experience.
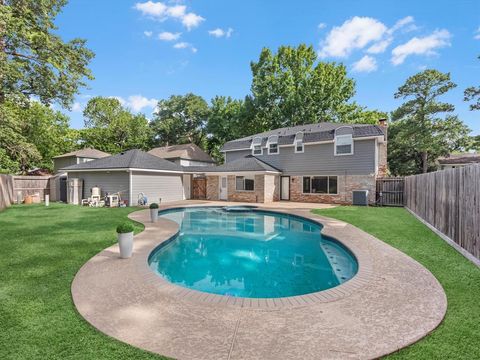
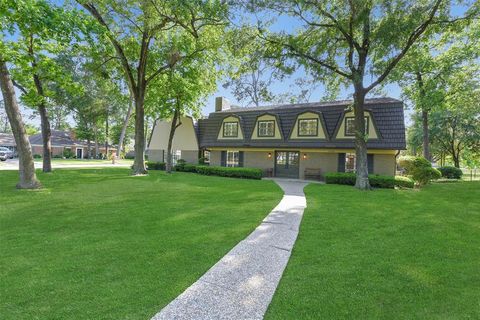
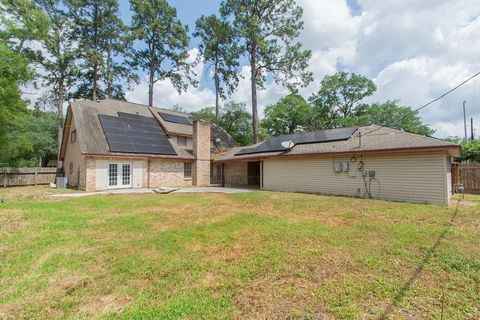
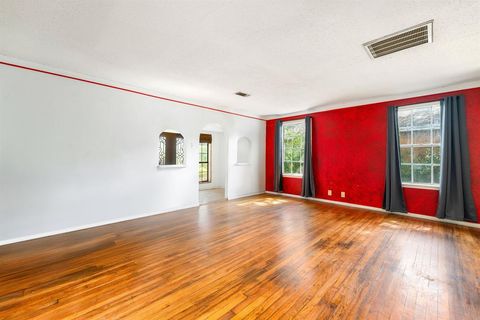
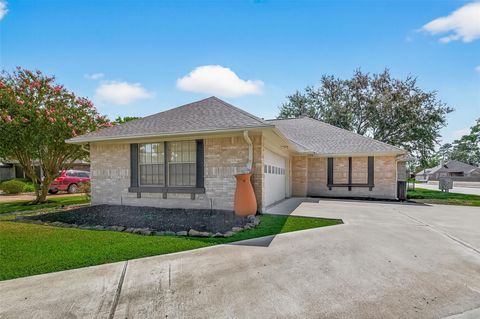
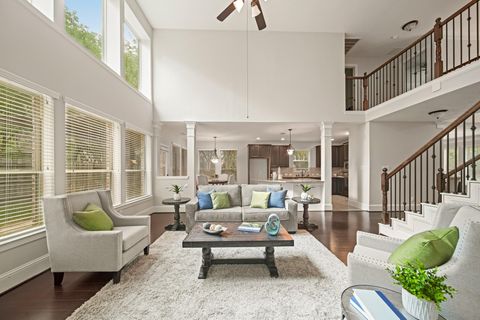
Active
$364,500
4
bds
|
3
ba
|
2,540
sqft
|
built
1973
8211 Glencliffe Ln, Houston, TX 77070
$-694
Cash flow
-9.9%
Cash-on-Cash Return
3.4%
Cap rate
0.6%
Rent to Value Ratio
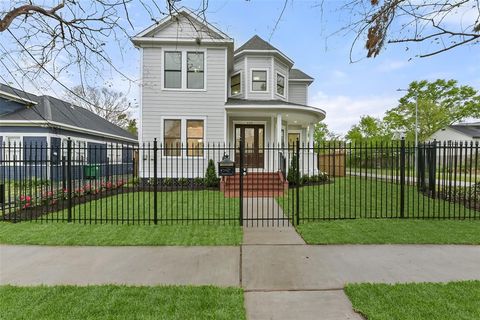
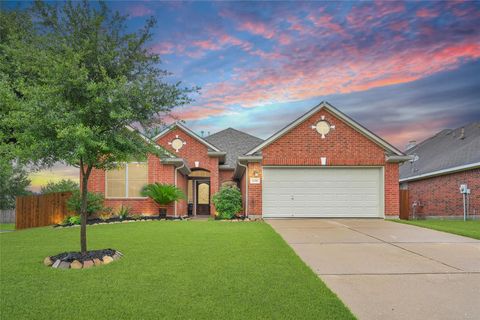
Active
$1,085,000
3
bds
|
3
ba
|
2,660
sqft
|
built
2007
450 W 16th St, Houston, TX 77008
$-3,695
Cash flow
-17.8%
Cash-on-Cash Return
1.6%
Cap rate
0.4%
Rent to Value Ratio
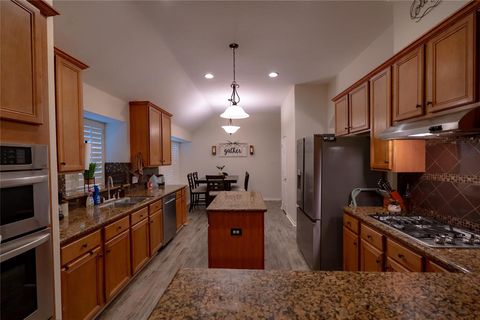
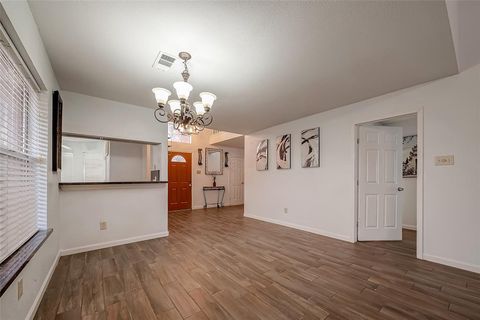
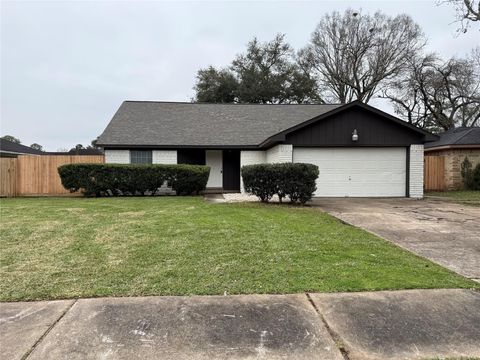
Active
$330,000
3
bds
|
2
ba
|
2,022
sqft
|
built
2007
1511 Chart Dr, Crosby, TX 77532
$-510
Cash flow
-8.1%
Cash-on-Cash Return
3.8%
Cap rate
0.7%
Rent to Value Ratio

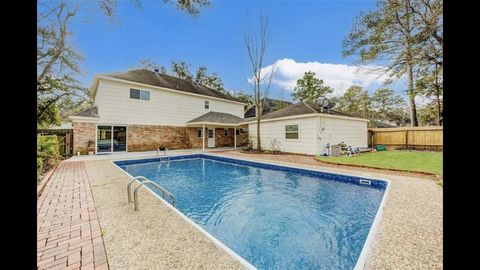
Active
$179,500
2
bds
|
2
ba
|
1,109
sqft
|
built
1983
3634 Woodlace Dr, Humble, TX 77396
$-76
Cash flow
-2.2%
Cash-on-Cash Return
5.2%
Cap rate
0.9%
Rent to Value Ratio
Active
$449,999
4
bds
|
4
ba
|
2,892
sqft
|
built
1991
10310 Minturn Ln, Houston, TX 77064
$-1,072
Cash flow
-12.4%
Cash-on-Cash Return
2.8%
Cap rate
0.6%
Rent to Value Ratio
Active
$749,995
5
bds
|
4
ba
|
3,886
sqft
|
built
1966
13103 Coral Ridge Ct, Houston, TX 77069
$-2,211
Cash flow
-15.4%
Cash-on-Cash Return
2.1%
Cap rate
0.4%
Rent to Value Ratio
Active
$332,000
3
bds
|
2
ba
|
1,685
sqft
|
built
1978
14110 Woodnook Dr, Houston, TX 77077
$-798
Cash flow
-12.5%
Cash-on-Cash Return
2.8%
Cap rate
0.6%
Rent to Value Ratio
Active
$510,000
bds
|
0
ba
|
1,280
sqft
|
built
1940
1413 Egypt St, Houston, TX 77009
$-2,387
Cash flow
-24.4%
Cash-on-Cash Return
0.1%
Cap rate
0.2%
Rent to Value Ratio

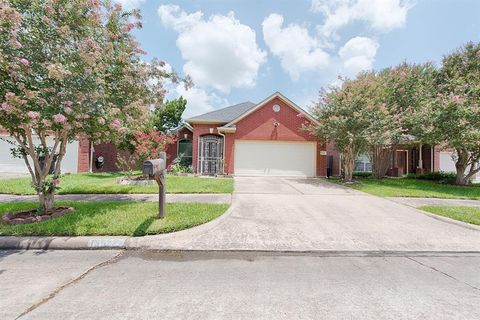
Active
$425,000
3
bds
|
3
ba
|
2,790
sqft
|
built
2000
20518 Cypresswood Meadows Dr, Spring, TX 77388
$-706
Cash flow
-8.7%
Cash-on-Cash Return
3.7%
Cap rate
0.8%
Rent to Value Ratio

Active
$330,000
4
bds
|
3
ba
|
2,400
sqft
|
built
1970
12519 Briar Forest Dr, Houston, TX 77077
$-450
Cash flow
-7.1%
Cash-on-Cash Return
4.0%
Cap rate
0.8%
Rent to Value Ratio
Active
$339,000
3
bds
|
2
ba
|
1,678
sqft
|
built
1995
13522 Carruth Ln, Houston, TX 77083
$-720
Cash flow
-11.1%
Cash-on-Cash Return
3.1%
Cap rate
0.6%
Rent to Value Ratio
Active
$329,900
6
bds
|
4
ba
|
3,360
sqft
|
built
1970
1103 Suwanee Ln, Houston, TX 77090
$-277
Cash flow
-4.4%
Cash-on-Cash Return
4.7%
Cap rate
0.8%
Rent to Value Ratio
Active
$250,000
4
bds
|
2
ba
|
1,770
sqft
|
built
1950
4727 Arvilla Ln, Houston, TX 77021
$-191
Cash flow
-4.0%
Cash-on-Cash Return
4.8%
Cap rate
0.8%
Rent to Value Ratio

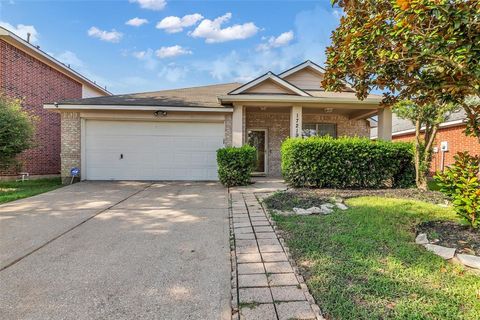
Active
$270,000
3
bds
|
2
ba
|
1,457
sqft
|
built
2005
5827 Hatfield Glen Dr, Katy, TX 77449
$-391
Cash flow
-7.6%
Cash-on-Cash Return
3.9%
Cap rate
0.7%
Rent to Value Ratio
Active
$295,000
4
bds
|
2
ba
|
2,121
sqft
|
built
2003
17219 Brookhollow Mist Ct, Houston, TX 77084
$-663
Cash flow
-11.7%
Cash-on-Cash Return
3.0%
Cap rate
0.7%
Rent to Value Ratio
Active
$535,000
3
bds
|
4
ba
|
3,142
sqft
|
built
2007
14426 Basalt Ln, Houston, TX 77077
$-1,409
Cash flow
-13.7%
Cash-on-Cash Return
2.5%
Cap rate
0.6%
Rent to Value Ratio
Active
$200,000
4
bds
|
2
ba
|
1,620
sqft
|
built
1954
1906 Thelma Ln, Pasadena, TX 77502
$-57
Cash flow
-1.5%
Cash-on-Cash Return
5.3%
Cap rate
0.9%
Rent to Value Ratio
Active
$255,000
3
bds
|
3
ba
|
1,530
sqft
|
built
2003
14123 Beech Meadow Dr, Houston, TX 77083
$-503
Cash flow
-10.3%
Cash-on-Cash Return
3.3%
Cap rate
0.7%
Rent to Value Ratio
Active
$900,000
6
bds
|
6
ba
|
4,921
sqft
|
built
2003
14534 Iron Horseshoe Ln, Houston, TX 77044
$-2,078
Cash flow
-12.0%
Cash-on-Cash Return
2.9%
Cap rate
0.6%
Rent to Value Ratio
Active
$622,000
4
bds
|
3
ba
|
3,179
sqft
|
built
2022
1902 Stillwood Dr, Houston, TX 77080
$-1,081
Cash flow
-9.1%
Cash-on-Cash Return
3.6%
Cap rate
0.7%
Rent to Value Ratio
Active
$298,000
3
bds
|
2
ba
|
2,258
sqft
|
built
1985
19002 Caddy Cir, Humble, TX 77346
$139
Cash flow
2.4%
Cash-on-Cash Return
6.2%
Cap rate
0.8%
Rent to Value Ratio
Active
$350,000
3
bds
|
2
ba
|
2,041
sqft
|
built
2005
6318 Crystal Forest Trl, Katy, TX 77493
$-643
Cash flow
-9.6%
Cash-on-Cash Return
3.5%
Cap rate
0.7%
Rent to Value Ratio
Active
$269,500
4
bds
|
3
ba
|
2,435
sqft
|
built
1990
5110 Prairie Creek Dr, Houston, TX 77084
$-244
Cash flow
-4.7%
Cash-on-Cash Return
4.6%
Cap rate
0.9%
Rent to Value Ratio

Active
$138,000
3
bds
|
1
ba
|
894
sqft
|
built
1973
6315 Mardale Dr, Houston, TX 77016
$131
Cash flow
5.0%
Cash-on-Cash Return
6.8%
Cap rate
1.1%
Rent to Value Ratio
Active
$565,000
4
bds
|
2
ba
|
2,146
sqft
|
built
1962
5006 Lymbar Dr, Houston, TX 77096
$-1,451
Cash flow
-13.4%
Cash-on-Cash Return
2.6%
Cap rate
0.5%
Rent to Value Ratio
Active
$258,000
3
bds
|
2
ba
|
1,293
sqft
|
built
2023
24307 Oriole Summit Dr, Spring, TX 77373
$-574
Cash flow
-11.6%
Cash-on-Cash Return
3.0%
Cap rate
0.7%
Rent to Value Ratio
Active
$345,000
3
bds
|
2
ba
|
1,895
sqft
|
built
2022
13134 Rowan Green Dr, Humble, TX 77346
$-755
Cash flow
-11.4%
Cash-on-Cash Return
3.1%
Cap rate
0.8%
Rent to Value Ratio
Active
$95,000
1
bds
|
1
ba
|
744
sqft
|
built
1960
2601 Bellefontaine St, Houston, TX 77025
$-282
Cash flow
-15.5%
Cash-on-Cash Return
2.1%
Cap rate
1.4%
Rent to Value Ratio
Active
$174,900
3
bds
|
2
ba
|
1,531
sqft
|
built
1966
7510 Hornwood Dr, Houston, TX 77036
$-52
Cash flow
-1.6%
Cash-on-Cash Return
5.3%
Cap rate
1.1%
Rent to Value Ratio
Active
$369,000
3
bds
|
2
ba
|
1,677
sqft
|
built
2024
21838 Kintai Ridge Dr, Cypress, TX 77433
$-262
Cash flow
-3.7%
Cash-on-Cash Return
4.8%
Cap rate
0.7%
Rent to Value Ratio
Active
$245,000
4
bds
|
2
ba
|
2,016
sqft
|
built
2023
1015 Exotic Pine St, Huffman, TX 77336
$0
Cash flow
n/a
Cash-on-Cash Return
n/a
Cap rate
n/a
Rent to Value Ratio

Active
$398,000
3
bds
|
4
ba
|
3,691
sqft
|
built
1975
7607 Bankside Dr, Houston, TX 77071
$-391
Cash flow
-5.1%
Cash-on-Cash Return
4.5%
Cap rate
0.8%
Rent to Value Ratio
Active
$349,000
5
bds
|
4
ba
|
2,735
sqft
|
built
1956
8423 Glen Valley Dr, Houston, TX 77061
$-1,938
Cash flow
-29.0%
Cash-on-Cash Return
-1.0%
Cap rate
0.3%
Rent to Value Ratio
Active
$625,000
3
bds
|
1
ba
|
1,184
sqft
|
built
1930
4008 Norhill Blvd, Houston, TX 77009
$-2,454
Cash flow
-20.5%
Cash-on-Cash Return
1.0%
Cap rate
0.3%
Rent to Value Ratio

Active
$619,987
4
bds
|
3
ba
|
2,916
sqft
|
built
1988
2202 Canterbury Ct, Deer Park, TX 77536
$-1,071
Cash flow
-9.0%
Cash-on-Cash Return
3.6%
Cap rate
0.6%
Rent to Value Ratio
Active
$585,000
5
bds
|
4
ba
|
3,651
sqft
|
built
2012
12102 N Founders Shore Dr, Cypress, TX 77433
$-1,257
Cash flow
-11.2%
Cash-on-Cash Return
3.1%
Cap rate
0.7%
Rent to Value Ratio
Active
$278,500
4
bds
|
2
ba
|
1,628
sqft
|
built
1978
13914 Ludgate Pass, Houston, TX 77034
$-378
Cash flow
-7.1%
Cash-on-Cash Return
4.1%
Cap rate
0.7%
Rent to Value Ratio
Active
$475,000
5
bds
|
4
ba
|
2,862
sqft
|
built
1977
3610 Stoney Oak Dr, Houston, TX 77068
$-116
Cash flow
-1.3%
Cash-on-Cash Return
5.4%
Cap rate
0.7%
Rent to Value Ratio