Birmingham, AL Investment Properties for Sale
Browse homes for sale and investment properties in Birmingham, AL. Refine your search by price, property type, or more.
Best cash flowing properties in Birmingham, AL
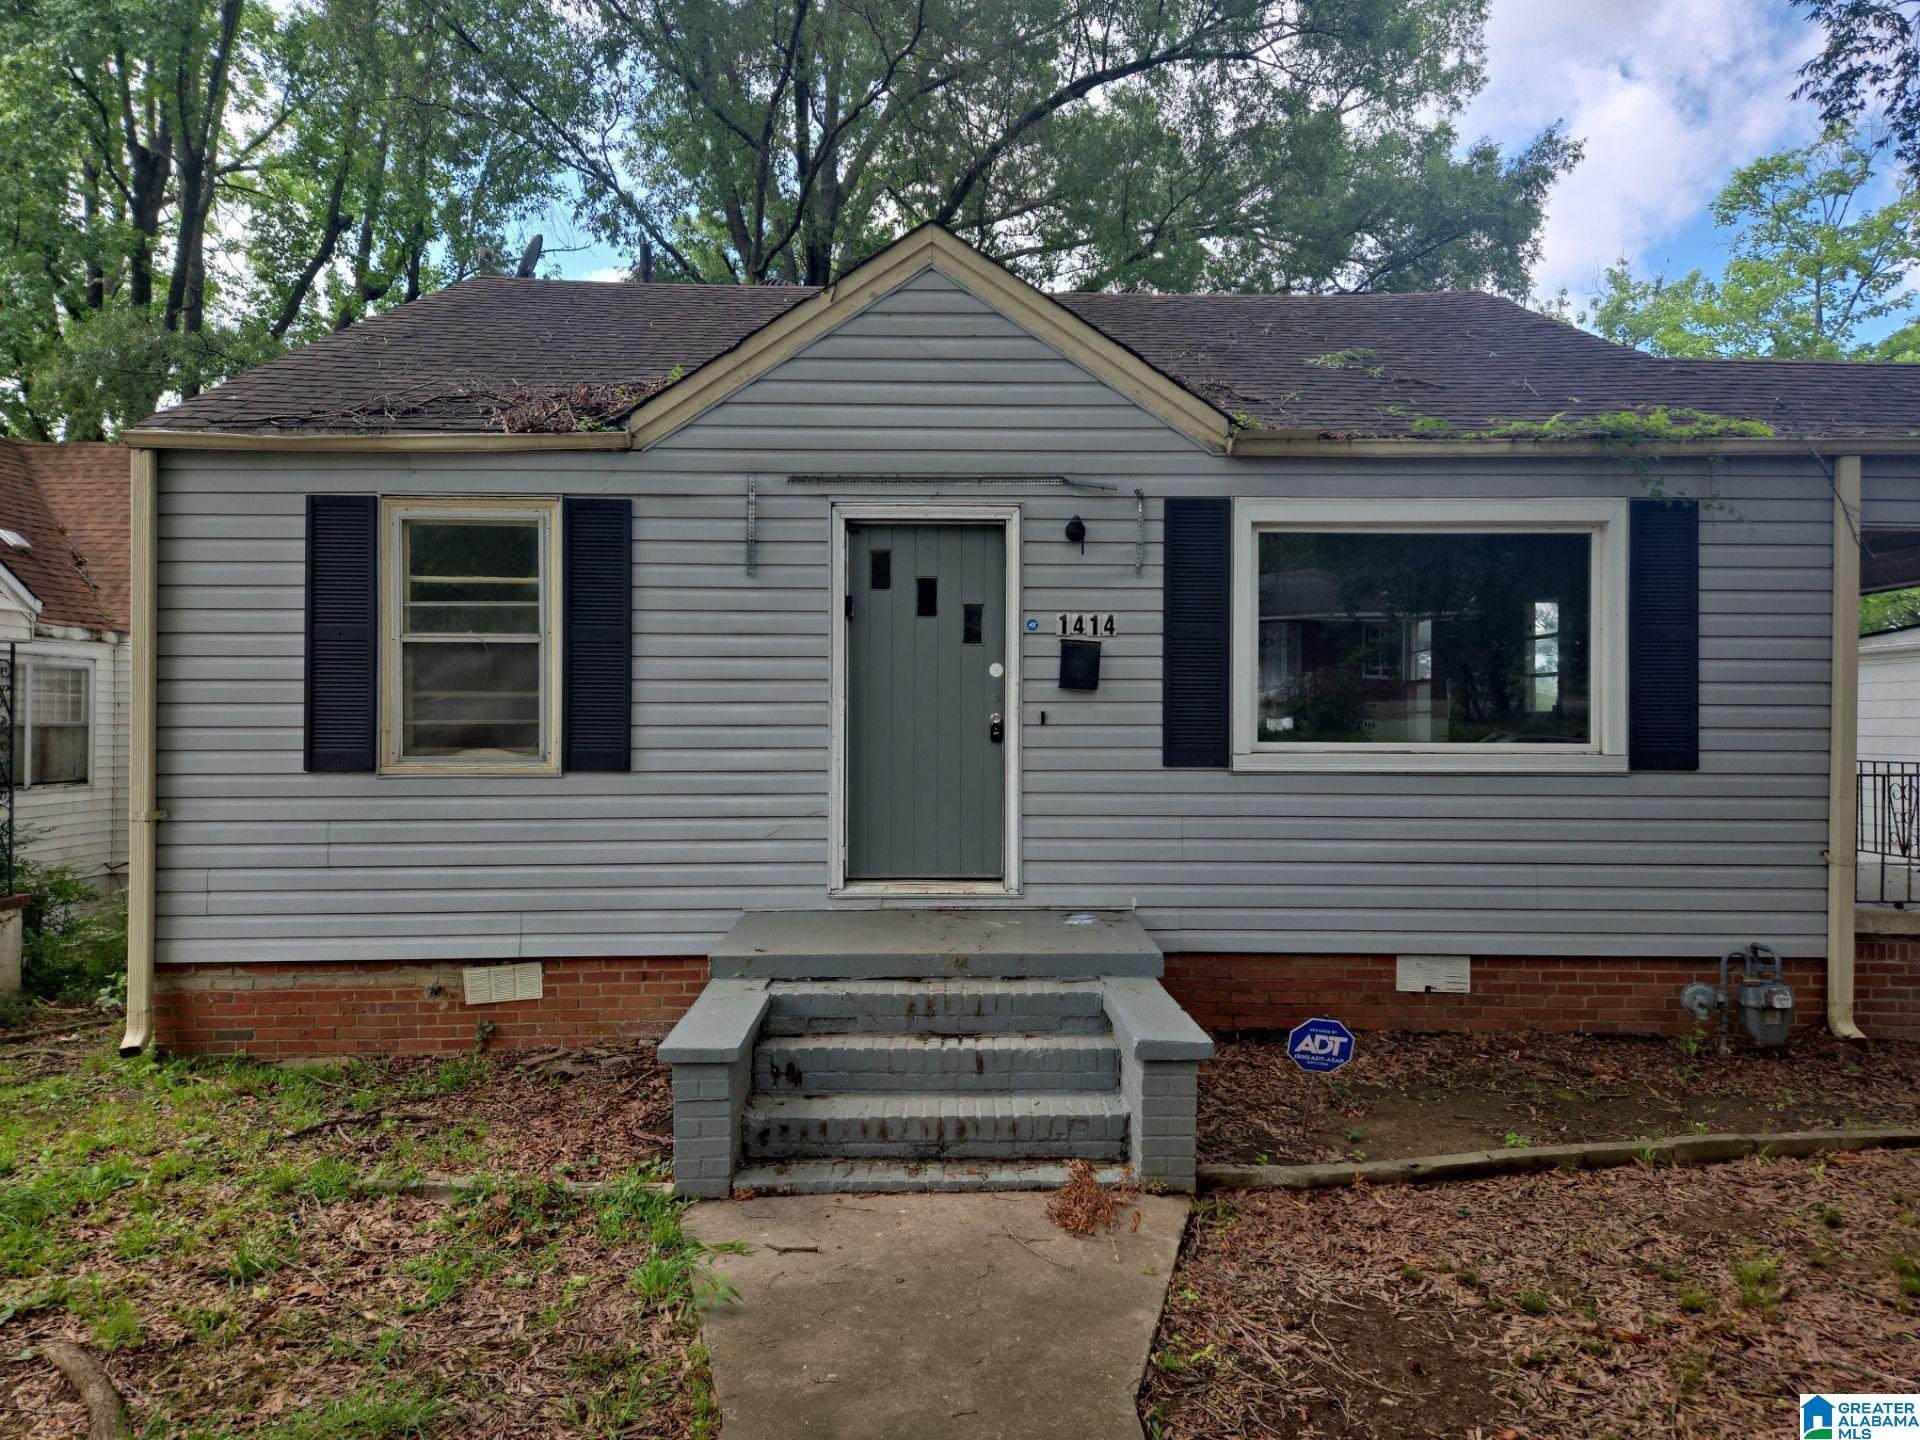
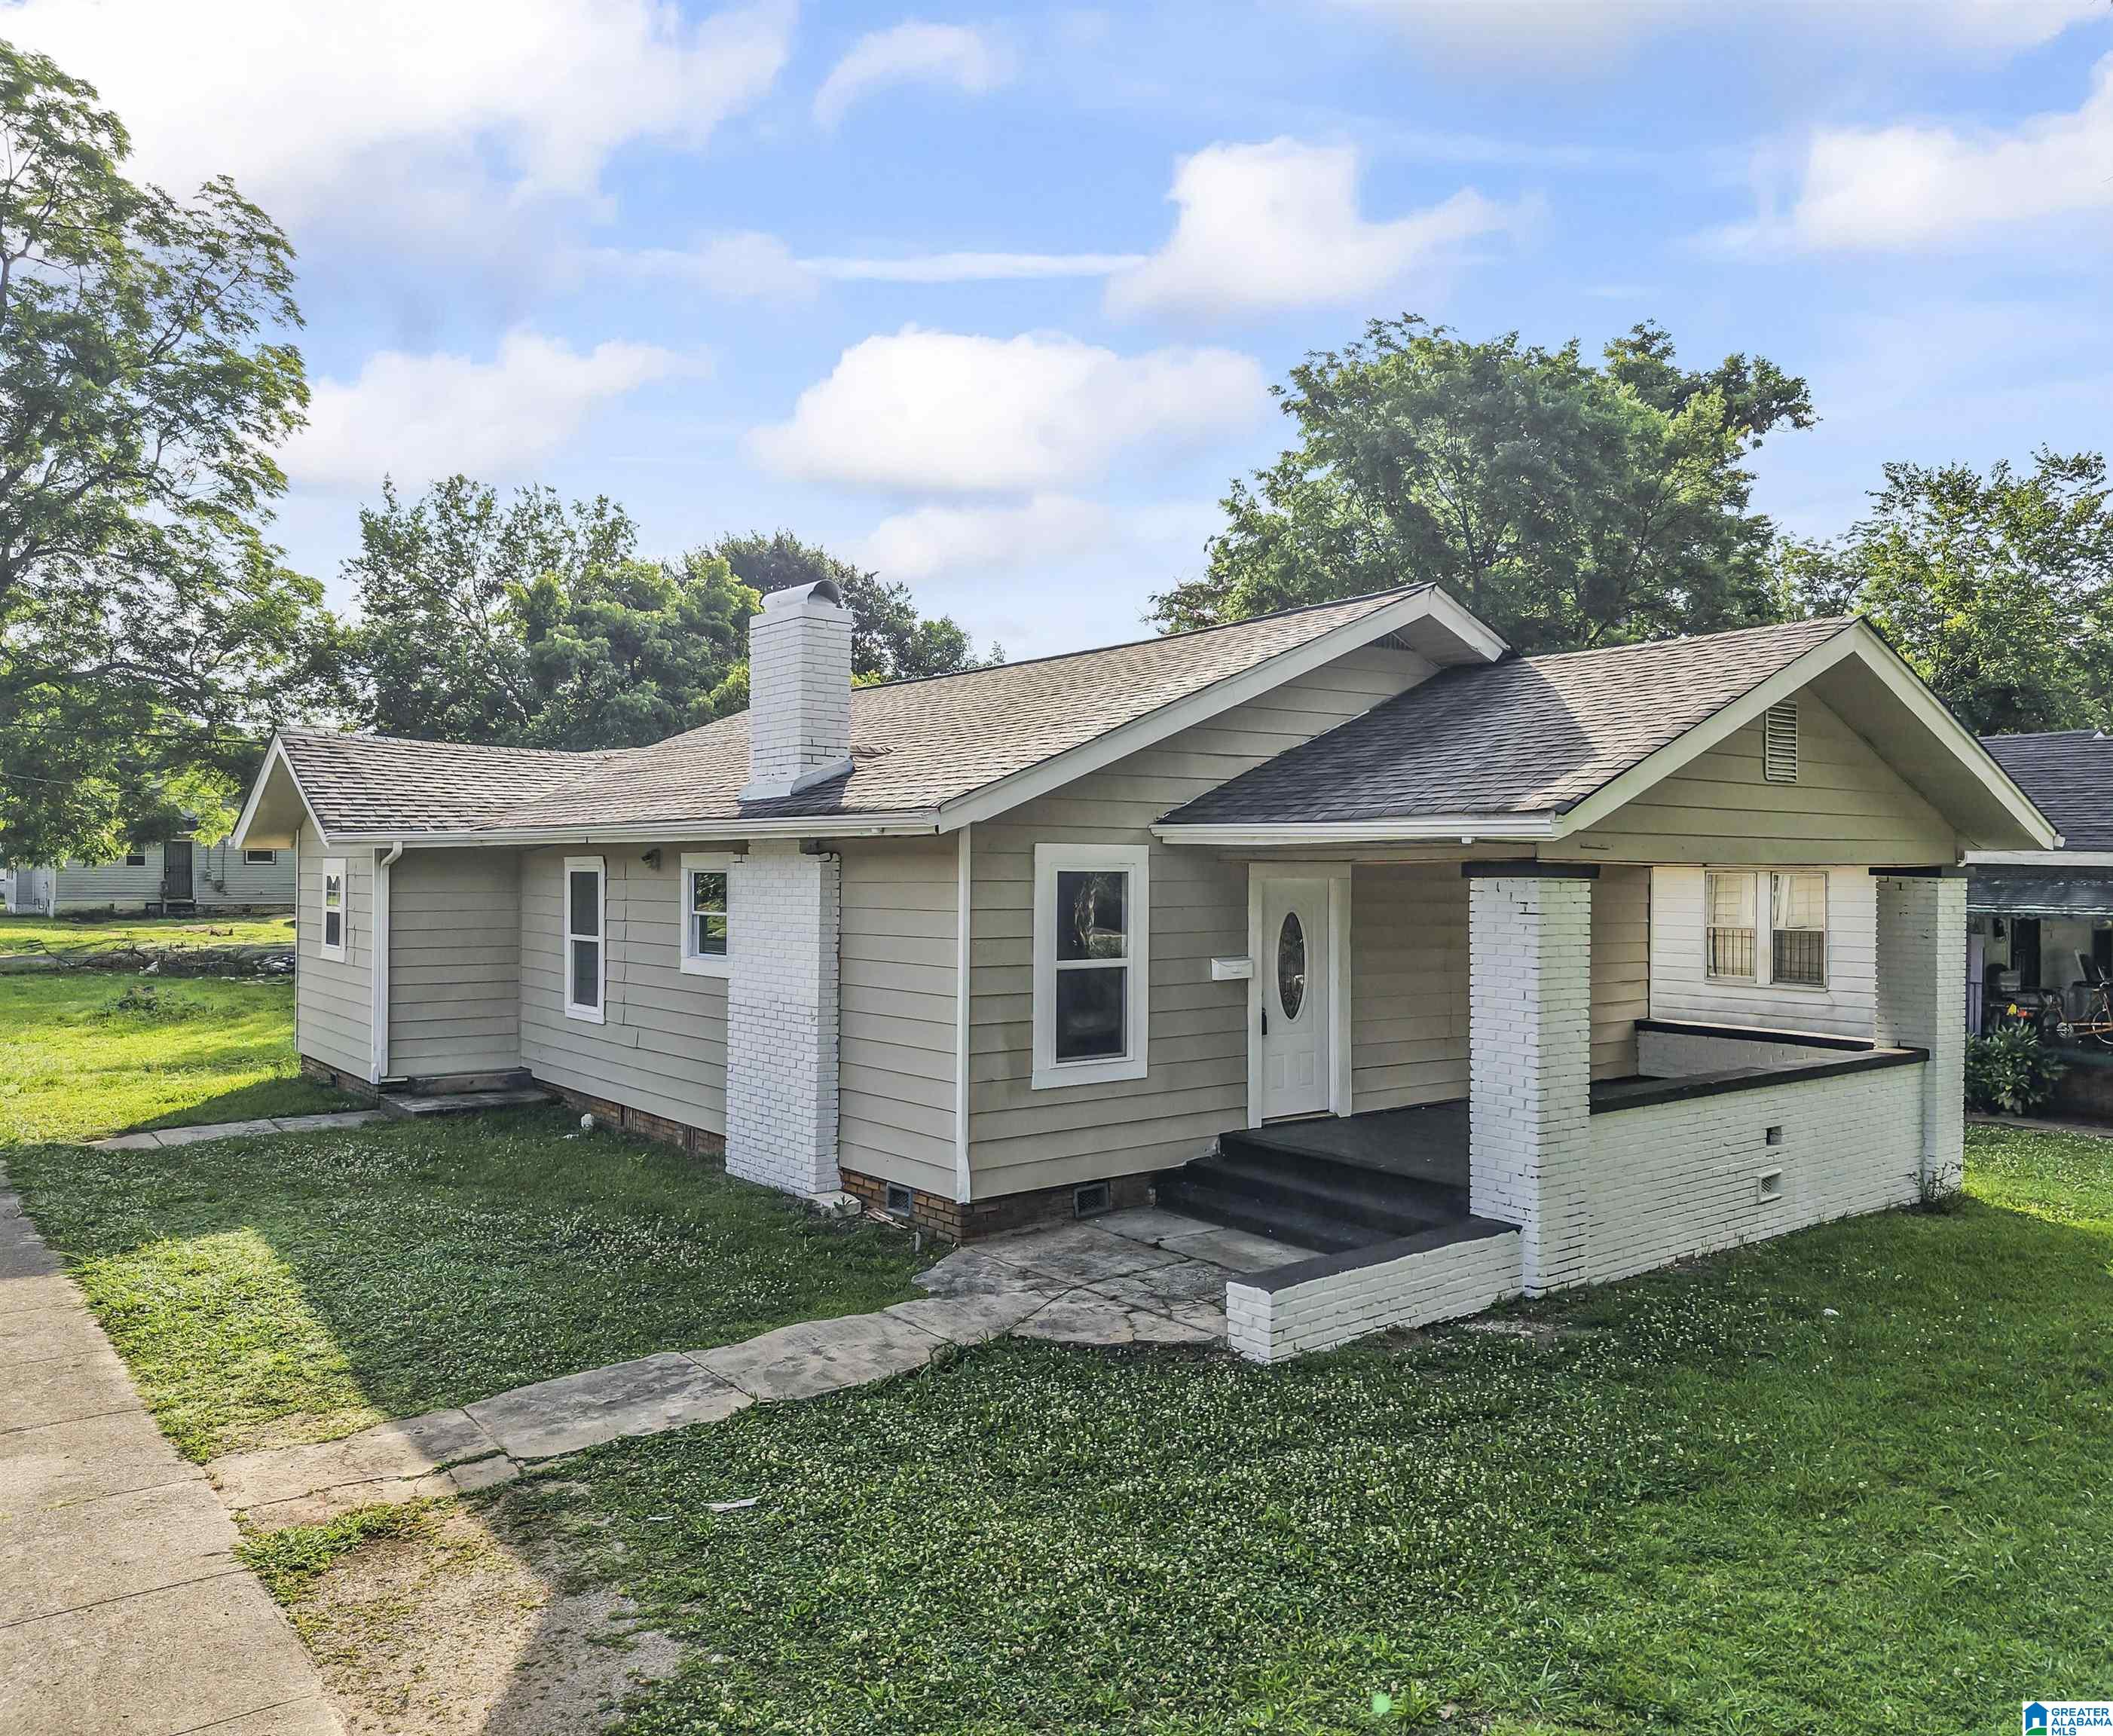
Active
$65,000
3
bds
|
0
ba
|
1,170
sqft
|
built
1949
1414 27th Street Ensley, Birmingham, AL 35218
$828
Cash flow
14.8%
Cash-on-Cash Return
15.3%
Cap rate
1.8%
Rent to Value Ratio
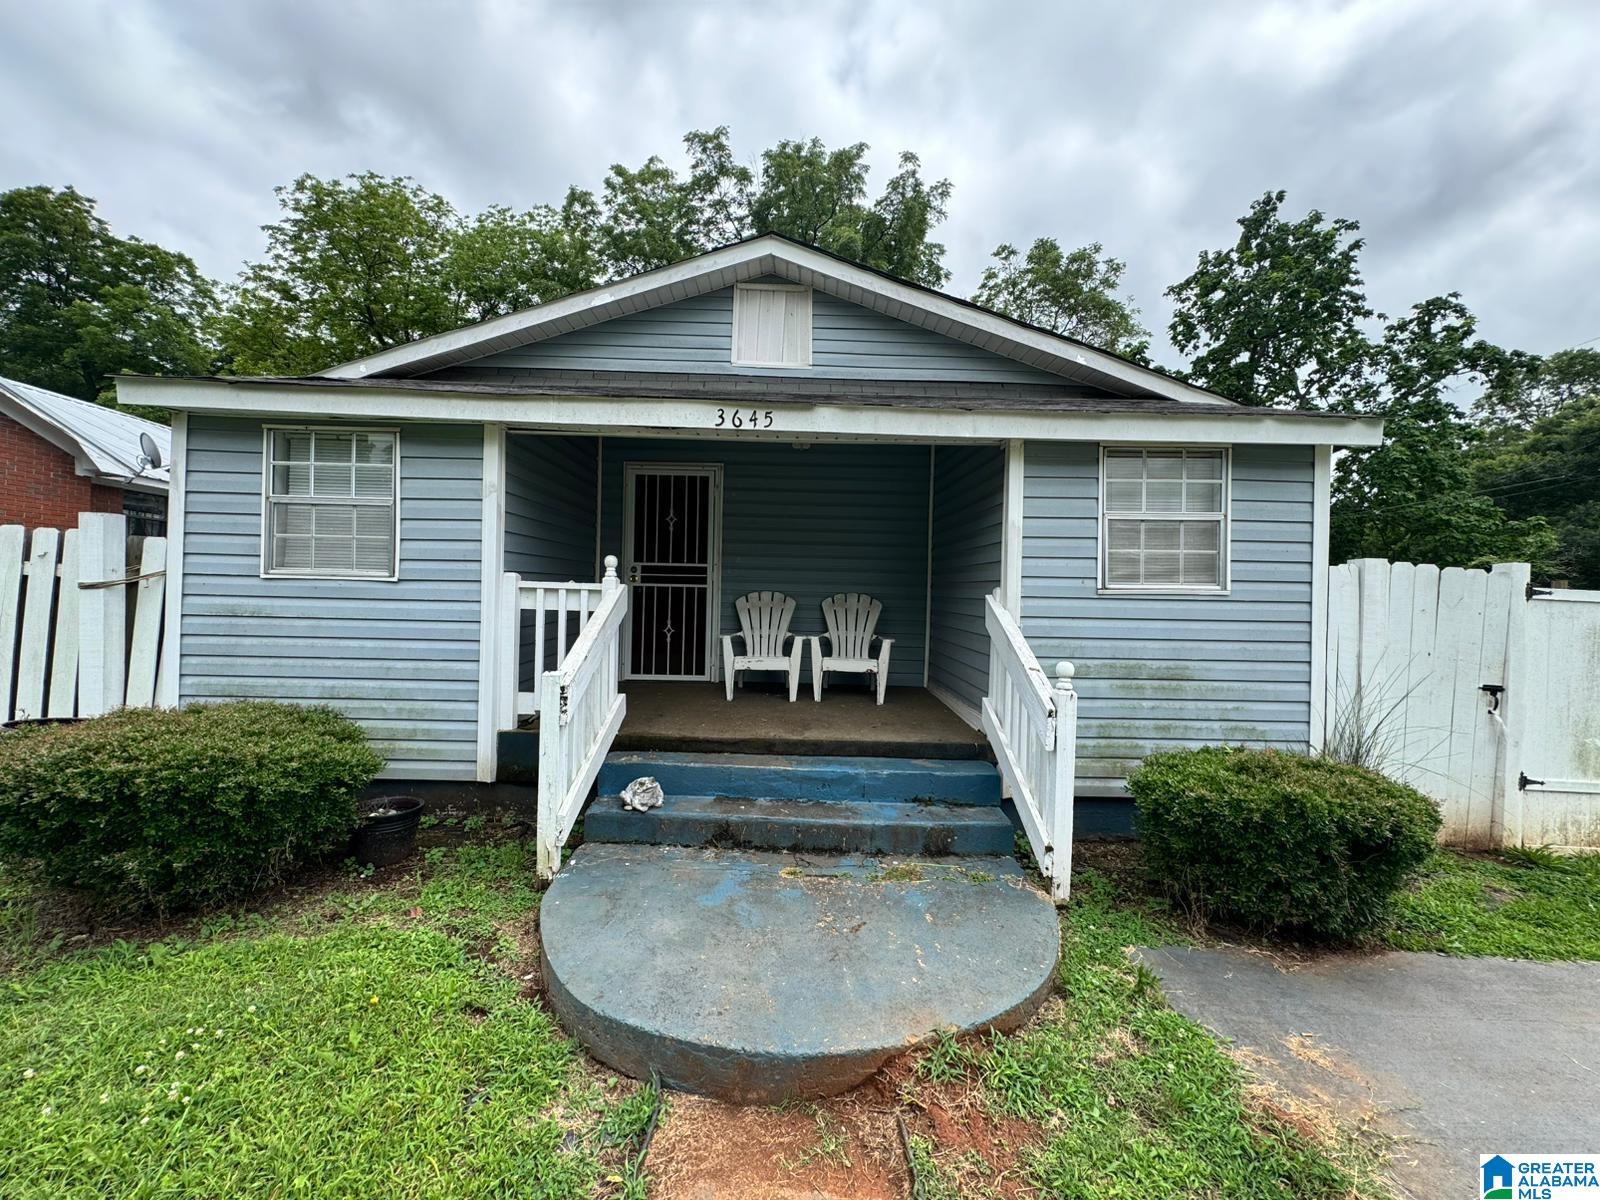
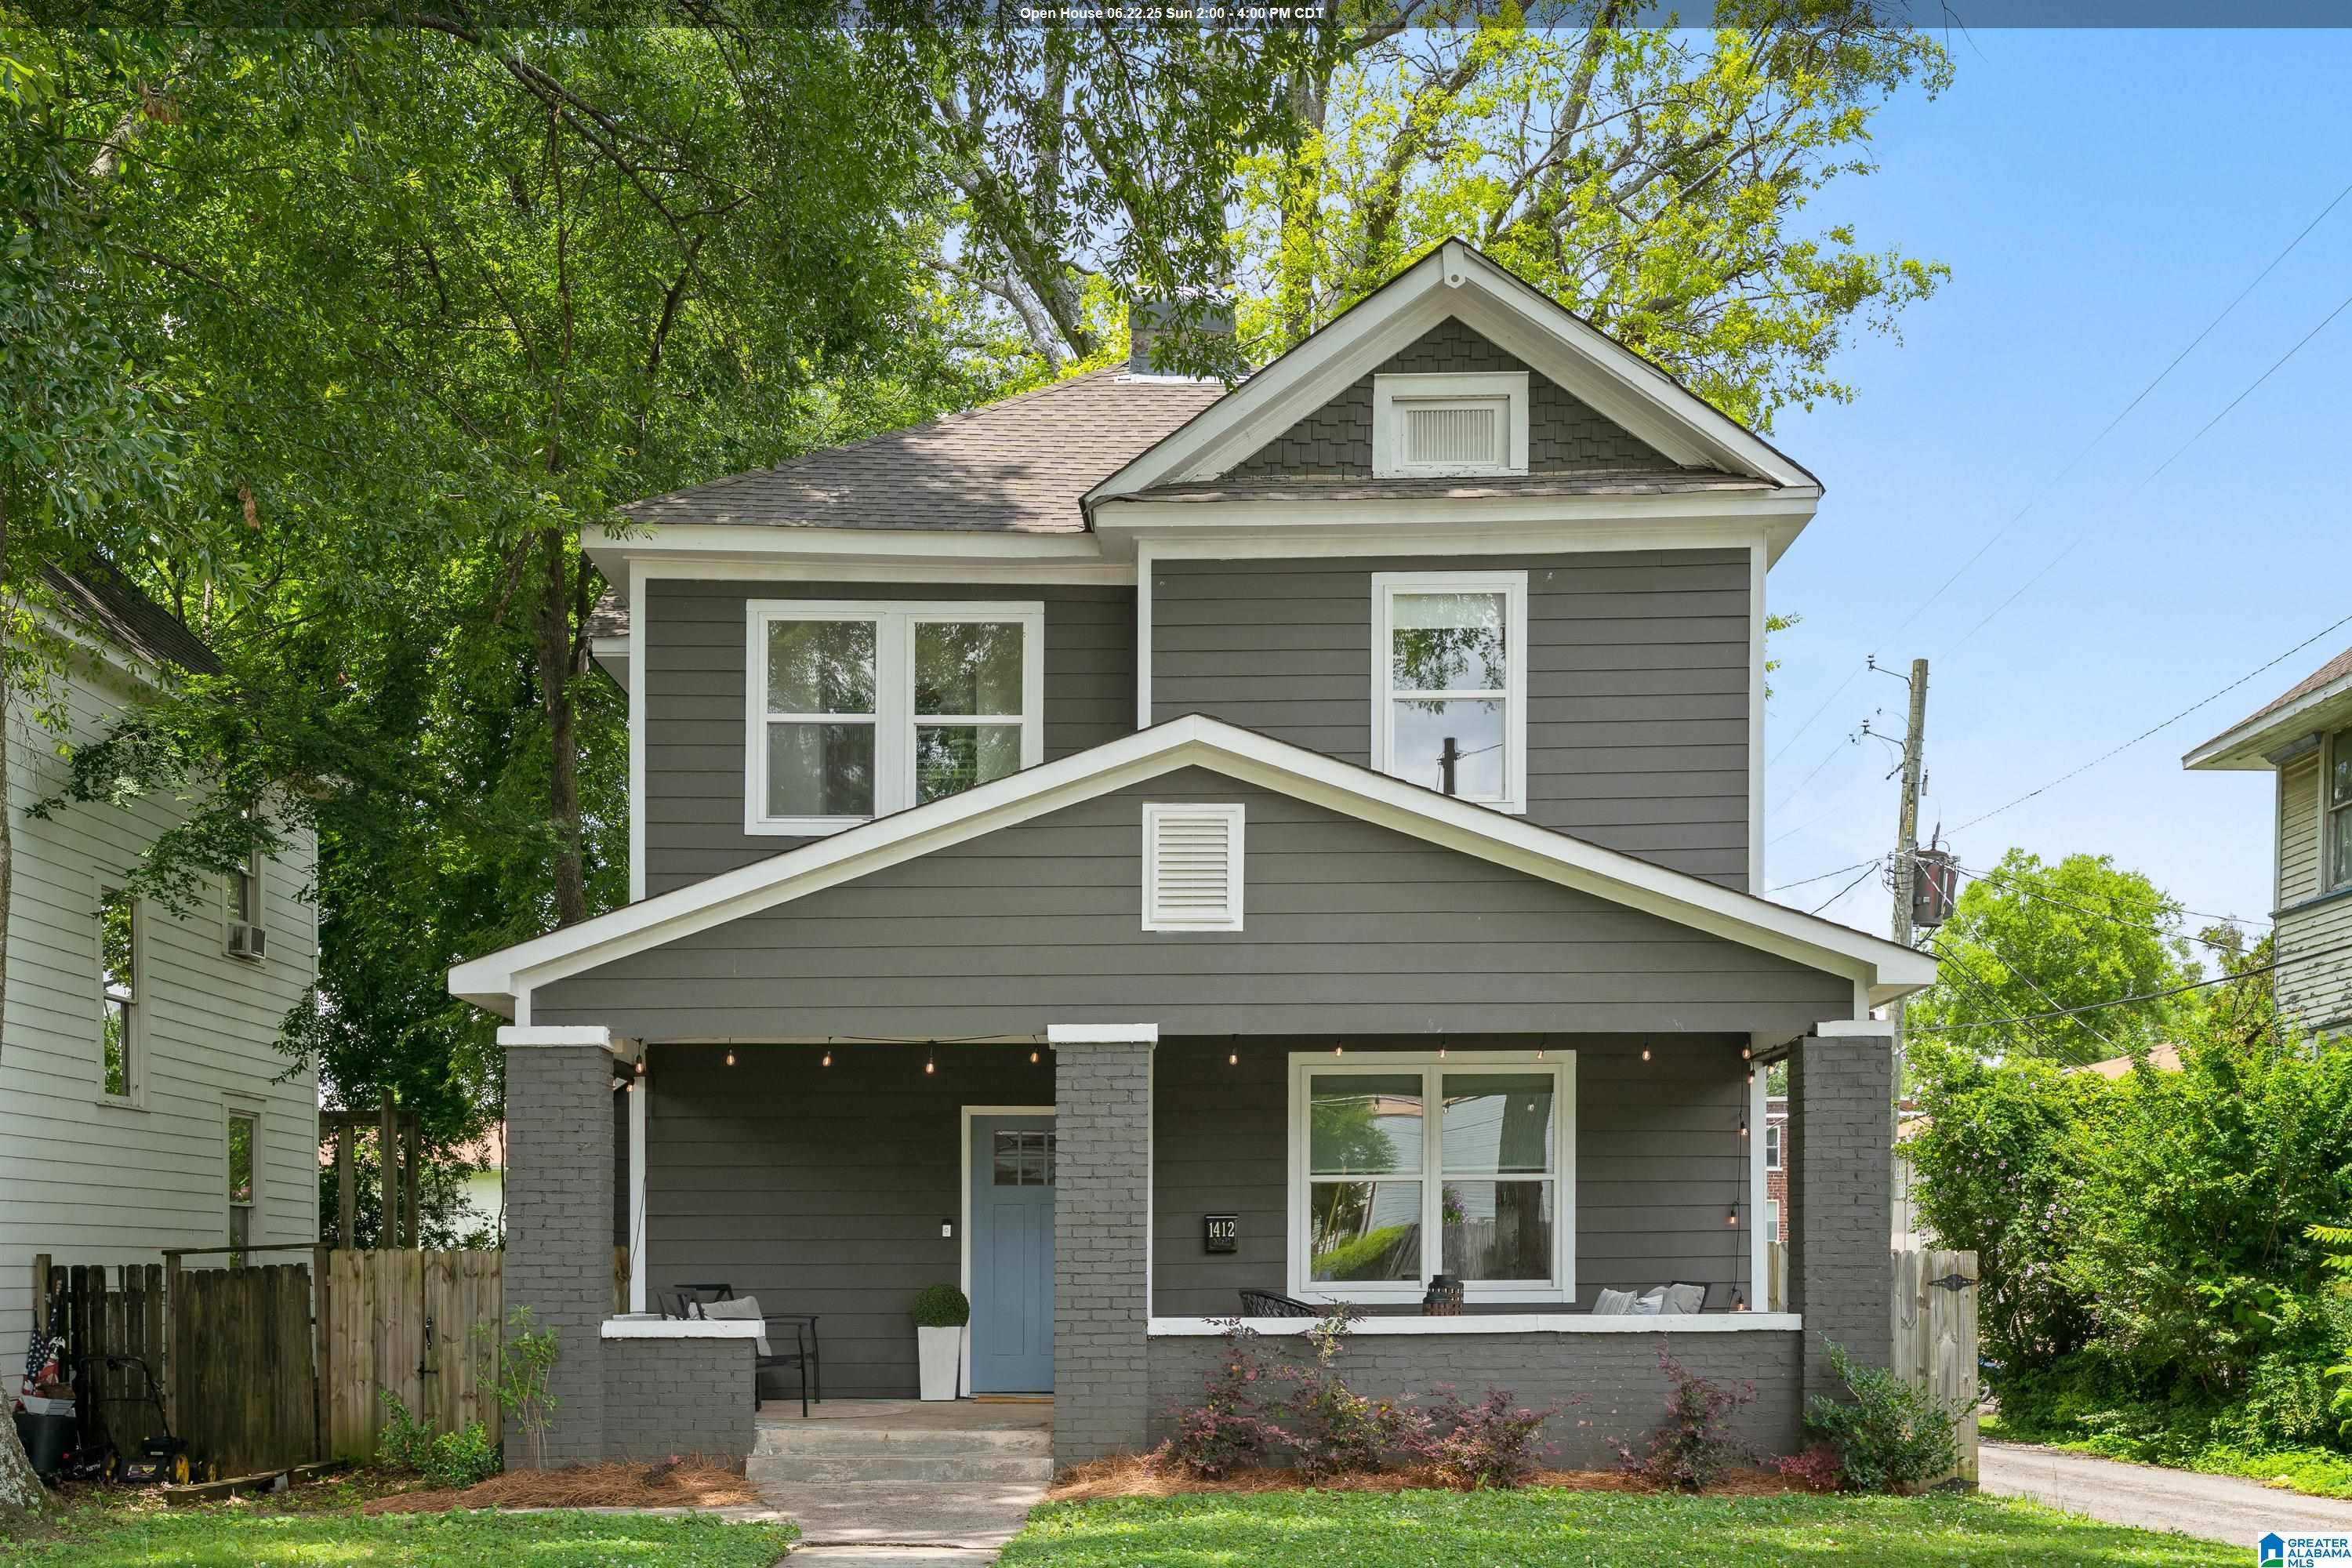
Active
$74,900
2
bds
|
0
ba
|
1,121
sqft
|
built
1920
3645 Pine Ave SW, Birmingham, AL 35221
$759
Cash flow
11.8%
Cash-on-Cash Return
12.2%
Cap rate
1.5%
Rent to Value Ratio
923 out of 1,038 properties for sale in Birmingham, AL
Limited Results Shown
Create a free account, or log in to reveal all property listings and enjoy the complete experience.
Active
$459,900
3
bds
|
0
ba
|
1,664
sqft
|
built
1958
4369 Mountaindale Rd, Birmingham, AL 35213
$-269
Cash flow
-3.1%
Cash-on-Cash Return
5.6%
Cap rate
0.7%
Rent to Value Ratio
Active
$354,900
3
bds
|
0
ba
|
1,912
sqft
|
built
1992
4872 Keith Dr, Birmingham, AL 35242
$-272
Cash flow
-4.0%
Cash-on-Cash Return
5.4%
Cap rate
0.6%
Rent to Value Ratio
Active under contract
$149,900
4
bds
|
0
ba
|
2,790
sqft
|
built
1920
1700 Bush Blvd W, Birmingham, AL 35208
$595
Cash flow
20.7%
Cash-on-Cash Return
11.0%
Cap rate
1.3%
Rent to Value Ratio
Active
$450,000
4
bds
|
0
ba
|
2,363
sqft
|
built
2006
199 Belvedere Dr, Birmingham, AL 35242
$-665
Cash flow
-7.7%
Cash-on-Cash Return
4.5%
Cap rate
0.6%
Rent to Value Ratio
Active
$320,000
3
bds
|
0
ba
|
2,860
sqft
|
built
1953
1235 Cresthill Rd, Birmingham, AL 35213
$-158
Cash flow
-2.6%
Cash-on-Cash Return
5.7%
Cap rate
0.7%
Rent to Value Ratio
Active
$155,000
4
bds
|
0
ba
|
1,500
sqft
|
built
1961
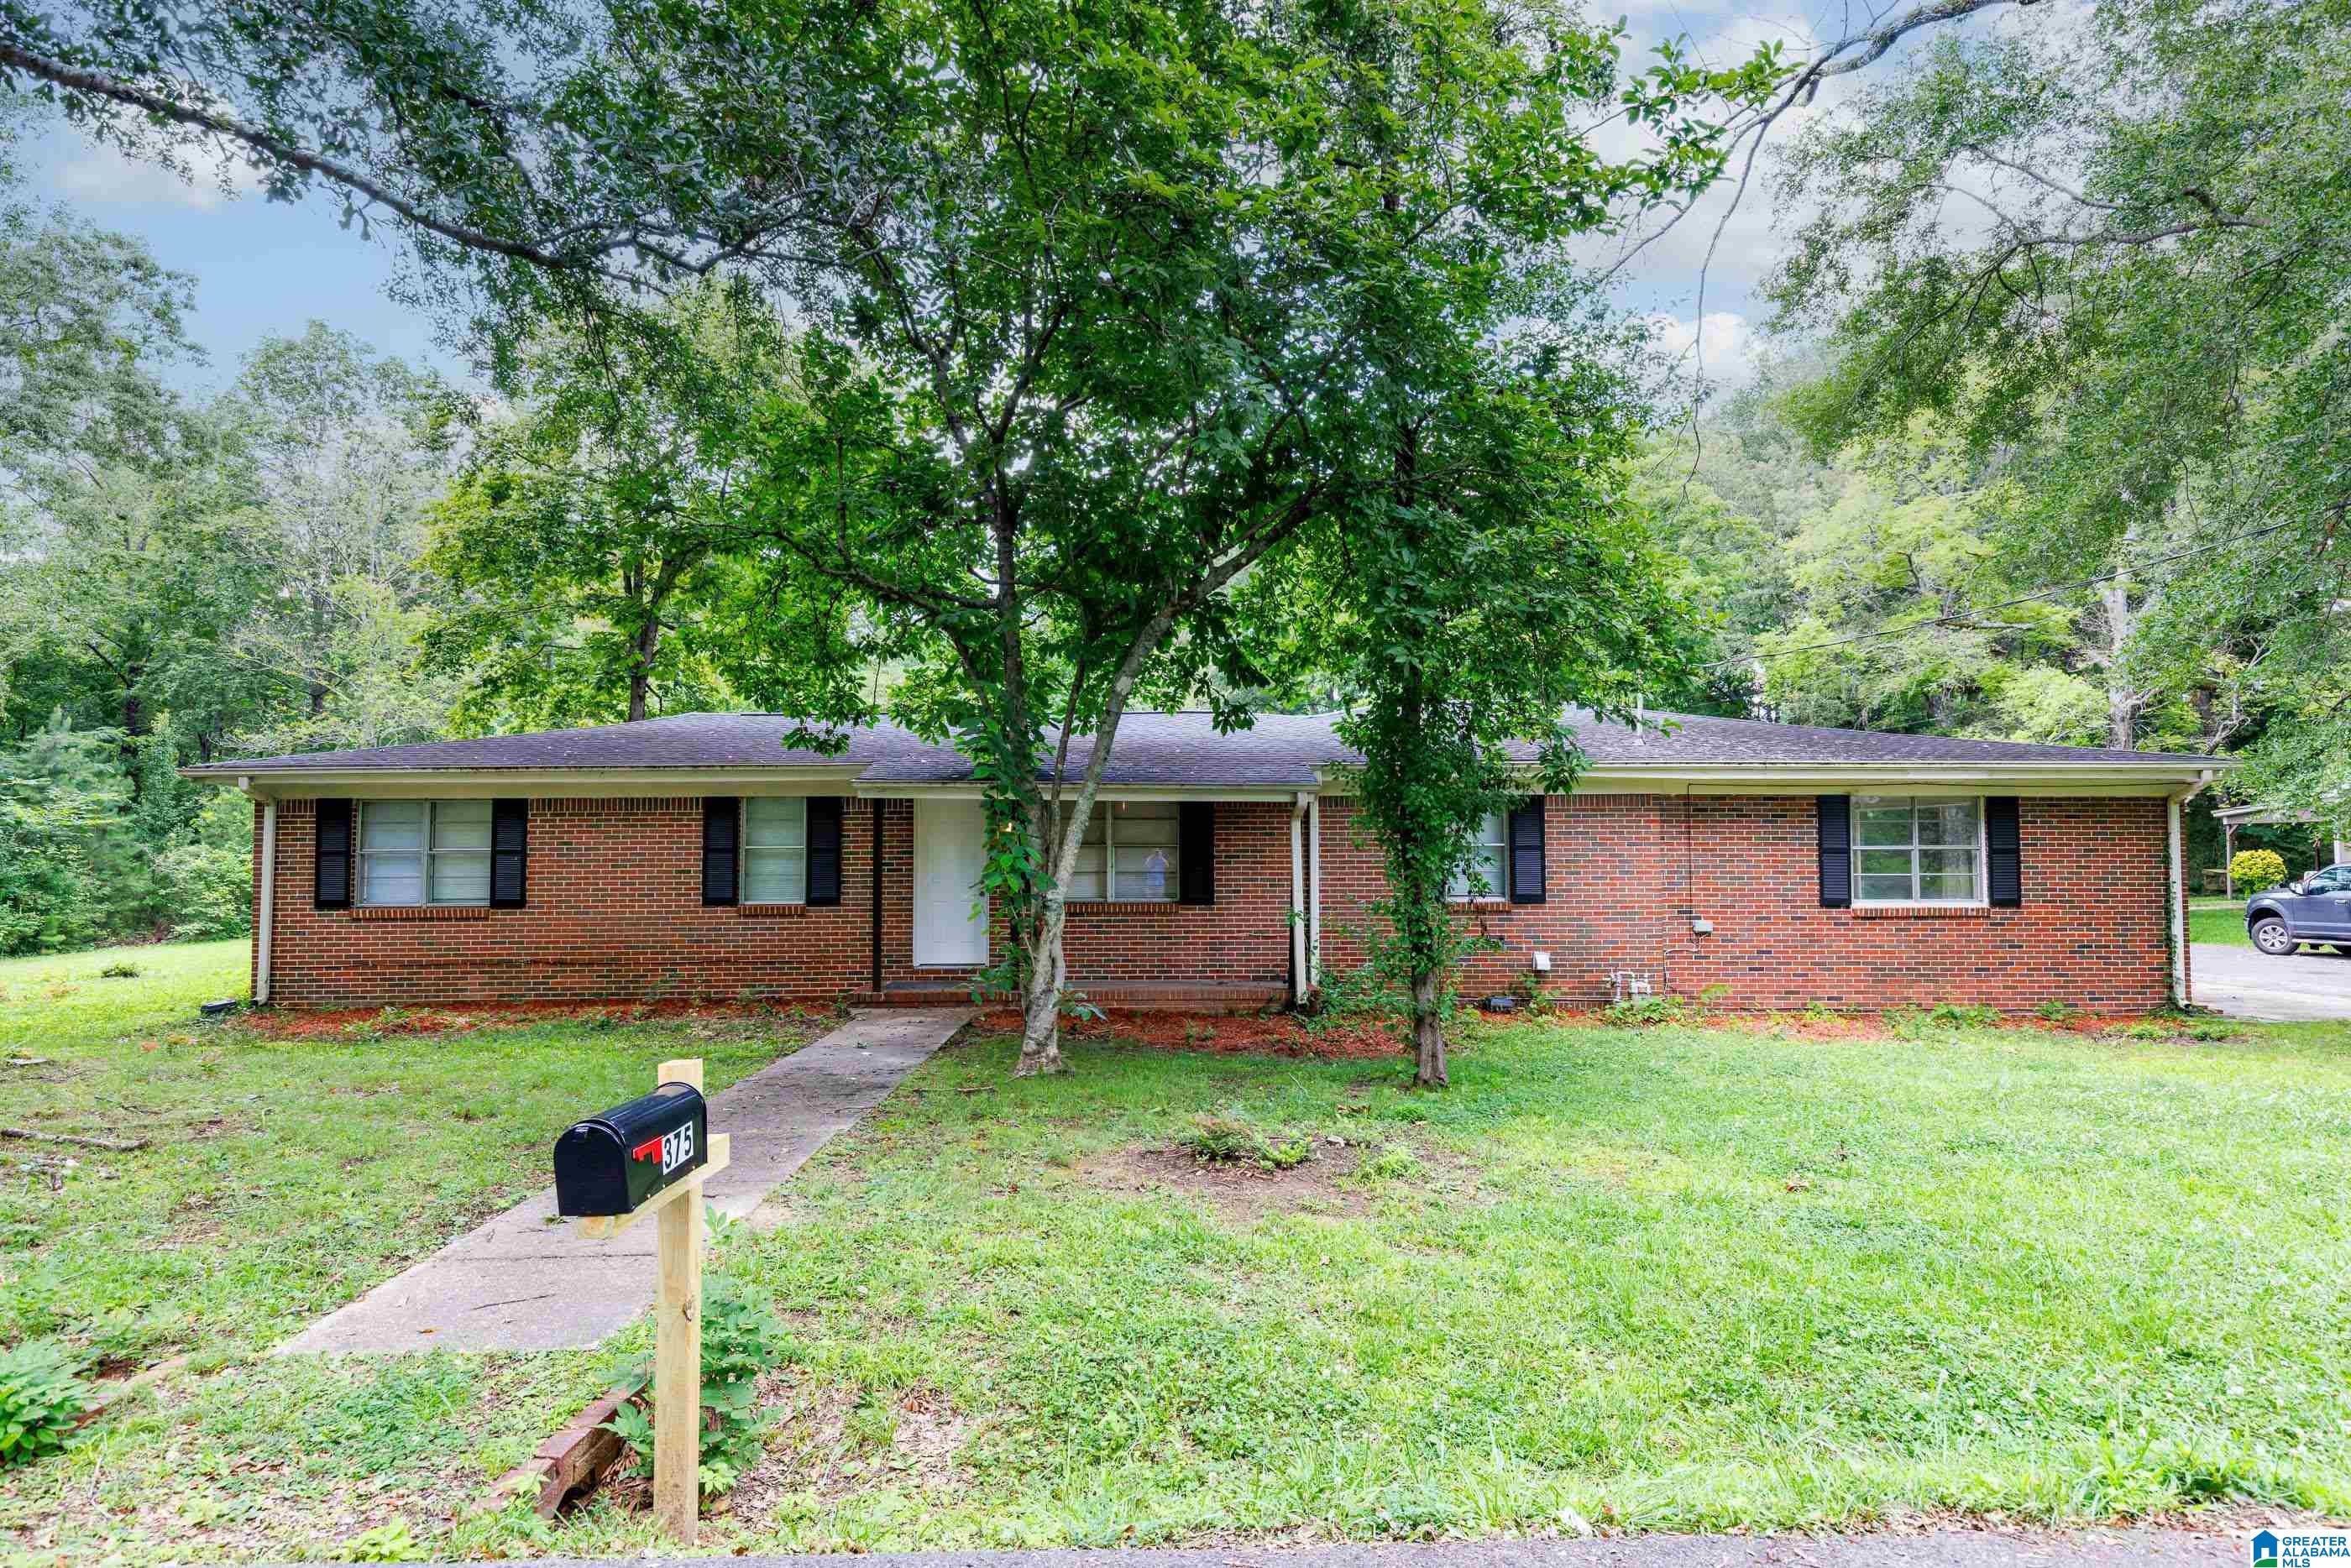
375 Clinton St, Birmingham, AL 35214
$223
Cash flow
7.5%
Cash-on-Cash Return
8.0%
Cap rate
1.0%
Rent to Value Ratio
Active under contract
$545,000
4
bds
|
0
ba
|
2,432
sqft
|
built
2019
144 Griffin Park Trl, Birmingham, AL 35242
$-746
Cash flow
-7.1%
Cash-on-Cash Return
4.6%
Cap rate
0.6%
Rent to Value Ratio
Active
$264,900
5
bds
|
0
ba
|
2,856
sqft
|
built
1955
704 Circlewood Ln, Birmingham, AL 35214
$-283
Cash flow
-5.6%
Cash-on-Cash Return
5.0%
Cap rate
0.6%
Rent to Value Ratio
Active
$239,900
7
bds
|
0
ba
|
2,756
sqft
|
built
1971
1281 Pine Tree Dr, Birmingham, AL 35235
$-14
Cash flow
-0.3%
Cash-on-Cash Return
6.2%
Cap rate
0.8%
Rent to Value Ratio
Active
$76,000
3
bds
|
0
ba
|
1,344
sqft
|
built
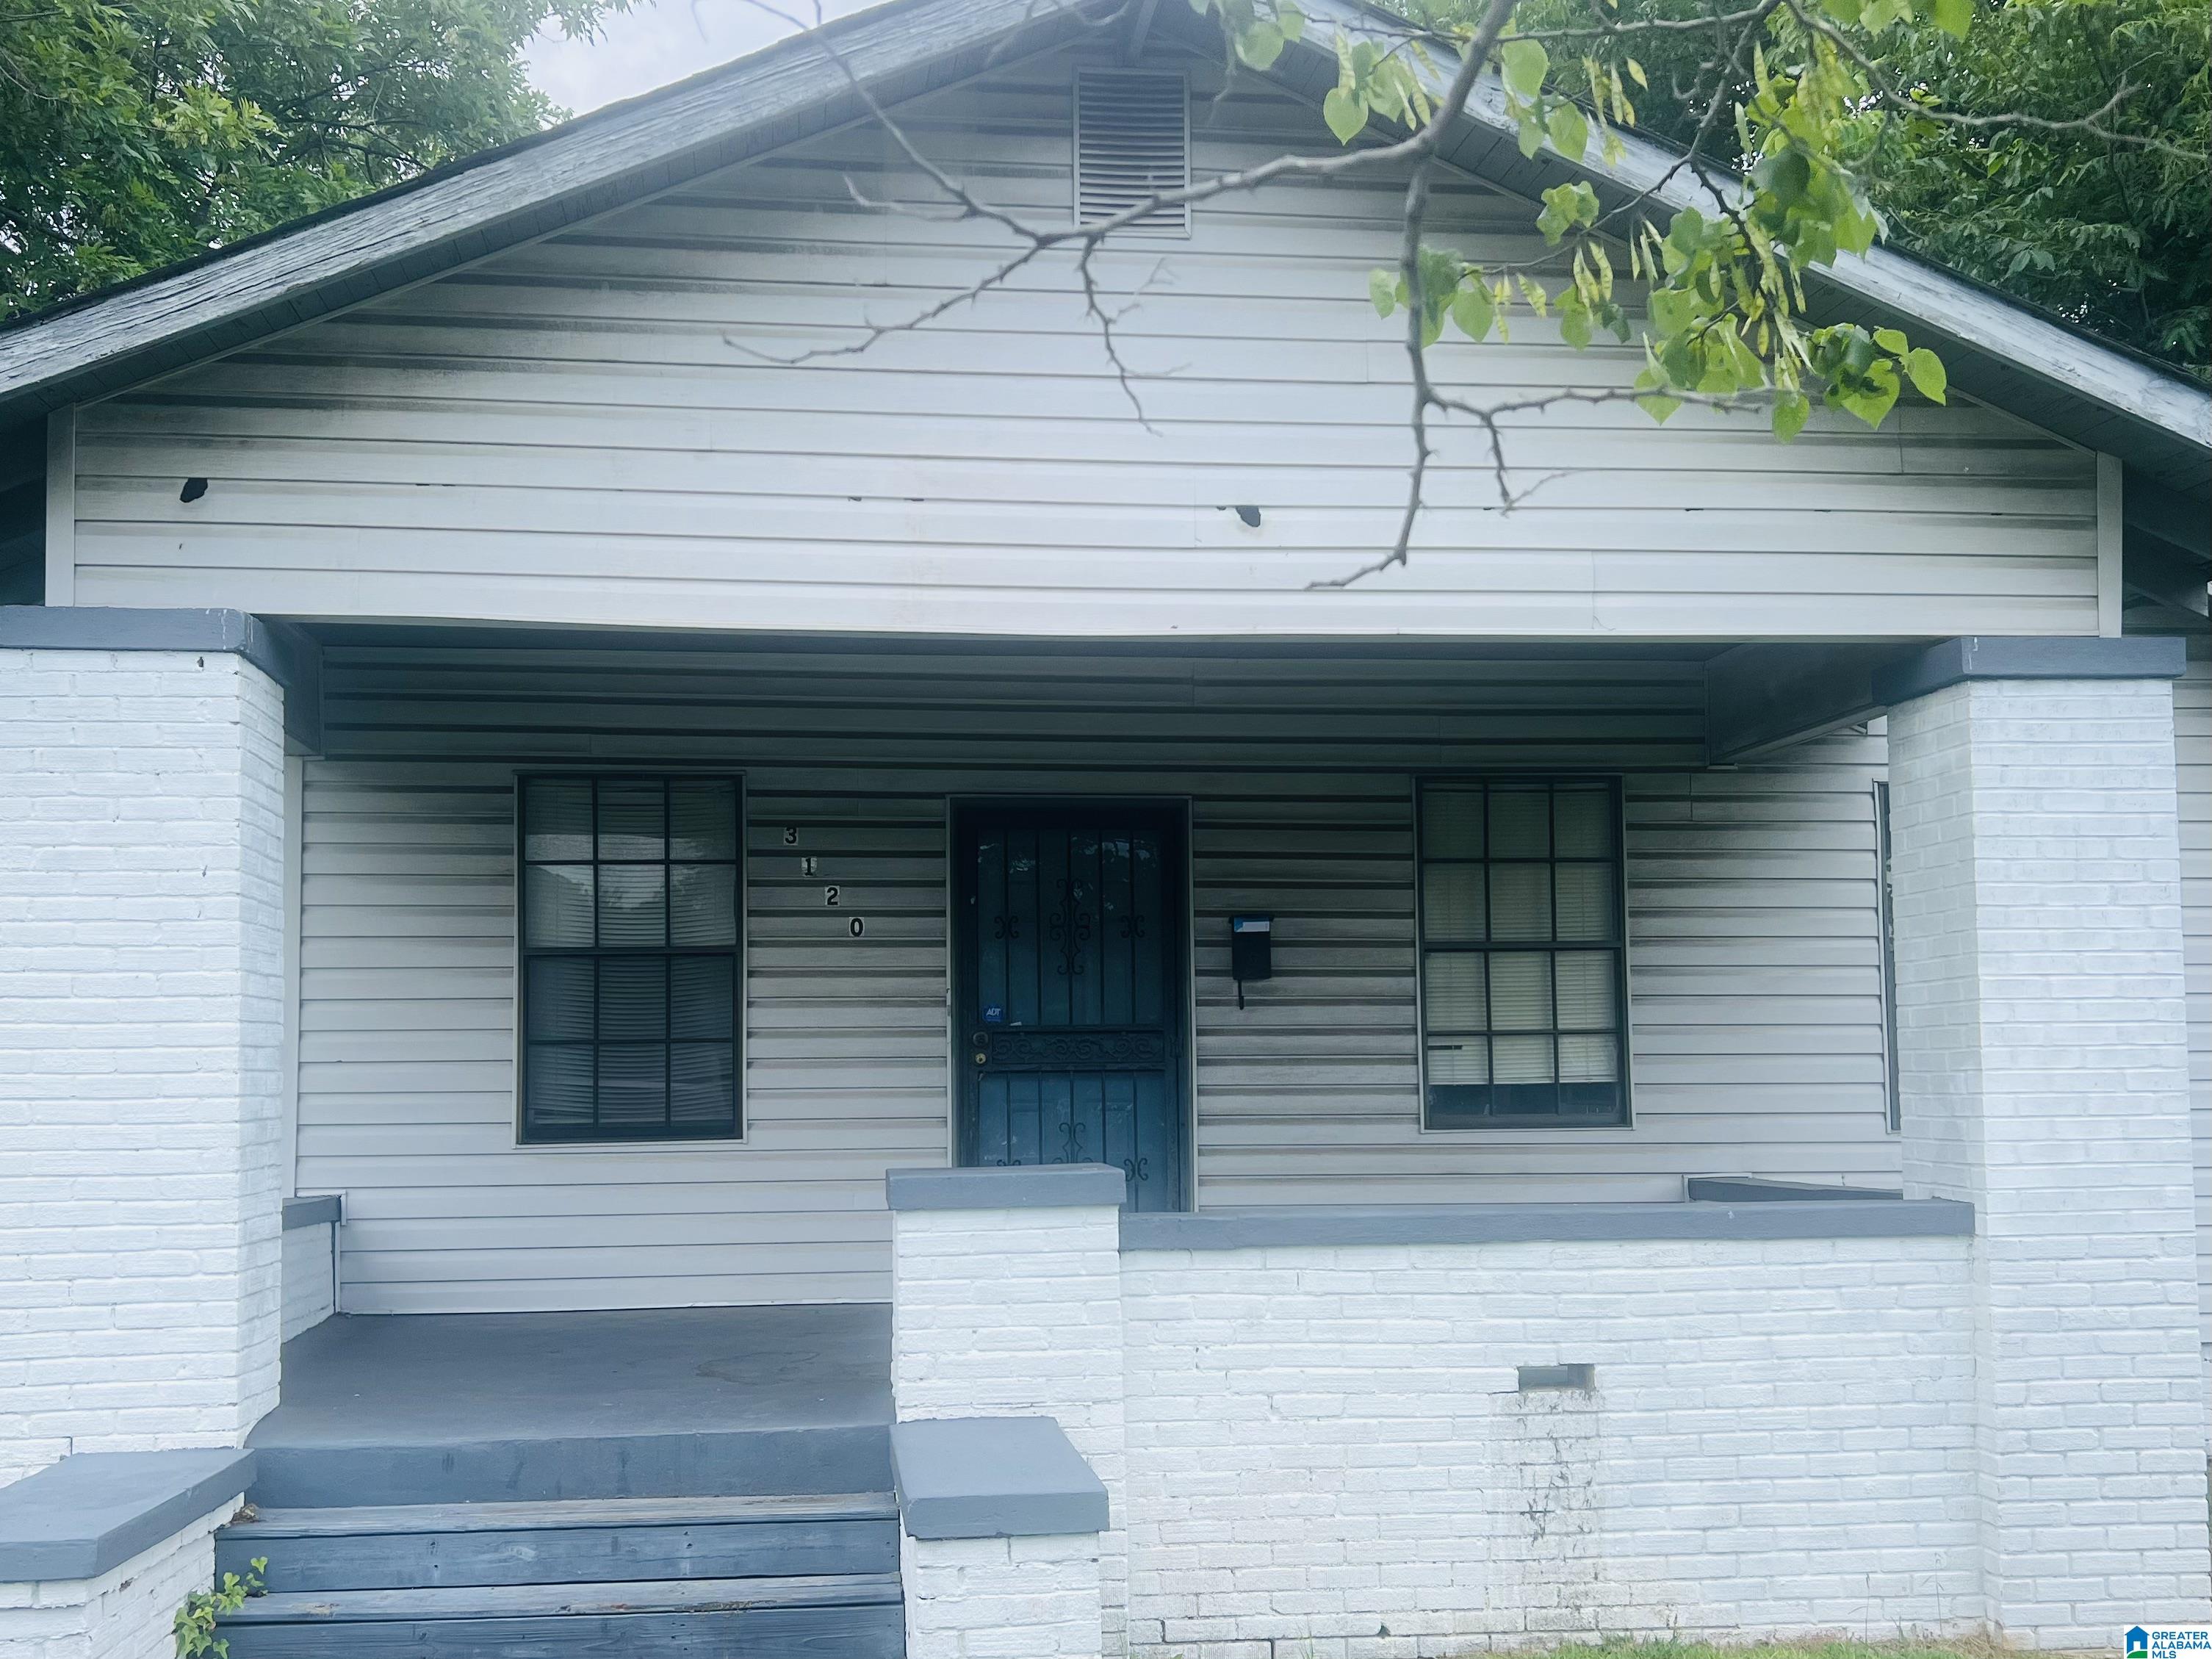
1930
3120 Avenue I, Birmingham, AL 35218
$361
Cash flow
24.8%
Cash-on-Cash Return
12.0%
Cap rate
1.4%
Rent to Value Ratio
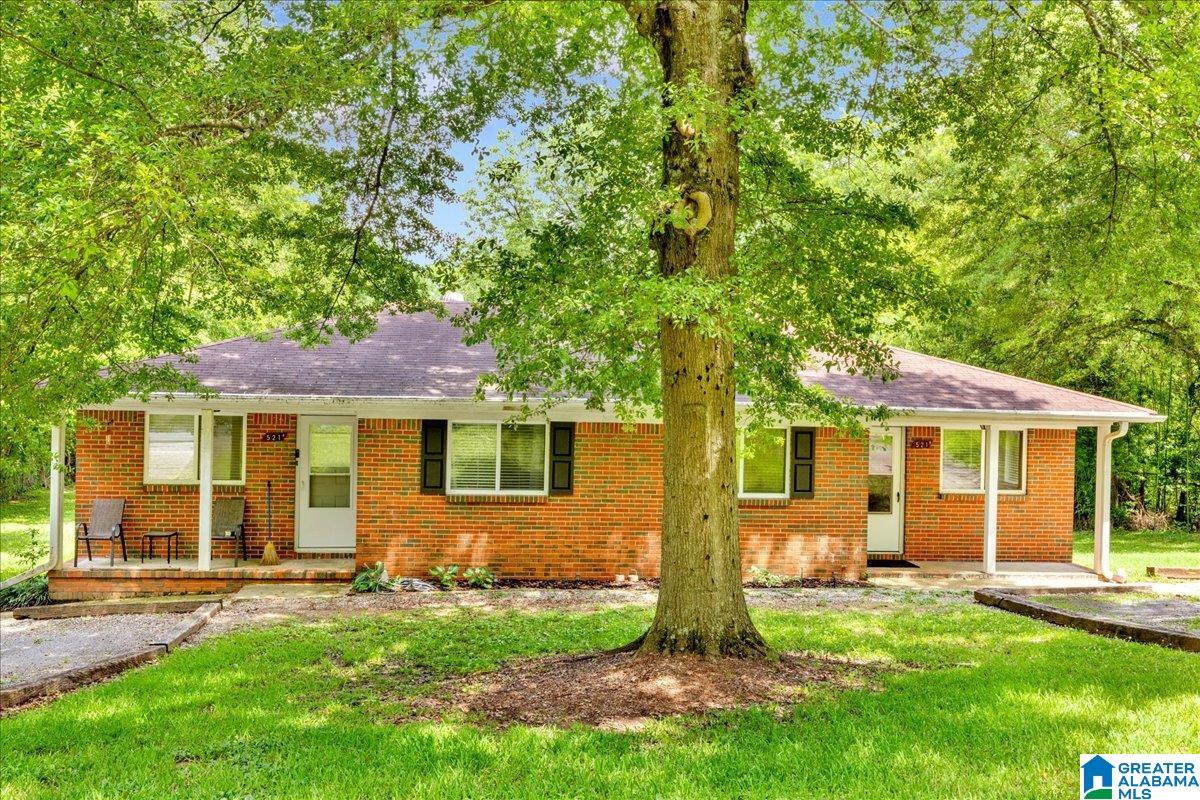
Active
$170,000
4
bds
|
0
ba
|
0
sqft
|
built
1950
521 Crumley Chapel Rd, Birmingham, AL 35214
$-62
Cash flow
-1.9%
Cash-on-Cash Return
5.8%
Cap rate
0.7%
Rent to Value Ratio
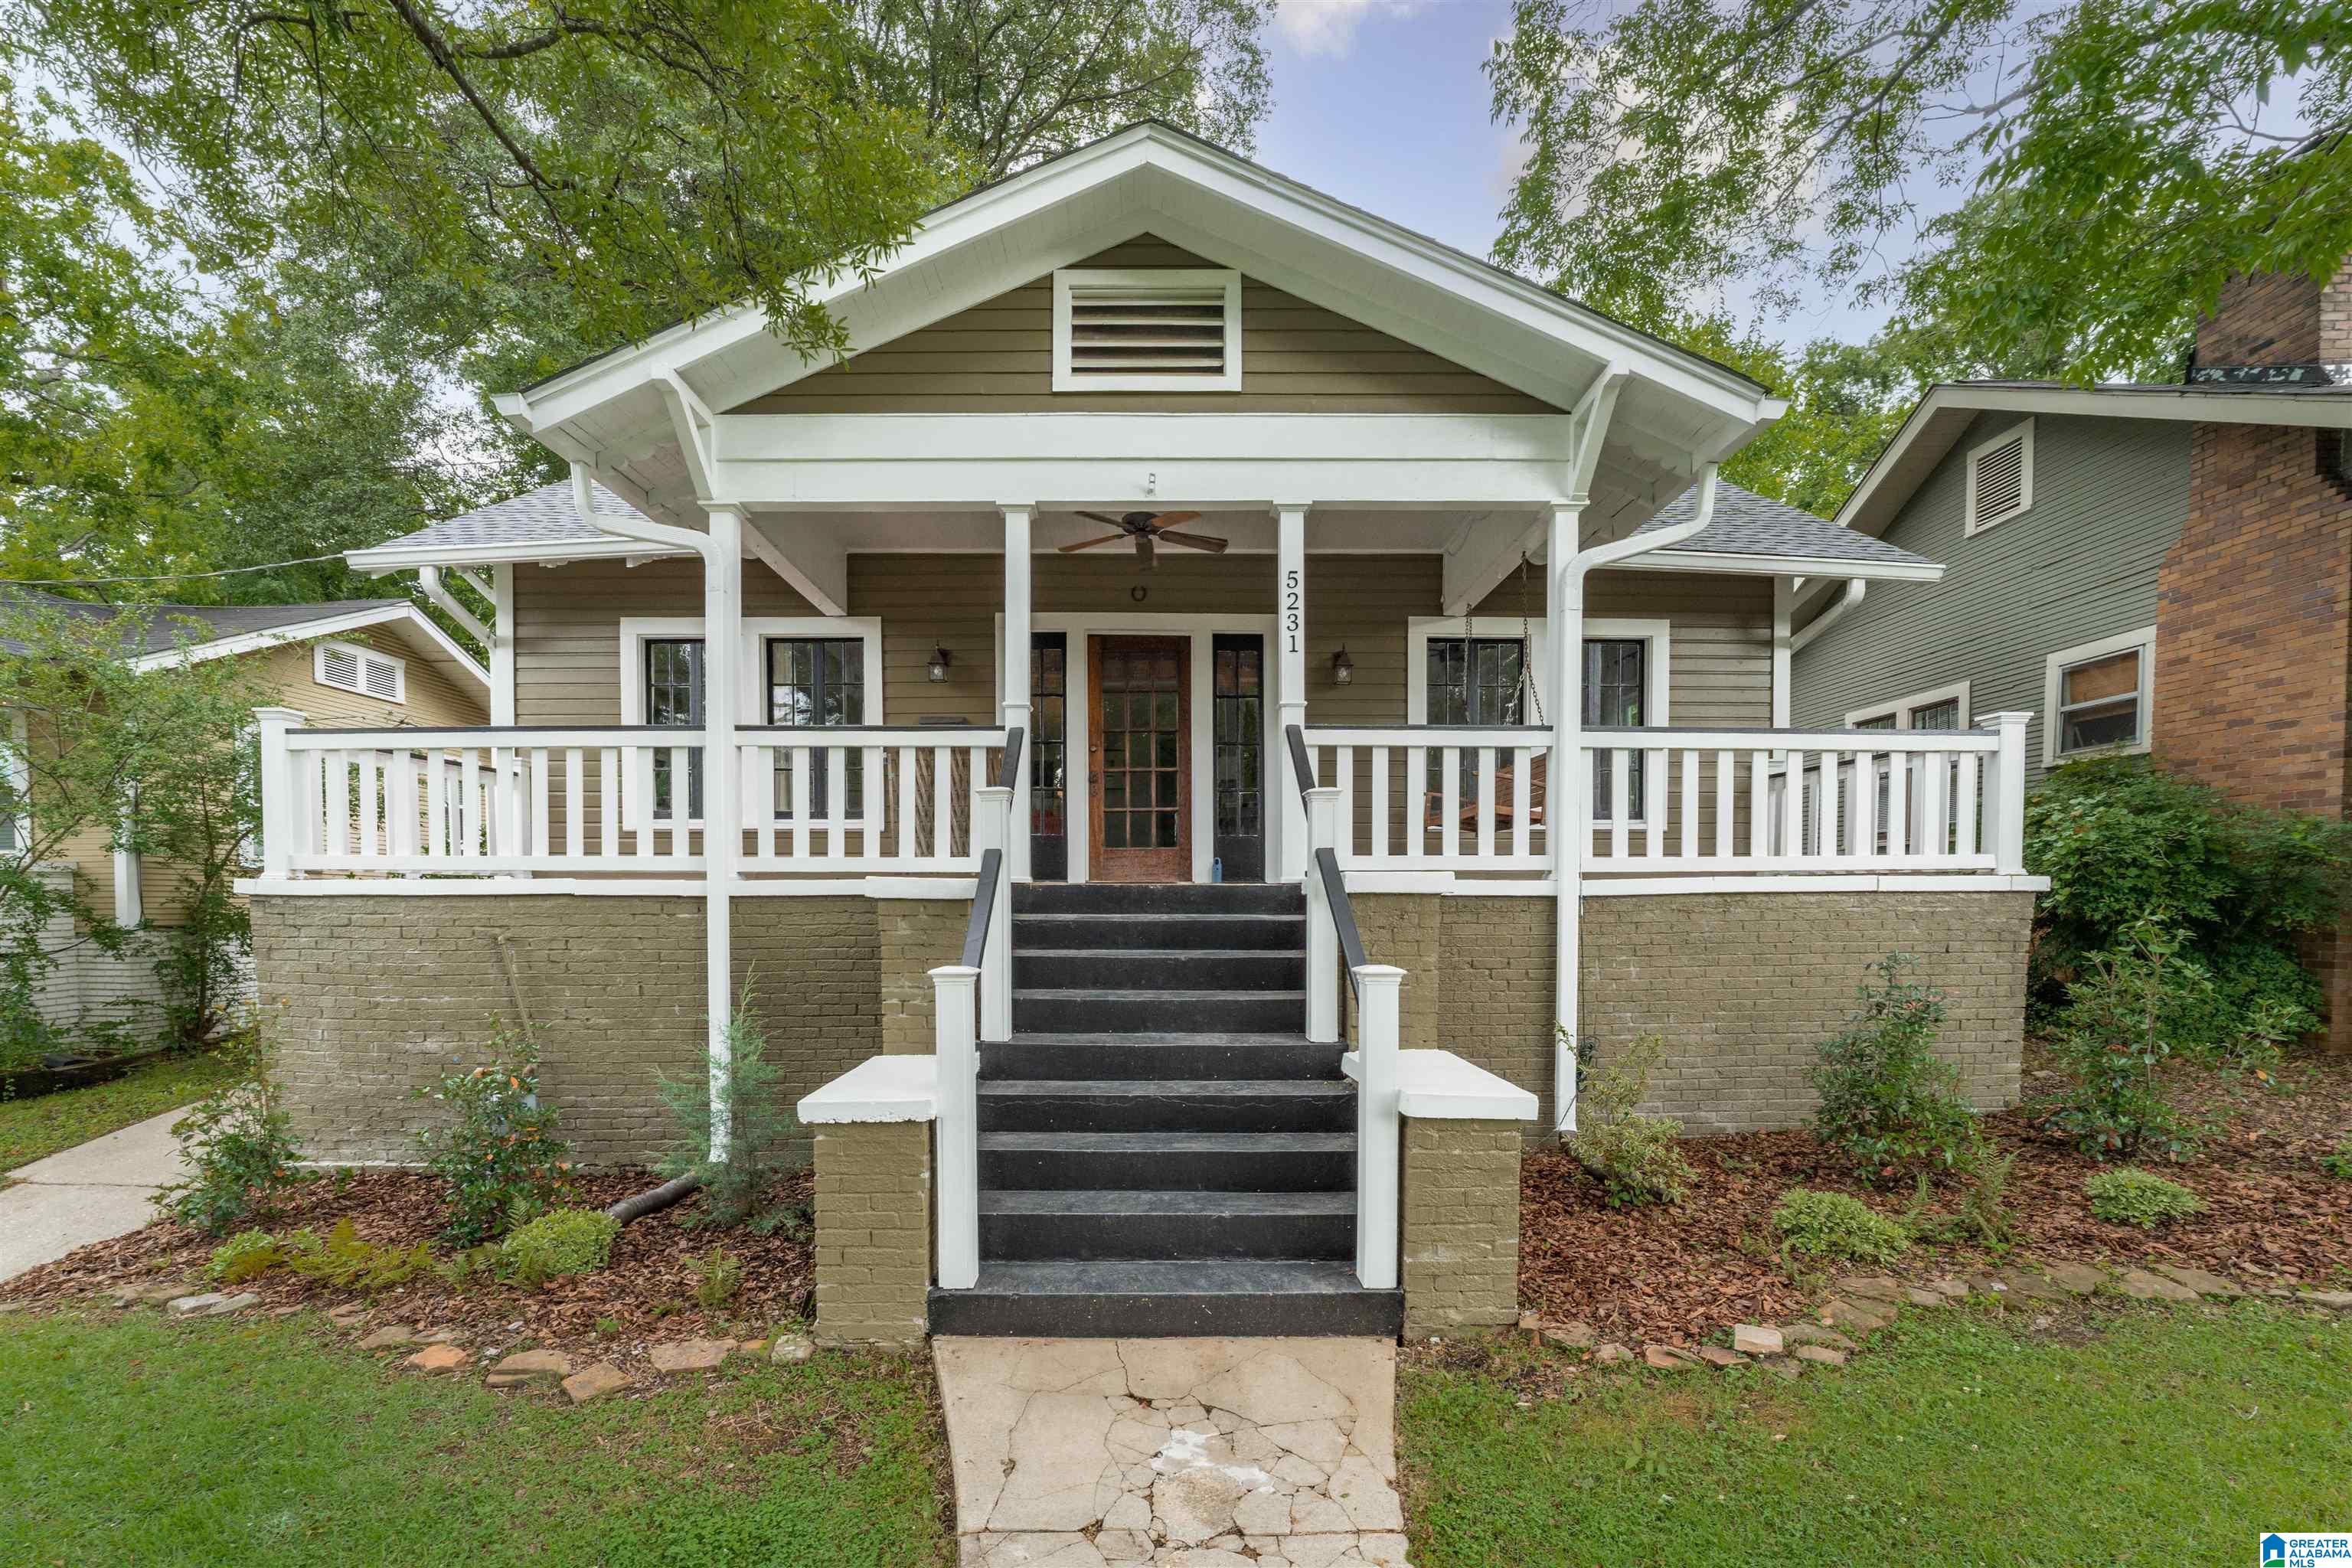
Active
$419,900
3
bds
|
0
ba
|
1,648
sqft
|
built
1935
5231 6th Ave S, Birmingham, AL 35212
$-612
Cash flow
-7.6%
Cash-on-Cash Return
4.5%
Cap rate
0.5%
Rent to Value Ratio
Active
$154,900
3
bds
|
0
ba
|
1,780
sqft
|
built
1960
907 Barnisdale Rd, Birmingham, AL 35235
$155
Cash flow
5.2%
Cash-on-Cash Return
7.5%
Cap rate
0.9%
Rent to Value Ratio
Active
$205,000
3
bds
|
0
ba
|
2,408
sqft
|
built
1948
6712 2nd Ave S, Birmingham, AL 35212
$-315
Cash flow
-8.0%
Cash-on-Cash Return
4.4%
Cap rate
0.5%
Rent to Value Ratio
Active
$98,000
3
bds
|
0
ba
|
1,269
sqft
|
built
1925
4801 Court S, Birmingham, AL 35208
$315
Cash flow
16.8%
Cash-on-Cash Return
10.1%
Cap rate
1.2%
Rent to Value Ratio
Active
$450,000
4
bds
|
0
ba
|
1,922
sqft
|
built
1920
1412 17th St S, Birmingham, AL 35205
$-425
Cash flow
-4.9%
Cash-on-Cash Return
5.2%
Cap rate
0.6%
Rent to Value Ratio
Active
$1,150,000
5
bds
|
0
ba
|
4,491
sqft
|
built
1994
6355 Cahaba Valley Rd, Birmingham, AL 35242
$-2,641
Cash flow
-12.0%
Cash-on-Cash Return
3.5%
Cap rate
0.4%
Rent to Value Ratio
Active
$1,050,000
3
bds
|
0
ba
|
0
sqft
|
built
1983
409 Oporto Madrid Blvd S, Birmingham, AL 35206
$-4,119
Cash flow
-20.5%
Cash-on-Cash Return
1.6%
Cap rate
0.2%
Rent to Value Ratio

Active under contract
$379,000
3
bds
|
0
ba
|
1,595
sqft
|
built
1954
5305 11th Ave S, Birmingham, AL 35222
$-260
Cash flow
-3.6%
Cash-on-Cash Return
5.5%
Cap rate
0.7%
Rent to Value Ratio
Active
$115,000
3
bds
|
0
ba
|
1,202
sqft
|
built
1931
117 67th Pl N, Birmingham, AL 35206
$226
Cash flow
10.3%
Cash-on-Cash Return
8.6%
Cap rate
1.0%
Rent to Value Ratio
Active
$50,000
2
bds
|
0
ba
|
986
sqft
|
built
1930
7424 England Ave, Birmingham, AL 35224
$690
Cash flow
16.1%
Cash-on-Cash Return
16.6%
Cap rate
2.0%
Rent to Value Ratio
Active
$149,900
2
bds
|
0
ba
|
1,328
sqft
|
built
1950
445 Plaza Dr, Birmingham, AL 35235
$181
Cash flow
6.3%
Cash-on-Cash Return
7.7%
Cap rate
0.9%
Rent to Value Ratio
Active
$390,000
4
bds
|
0
ba
|
3,454
sqft
|
built
2008
5105 Marie Cir, Birmingham, AL 35215
$-662
Cash flow
-8.9%
Cash-on-Cash Return
4.2%
Cap rate
0.5%
Rent to Value Ratio
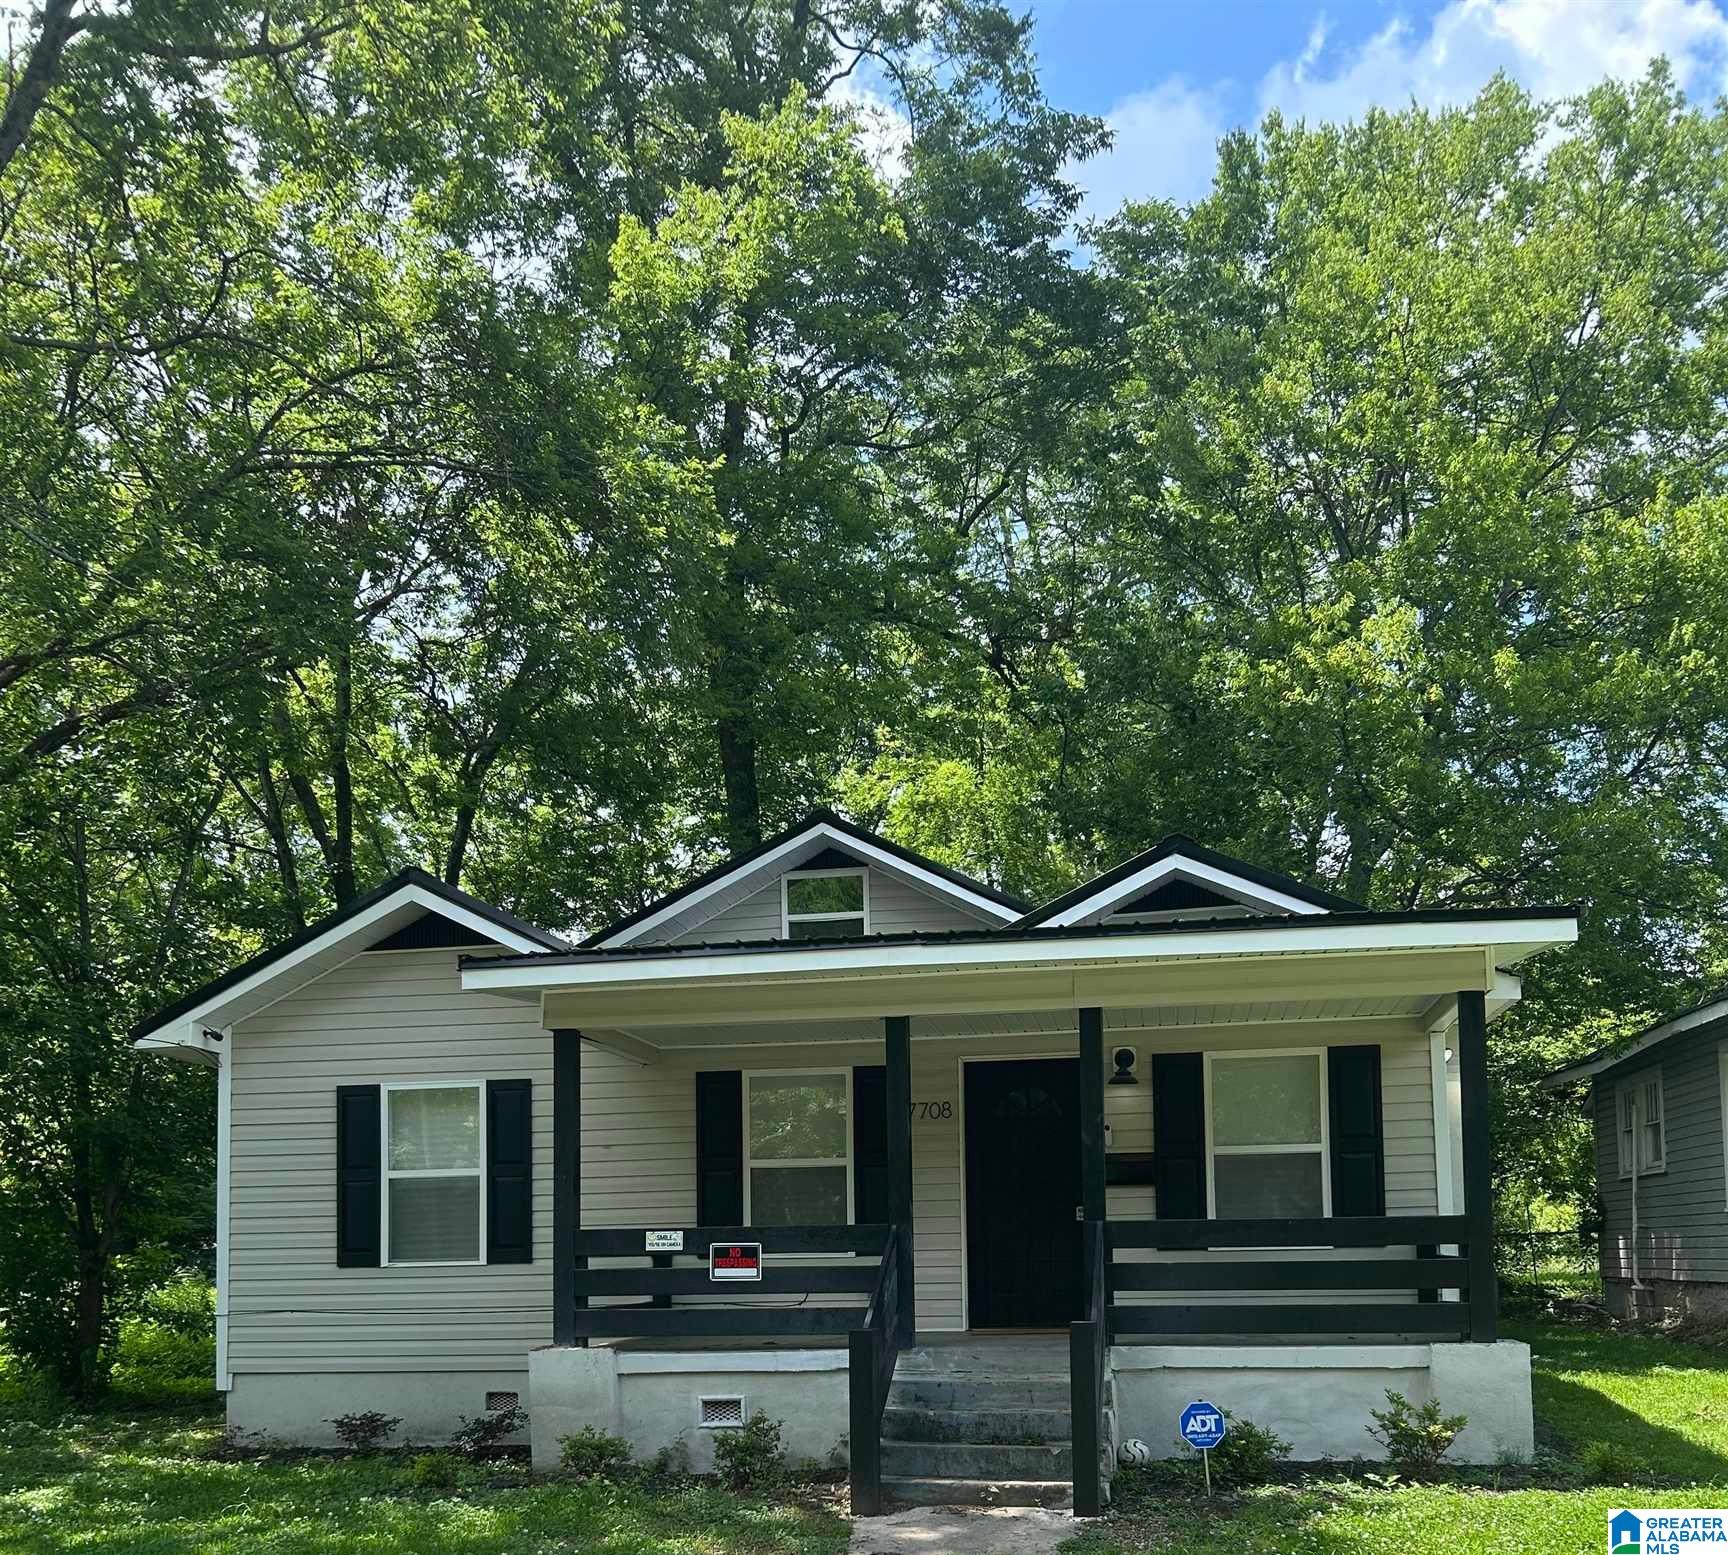
Active
$146,900
3
bds
|
0
ba
|
1,107
sqft
|
built
1935
7708 6th Ave N, Birmingham, AL 35206
$59
Cash flow
2.1%
Cash-on-Cash Return
6.8%
Cap rate
0.8%
Rent to Value Ratio
Active under contract
$170,000
3
bds
|
0
ba
|
1,846
sqft
|
built
1965
741 Lance Blvd, Birmingham, AL 35206
$214
Cash flow
6.6%
Cash-on-Cash Return
7.8%
Cap rate
0.9%
Rent to Value Ratio
Pending
$49,000
3
bds
|
0
ba
|
2,752
sqft
|
built
1920
1324 22nd St N, Birmingham, AL 35234
$690
Cash flow
16.4%
Cash-on-Cash Return
16.9%
Cap rate
2.0%
Rent to Value Ratio
Active
$74,900
2
bds
|
0
ba
|
1,121
sqft
|
built
1920
3645 Pine Ave SW, Birmingham, AL 35221
$759
Cash flow
11.8%
Cash-on-Cash Return
12.2%
Cap rate
1.5%
Rent to Value Ratio
Active under contract
$624,900
4
bds
|
0
ba
|
2,720
sqft
|
built
2020
1039 Norman Dr, Birmingham, AL 35242
$-1,169
Cash flow
-9.8%
Cash-on-Cash Return
4.0%
Cap rate
0.5%
Rent to Value Ratio
Active
$135,000
3
bds
|
0
ba
|
965
sqft
|
built
1955
1225 Lynn Acres Dr, Birmingham, AL 35215
$52
Cash flow
2.0%
Cash-on-Cash Return
6.7%
Cap rate
0.8%
Rent to Value Ratio
Active
$205,000
3
bds
|
0
ba
|
1,164
sqft
|
built
2012
149 Martin Dr, Birmingham, AL 35215
$-108
Cash flow
-2.7%
Cash-on-Cash Return
5.7%
Cap rate
0.7%
Rent to Value Ratio
Active
$499,900
3
bds
|
0
ba
|
1,633
sqft
|
built
1950
2000 21st Ave S, Birmingham, AL 35209
$-617
Cash flow
-6.4%
Cash-on-Cash Return
4.8%
Cap rate
0.6%
Rent to Value Ratio
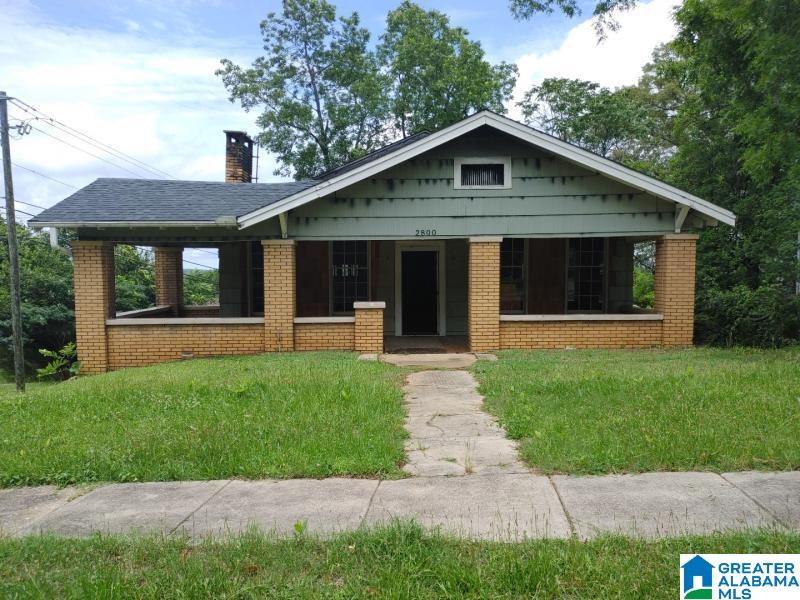
Active
$99,900
4
bds
|
0
ba
|
2,540
sqft
|
built
1930
2800 20th Street Ensley, Birmingham, AL 35208
$443
Cash flow
23.1%
Cash-on-Cash Return
11.6%
Cap rate
1.4%
Rent to Value Ratio
Active
$65,000
3
bds
|
0
ba
|
1,170
sqft
|
built
1949
1414 27th Street Ensley, Birmingham, AL 35218
$828
Cash flow
14.8%
Cash-on-Cash Return
15.3%
Cap rate
1.8%
Rent to Value Ratio
Active under contract
$135,000
3
bds
|
0
ba
|
1,226
sqft
|
built
1978
1117 Oak Creek Trl NE, Birmingham, AL 35215
$259
Cash flow
10.0%
Cash-on-Cash Return
8.6%
Cap rate
1.0%
Rent to Value Ratio
Active
$230,000
4
bds
|
0
ba
|
2,352
sqft
|
built
1976
2232 Cedar Crest Dr, Birmingham, AL 35214
$-31
Cash flow
-0.7%
Cash-on-Cash Return
6.1%
Cap rate
0.7%
Rent to Value Ratio
Active
$589,900
3
bds
|
0
ba
|
2,811
sqft
|
built
2009
3012 Regent Park Cir, Birmingham, AL 35242
$-1,263
Cash flow
-11.2%
Cash-on-Cash Return
3.7%
Cap rate
0.5%
Rent to Value Ratio
Active
$349,900
3
bds
|
0
ba
|
1,512
sqft
|
built
1930
1138 14th Ave S, Birmingham, AL 35205
$-866
Cash flow
-12.9%
Cash-on-Cash Return
3.3%
Cap rate
0.4%
Rent to Value Ratio
Active under contract
$330,000
3
bds
|
0
ba
|
1,801
sqft
|
built
1998
6019 Mill Creek Dr, Birmingham, AL 35242
$-36
Cash flow
-0.6%
Cash-on-Cash Return
6.2%
Cap rate
0.8%
Rent to Value Ratio
Active
$259,000
2
bds
|
0
ba
|
1,285
sqft
|
built
1930
3410 17th Ave N, Birmingham, AL 35234
$-528
Cash flow
-10.6%
Cash-on-Cash Return
3.8%
Cap rate
0.5%
Rent to Value Ratio
Active under contract
$88,000
3
bds
|
0
ba
|
1,296
sqft
|
built
1954
7332 Sparta Ave, Birmingham, AL 35206
$436
Cash flow
25.8%
Cash-on-Cash Return
12.2%
Cap rate
1.5%
Rent to Value Ratio