Weber County Investment Properties for Sale
Browse homes for sale and investment properties in Weber County. Refine your search by price, property type, or more.
Best cash flowing properties in Weber County
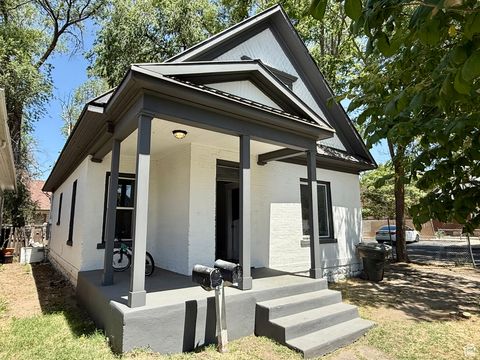
Active
$484,900
5
bds
|
2
ba
|
3,092
sqft
|
built
1912
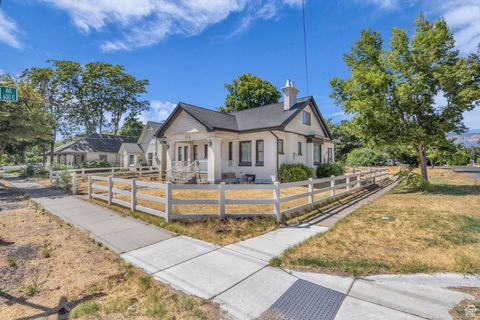
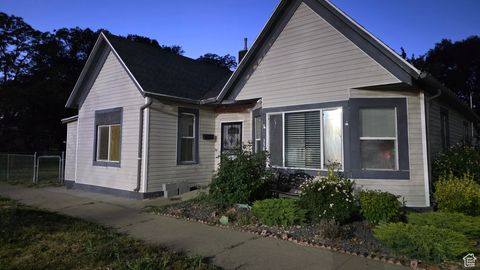
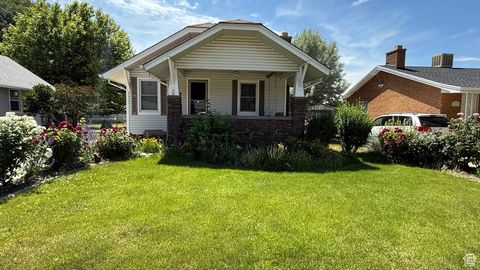
554 17th St, Ogden, UT 84404
$-394
Cash flow
-4.2%
Cash-on-Cash Return
4.7%
Cap rate
0.6%
Rent to Value Ratio
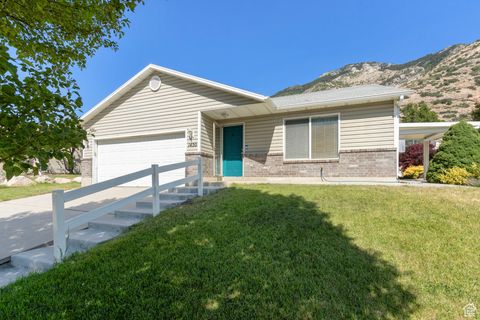
Active
$380,000
3
bds
|
2
ba
|
1,750
sqft
|
built
1959
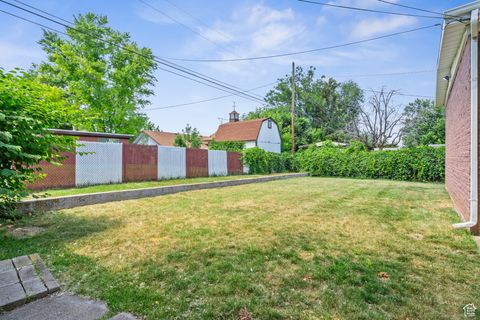
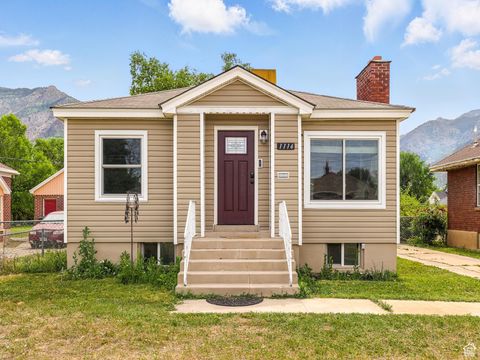
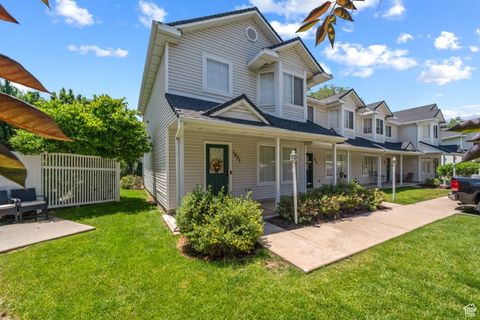
4303 Gramercy Ave, South Ogden, UT 84403
$-422
Cash flow
-5.8%
Cash-on-Cash Return
4.3%
Cap rate
0.6%
Rent to Value Ratio
589 out of 722 properties for sale in Weber County
Limited Results Shown
Create a free account, or log in to reveal all property listings and enjoy the complete experience.
Active
$359,900
3
bds
|
1
ba
|
1,175
sqft
|
built
1950
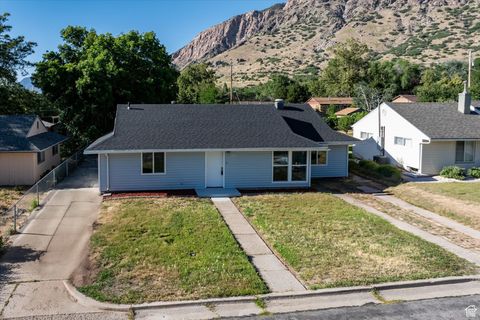
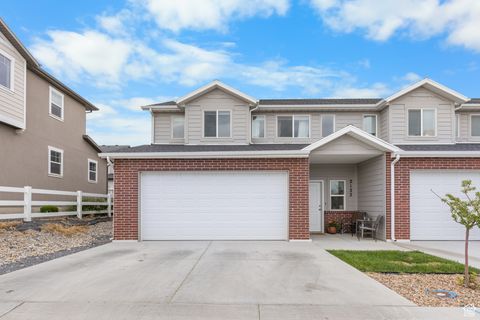
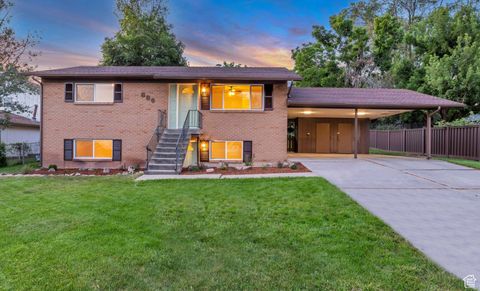
1302 Harrop St, Ogden, UT 84404
$-654
Cash flow
-9.5%
Cash-on-Cash Return
3.5%
Cap rate
0.5%
Rent to Value Ratio
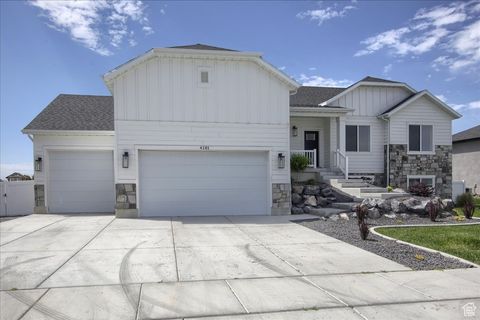
Active
$460,000
4
bds
|
2
ba
|
2,140
sqft
|
built
1988
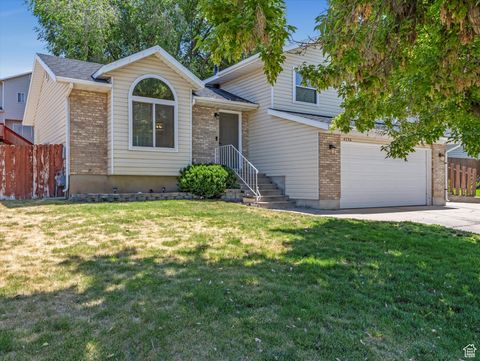
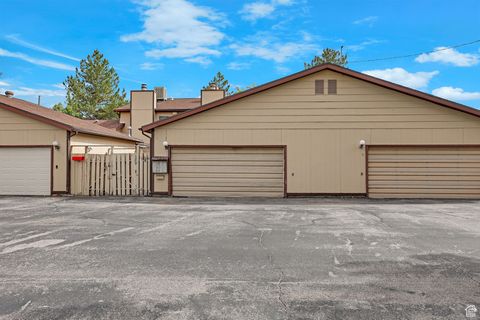
4736 S 2675 W, Roy, UT 84067
$-673
Cash flow
-7.6%
Cash-on-Cash Return
3.9%
Cap rate
0.5%
Rent to Value Ratio
Active
$515,000
4
bds
|
2
ba
|
2,002
sqft
|
built
1974
390 W 5050 S, Washington Terrace, UT 84405
$-1,054
Cash flow
-10.7%
Cash-on-Cash Return
3.2%
Cap rate
0.4%
Rent to Value Ratio
Active
$755,900
5
bds
|
3
ba
|
3,756
sqft
|
built
2018
649 E 5650 S, Washington Terrace, UT 84405
$-1,378
Cash flow
-9.5%
Cash-on-Cash Return
3.5%
Cap rate
0.5%
Rent to Value Ratio
Active
$875,000
5
bds
|
3
ba
|
3,560
sqft
|
built
2005
2989 W 2600 S, West Haven, UT 84401
$-1,823
Cash flow
-10.9%
Cash-on-Cash Return
3.2%
Cap rate
0.4%
Rent to Value Ratio
Active
$419,999
3
bds
|
2
ba
|
1,596
sqft
|
built
1997
5318 S 4300 W, Hooper, UT 84315
$-666
Cash flow
-8.3%
Cash-on-Cash Return
3.8%
Cap rate
0.5%
Rent to Value Ratio
Active
$795,000
4
bds
|
3
ba
|
3,049
sqft
|
built
1999
3139 N Pelican Dr, Farr West, UT 84404
$-2,541
Cash flow
-16.7%
Cash-on-Cash Return
1.8%
Cap rate
0.3%
Rent to Value Ratio
Active
$739,900
6
bds
|
3
ba
|
2,961
sqft
|
built
2020
3140 S Straight St, West Haven, UT 84401
$-2,190
Cash flow
-15.4%
Cash-on-Cash Return
2.1%
Cap rate
0.3%
Rent to Value Ratio
Active
$680,000
4
bds
|
3
ba
|
2,922
sqft
|
built
1995
1075 E 2600 N, North Ogden, UT 84414
$-2,008
Cash flow
-15.4%
Cash-on-Cash Return
2.1%
Cap rate
0.3%
Rent to Value Ratio
Active
$318,500
3
bds
|
3
ba
|
1,440
sqft
|
built
2008
419 E 475 N, Ogden, UT 84404
$-615
Cash flow
-10.1%
Cash-on-Cash Return
3.4%
Cap rate
0.6%
Rent to Value Ratio
Active
$360,000
3
bds
|
2
ba
|
1,517
sqft
|
built
1907
358 11th St, Ogden, UT 84404
$-505
Cash flow
-7.3%
Cash-on-Cash Return
4.0%
Cap rate
0.6%
Rent to Value Ratio
Active
$434,900
4
bds
|
2
ba
|
2,002
sqft
|
built
1946
1116 Liberty Ave, Ogden, UT 84404
$-745
Cash flow
-8.9%
Cash-on-Cash Return
3.6%
Cap rate
0.5%
Rent to Value Ratio
Active
$394,900
3
bds
|
3
ba
|
1,800
sqft
|
built
2020
2122 W 1745 Ct S, West Haven, UT 84401
$-809
Cash flow
-10.7%
Cash-on-Cash Return
3.2%
Cap rate
0.5%
Rent to Value Ratio
Active
$299,000
3
bds
|
3
ba
|
1,800
sqft
|
built
1977
597 Brookshire Dr, Riverdale, UT 84405
$-719
Cash flow
-12.5%
Cash-on-Cash Return
2.8%
Cap rate
0.6%
Rent to Value Ratio
Active
$364,897
3
bds
|
3
ba
|
2,414
sqft
|
built
1968
1184 16th St, Ogden, UT 84404
$-1,087
Cash flow
-15.5%
Cash-on-Cash Return
2.1%
Cap rate
0.5%
Rent to Value Ratio
Active
$640,000
5
bds
|
3
ba
|
3,043
sqft
|
built
1987
5791 Oakwood Dr, South Ogden, UT 84405
$-1,130
Cash flow
-9.2%
Cash-on-Cash Return
3.6%
Cap rate
0.5%
Rent to Value Ratio
Active
$470,000
5
bds
|
2
ba
|
2,840
sqft
|
built
1946
3071 Quincy Ave, Ogden, UT 84403
$-681
Cash flow
-7.6%
Cash-on-Cash Return
3.9%
Cap rate
0.6%
Rent to Value Ratio
Active
$950,000
5
bds
|
4
ba
|
4,515
sqft
|
built
1993
1880 Shadow Valley Dr, Ogden, UT 84403
$-2,795
Cash flow
-15.4%
Cash-on-Cash Return
2.1%
Cap rate
0.3%
Rent to Value Ratio
Active
$433,000
4
bds
|
2
ba
|
2,086
sqft
|
built
1939
2327 Custer Ave, Ogden, UT 84401
$-903
Cash flow
-10.9%
Cash-on-Cash Return
3.2%
Cap rate
0.5%
Rent to Value Ratio
Active
$1,200,000
3
bds
|
2
ba
|
2,268
sqft
|
built
1984
409 N 9000 E, Huntsville, UT 84317
$-3,637
Cash flow
-15.8%
Cash-on-Cash Return
2.0%
Cap rate
0.3%
Rent to Value Ratio
Active
$419,900
4
bds
|
2
ba
|
1,900
sqft
|
built
1964
2326 W 4400 S, Roy, UT 84067
$-462
Cash flow
-5.7%
Cash-on-Cash Return
4.4%
Cap rate
0.6%
Rent to Value Ratio
Active
$425,000
5
bds
|
2
ba
|
1,718
sqft
|
built
1951
1284 E 22nd St, Ogden, UT 84401
$-873
Cash flow
-10.7%
Cash-on-Cash Return
3.2%
Cap rate
0.5%
Rent to Value Ratio
Active
$1,275,000
6
bds
|
6
ba
|
5,995
sqft
|
built
2023
481 E 3675 N, North Ogden, UT 84414
$-2,136
Cash flow
-8.7%
Cash-on-Cash Return
3.7%
Cap rate
0.5%
Rent to Value Ratio
Active
$499,900
3
bds
|
3
ba
|
3,976
sqft
|
built
1951
2342 Van Buren Ave, Ogden, UT 84401
$-1,254
Cash flow
-13.1%
Cash-on-Cash Return
2.7%
Cap rate
0.4%
Rent to Value Ratio
Active
$500,000
4
bds
|
2
ba
|
1,583
sqft
|
built
1945
848 Wood St, Ogden, UT 84404
$-1,274
Cash flow
-13.3%
Cash-on-Cash Return
2.6%
Cap rate
0.4%
Rent to Value Ratio
Active
$405,000
3
bds
|
2
ba
|
1,000
sqft
|
built
1945
575 40th St, South Ogden, UT 84403
$-1,101
Cash flow
-14.2%
Cash-on-Cash Return
2.4%
Cap rate
0.3%
Rent to Value Ratio
Active
$410,000
4
bds
|
2
ba
|
2,220
sqft
|
built
1960
720 E 850 N, Ogden, UT 84404
$-771
Cash flow
-9.8%
Cash-on-Cash Return
3.4%
Cap rate
0.5%
Rent to Value Ratio
Active
$400,000
3
bds
|
2
ba
|
2,194
sqft
|
built
1929
1137 Liberty Ave, Ogden, UT 84404
$-978
Cash flow
-12.8%
Cash-on-Cash Return
2.7%
Cap rate
0.4%
Rent to Value Ratio
Active
$294,000
2
bds
|
2
ba
|
1,214
sqft
|
built
2000
1021 Sara Ln, Ogden, UT 84404
$-747
Cash flow
-13.3%
Cash-on-Cash Return
2.6%
Cap rate
0.5%
Rent to Value Ratio
Active
$579,999
3
bds
|
2
ba
|
2,000
sqft
|
built
1971
684 E 2700 N, North Ogden, UT 84414
$-1,703
Cash flow
-15.3%
Cash-on-Cash Return
2.2%
Cap rate
0.3%
Rent to Value Ratio
Active
$409,000
4
bds
|
2
ba
|
1,897
sqft
|
built
1907
660 23rd St, Ogden, UT 84401
$-1,025
Cash flow
-13.1%
Cash-on-Cash Return
2.7%
Cap rate
0.4%
Rent to Value Ratio
Active
$415,000
2
bds
|
2
ba
|
1,280
sqft
|
built
2002
1450 Black Mountain Dr, Ogden, UT 84404
$-977
Cash flow
-12.3%
Cash-on-Cash Return
2.9%
Cap rate
0.4%
Rent to Value Ratio

Active
$569,900
3
bds
|
2
ba
|
3,156
sqft
|
built
1946
810 Canyon Rd, Ogden, UT 84404
$-1,376
Cash flow
-12.6%
Cash-on-Cash Return
2.8%
Cap rate
0.4%
Rent to Value Ratio
Active
$1,499,999
3
bds
|
3
ba
|
1,845
sqft
|
built
1999
5335 W 5500 S, Hooper, UT 84315
$-5,720
Cash flow
-19.9%
Cash-on-Cash Return
1.1%
Cap rate
0.2%
Rent to Value Ratio
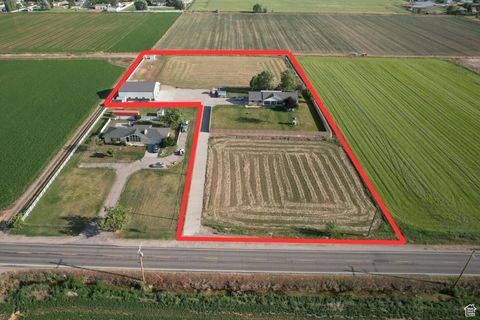
Active
$750,000
6
bds
|
3
ba
|
3,408
sqft
|
built
2021
4181 W 1725 S, West Haven, UT 84401
$-2,479
Cash flow
-17.2%
Cash-on-Cash Return
1.7%
Cap rate
0.3%
Rent to Value Ratio
Active
$275,000
1
bds
|
1
ba
|
643
sqft
|
built
1914
841 20th St, Ogden, UT 84401
$-441
Cash flow
-8.4%
Cash-on-Cash Return
3.8%
Cap rate
0.5%
Rent to Value Ratio
Active
$647,500
5
bds
|
4
ba
|
3,383
sqft
|
built
2007
4317 S 3350 W, West Haven, UT 84401
$-1,375
Cash flow
-11.1%
Cash-on-Cash Return
3.1%
Cap rate
0.4%
Rent to Value Ratio
Active
$495,000
4
bds
|
4
ba
|
2,454
sqft
|
built
2008
2536 S Andover St, West Haven, UT 84401
$-885
Cash flow
-9.3%
Cash-on-Cash Return
3.5%
Cap rate
0.5%
Rent to Value Ratio