Broward County Investment Properties for Sale
Browse homes for sale and investment properties in Broward County. Refine your search by price, property type, or more.
Best cash flowing properties in Broward County
Active
$269,999
2
bds
|
2
ba
|
1,241
sqft
|
built
1991
2647 NW 33rd St, Oakland Park, FL 33309
$-532
Cash flow
-10.3%
Cash-on-Cash Return
3.8%
Cap rate
0.9%
Rent to Value Ratio
Active
$389,900
2
bds
|
3
ba
|
1,600
sqft
|
built
1974
9074 NW 35th Pl, Sunrise, FL 33351
$-563
Cash flow
-7.5%
Cash-on-Cash Return
4.4%
Cap rate
0.6%
Rent to Value Ratio
8,575 out of 10,004 properties for sale in Broward County
Limited Results Shown
Create a free account, or log in to reveal all property listings and enjoy the complete experience.
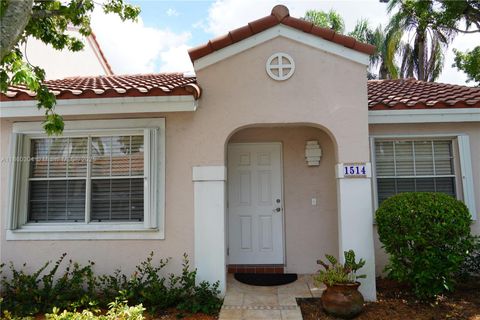
Active
$425,000
2
bds
|
2
ba
|
893
sqft
|
built
1987
1514 Springside Dr, Weston, FL 33326
$-1,071
Cash flow
-13.1%
Cash-on-Cash Return
3.1%
Cap rate
0.6%
Rent to Value Ratio
Active
$330,000
2
bds
|
2
ba
|
912
sqft
|
built
1972
3050 NE 16th Ave, Oakland Park, FL 33334
$-1,501
Cash flow
-23.7%
Cash-on-Cash Return
0.7%
Cap rate
0.7%
Rent to Value Ratio
Active
$785,000
4
bds
|
3
ba
|
2,392
sqft
|
built
1996
18840 NW 23rd Pl, Pembroke Pines, FL 33029
$-1,619
Cash flow
-10.8%
Cash-on-Cash Return
3.7%
Cap rate
0.6%
Rent to Value Ratio
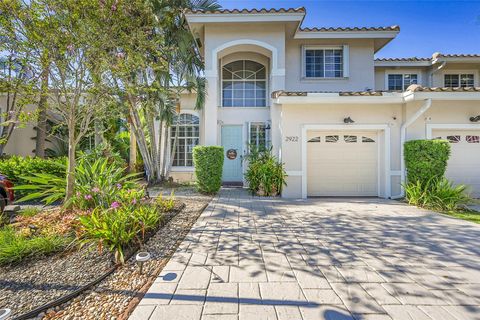
Active
$725,000
3
bds
|
3
ba
|
1,955
sqft
|
built
1992
2922 Port Royale Ln S, Fort Lauderdale, FL 33308
$-1,821
Cash flow
-13.1%
Cash-on-Cash Return
3.1%
Cap rate
0.5%
Rent to Value Ratio

Active
$878,900
4
bds
|
2
ba
|
2,855
sqft
|
built
1992
10665 NW 49th Pl, Coral Springs, FL 33076
$-1,976
Cash flow
-11.7%
Cash-on-Cash Return
3.4%
Cap rate
0.6%
Rent to Value Ratio
Active
$920,000
4
bds
|
2
ba
|
2,172
sqft
|
built
1998
4310 Diamond Way, Weston, FL 33331
$-2,594
Cash flow
-14.7%
Cash-on-Cash Return
2.8%
Cap rate
0.5%
Rent to Value Ratio
Active
$2,999,900
3
bds
|
3
ba
|
2,588
sqft
|
built
1998
3200 N Ocean Blvd, Fort Lauderdale, FL 33308
$-15,302
Cash flow
-26.6%
Cash-on-Cash Return
0.0%
Cap rate
0.3%
Rent to Value Ratio
Active
$324,999
2
bds
|
3
ba
|
1,235
sqft
|
built
1980
16475 Golf Club Rd, Weston, FL 33326
$-1,020
Cash flow
-16.4%
Cash-on-Cash Return
2.4%
Cap rate
0.8%
Rent to Value Ratio
Active
$629,900
3
bds
|
2
ba
|
1,663
sqft
|
built
1979
9338 NW 47th St, Sunrise, FL 33351
$-1,346
Cash flow
-11.1%
Cash-on-Cash Return
3.6%
Cap rate
0.7%
Rent to Value Ratio
Active
$495,000
5
bds
|
3
ba
|
2,180
sqft
|
built
1961
4900 NW 15th St, Lauderhill, FL 33313
$-1,104
Cash flow
-11.6%
Cash-on-Cash Return
3.5%
Cap rate
0.6%
Rent to Value Ratio
Active
$1,175,000
4
bds
|
4
ba
|
2,326
sqft
|
built
1973
1670 SW 139th Ave, Davie, FL 33325
$-3,756
Cash flow
-16.7%
Cash-on-Cash Return
2.3%
Cap rate
0.4%
Rent to Value Ratio
Active
$1,395,000
3
bds
|
2
ba
|
2,281
sqft
|
built
2013
717 NE 22nd Dr, Wilton Manors, FL 33305
$-4,485
Cash flow
-16.8%
Cash-on-Cash Return
2.3%
Cap rate
0.4%
Rent to Value Ratio
Active
$2,499,000
3
bds
|
5
ba
|
3,910
sqft
|
built
2001
209 N Birch Rd, Fort Lauderdale, FL 33304
$-12,454
Cash flow
-26.0%
Cash-on-Cash Return
0.2%
Cap rate
0.4%
Rent to Value Ratio
Active
$548,000
2
bds
|
2
ba
|
1,499
sqft
|
built
1977
1370 S Ocean Blvd, Pompano Beach, FL 33062
$-2,917
Cash flow
-27.8%
Cash-on-Cash Return
-0.2%
Cap rate
0.6%
Rent to Value Ratio
Active
$310,000
2
bds
|
2
ba
|
787
sqft
|
built
1984
9317 NW 1st Ct, Pembroke Pines, FL 33024
$-887
Cash flow
-14.9%
Cash-on-Cash Return
2.7%
Cap rate
0.7%
Rent to Value Ratio
Active
$2,690,000
5
bds
|
5
ba
|
4,006
sqft
|
built
1998
2514 Poinciana Dr, Weston, FL 33327
$-9,416
Cash flow
-18.3%
Cash-on-Cash Return
1.9%
Cap rate
0.4%
Rent to Value Ratio
Active
$480,000
3
bds
|
3
ba
|
1,479
sqft
|
built
1991
3720 Piedmont St, Hollywood, FL 33021
$-1,033
Cash flow
-11.2%
Cash-on-Cash Return
3.6%
Cap rate
0.8%
Rent to Value Ratio
Active
$639,999
3
bds
|
2
ba
|
1,624
sqft
|
built
1980
2707 S Parkview Dr, Hallandale Beach, FL 33009
$-2,003
Cash flow
-16.3%
Cash-on-Cash Return
2.4%
Cap rate
0.6%
Rent to Value Ratio
Active
$700,000
4
bds
|
3
ba
|
2,452
sqft
|
built
1973
621 NW 97th Ter, Pembroke Pines, FL 33024
$-1,733
Cash flow
-12.9%
Cash-on-Cash Return
3.2%
Cap rate
0.6%
Rent to Value Ratio
Active
$550,000
4
bds
|
4
ba
|
1,455
sqft
|
built
1960
2010 NE 1st Ave, Pompano Beach, FL 33060
$-1,433
Cash flow
-13.6%
Cash-on-Cash Return
3.0%
Cap rate
0.6%
Rent to Value Ratio
Active
$630,000
3
bds
|
2
ba
|
1,989
sqft
|
built
1990
9701 Millpond Rd, Miramar, FL 33025
$-1,141
Cash flow
-9.4%
Cash-on-Cash Return
4.0%
Cap rate
0.6%
Rent to Value Ratio
Active
$500,000
4
bds
|
3
ba
|
0
sqft
|
built
1977
4018 Del Rio Way, Sunrise, FL 33351
$-1,178
Cash flow
-12.3%
Cash-on-Cash Return
3.3%
Cap rate
0.6%
Rent to Value Ratio
Active
$618,000
3
bds
|
4
ba
|
2,078
sqft
|
built
2018
11660 SW 13th Ct, Pembroke Pines, FL 33025
$-1,685
Cash flow
-14.2%
Cash-on-Cash Return
2.9%
Cap rate
0.6%
Rent to Value Ratio
Active
$540,000
2
bds
|
2
ba
|
875
sqft
|
built
1953
1324 NW 1st Ave, Fort Lauderdale, FL 33311
$-1,036
Cash flow
-10.0%
Cash-on-Cash Return
3.8%
Cap rate
0.6%
Rent to Value Ratio
Active
$4,500,000
5
bds
|
4
ba
|
3,718
sqft
|
built
1973
624 Palm Dr, Hallandale Beach, FL 33009
$-17,155
Cash flow
-19.9%
Cash-on-Cash Return
1.6%
Cap rate
0.2%
Rent to Value Ratio
Active
$695,000
3
bds
|
3
ba
|
1,264
sqft
|
built
1955
2626 Thomas St, Hollywood, FL 33020
$-3,097
Cash flow
-23.2%
Cash-on-Cash Return
0.8%
Cap rate
0.1%
Rent to Value Ratio
Active
$275,000
2
bds
|
2
ba
|
1,072
sqft
|
built
1975
8007 Lagos De Campo Blvd, Tamarac, FL 33321
$-931
Cash flow
-17.7%
Cash-on-Cash Return
2.1%
Cap rate
0.8%
Rent to Value Ratio
Active
$560,000
2
bds
|
2
ba
|
1,400
sqft
|
built
1970
3100 NE 49th St, Fort Lauderdale, FL 33308
$-2,386
Cash flow
-22.2%
Cash-on-Cash Return
1.0%
Cap rate
0.6%
Rent to Value Ratio
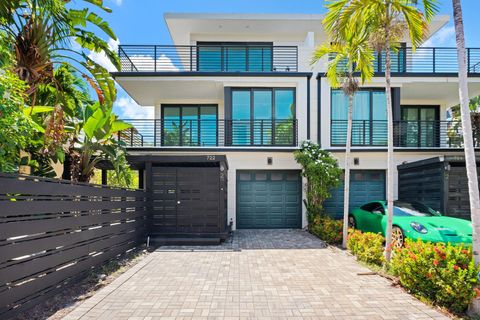
Active
$950,000
4
bds
|
4
ba
|
1,815
sqft
|
built
2019
722 NE 15th Ave, Fort Lauderdale, FL 33304
$-2,285
Cash flow
-12.5%
Cash-on-Cash Return
3.3%
Cap rate
0.6%
Rent to Value Ratio
Active
$575,000
3
bds
|
3
ba
|
2,074
sqft
|
built
1993
7697 NW 25th St, Margate, FL 33063
$-913
Cash flow
-8.3%
Cash-on-Cash Return
4.2%
Cap rate
0.6%
Rent to Value Ratio
Active
$700,000
3
bds
|
3
ba
|
1,830
sqft
|
built
2019
4317 Lago Dr, Deerfield Beach, FL 33064
$-2,126
Cash flow
-15.8%
Cash-on-Cash Return
2.5%
Cap rate
0.5%
Rent to Value Ratio
Active
$340,000
2
bds
|
2
ba
|
1,080
sqft
|
built
2003
2470 Centergate Dr, Miramar, FL 33025
$-944
Cash flow
-14.5%
Cash-on-Cash Return
2.8%
Cap rate
0.7%
Rent to Value Ratio
Active
$740,000
3
bds
|
3
ba
|
1,780
sqft
|
built
1971
1950 S Ocean Dr, Hallandale Beach, FL 33009
$-3,355
Cash flow
-23.7%
Cash-on-Cash Return
0.7%
Cap rate
0.6%
Rent to Value Ratio
Active
$750,000
4
bds
|
3
ba
|
1,582
sqft
|
built
1962
2221 N 43rd Ave, Hollywood, FL 33021
$-1,807
Cash flow
-12.6%
Cash-on-Cash Return
3.3%
Cap rate
0.5%
Rent to Value Ratio
Active
$739,999
4
bds
|
3
ba
|
2,765
sqft
|
built
1988
3950 NW 73rd Ave, Lauderhill, FL 33319
$-2,364
Cash flow
-16.7%
Cash-on-Cash Return
2.3%
Cap rate
0.5%
Rent to Value Ratio
Active
$659,000
1
bds
|
2
ba
|
1,008
sqft
|
built
1952
1402 Fletcher St, Hollywood, FL 33020
$-1,777
Cash flow
-14.1%
Cash-on-Cash Return
2.9%
Cap rate
0.5%
Rent to Value Ratio
Active
$1,029,000
4
bds
|
3
ba
|
1,862
sqft
|
built
1954
2442 Bimini Ln, Fort Lauderdale, FL 33312
$-1,858
Cash flow
-9.4%
Cash-on-Cash Return
4.0%
Cap rate
0.7%
Rent to Value Ratio
Active
$520,000
4
bds
|
2
ba
|
1,504
sqft
|
built
1977
11360 NW 31st St, Sunrise, FL 33323
$-822
Cash flow
-8.2%
Cash-on-Cash Return
4.3%
Cap rate
0.7%
Rent to Value Ratio