Broward County Investment Properties for Sale
Browse homes for sale and investment properties in Broward County. Refine your search by price, property type, or more.
Best cash flowing properties in Broward County
Active
$140,000
2
bds
|
2
ba
|
1,560
sqft
|
built
1971
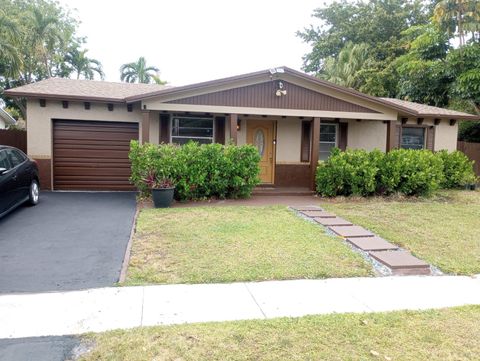
3301 Spanish Moss Ter, Lauderhill, FL 33319
$-171
Cash flow
-6.4%
Cash-on-Cash Return
4.7%
Cap rate
1.6%
Rent to Value Ratio
Active
$465,000
3
bds
|
2
ba
|
1,299
sqft
|
built
1975
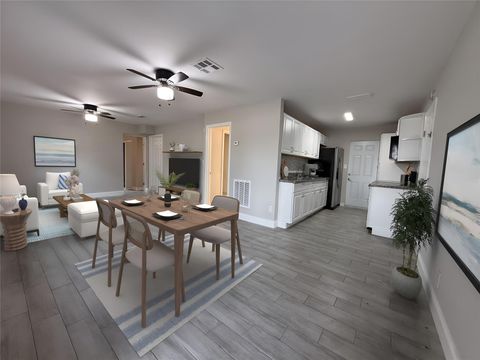
8241 SW 4th Ct, North Lauderdale, FL 33068
$-422
Cash flow
-4.7%
Cash-on-Cash Return
5.1%
Cap rate
0.7%
Rent to Value Ratio
7,898 out of 9,234 properties for sale in Broward County
Limited Results Shown
Create a free account, or log in to reveal all property listings and enjoy the complete experience.
Active
$420,000
2
bds
|
3
ba
|
1,226
sqft
|
built
1995
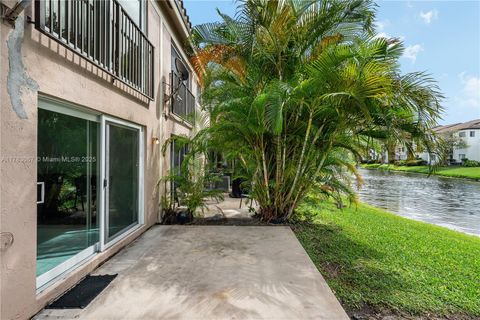
2412 NW 97th Way, Pembroke Pines, FL 33024
$-727
Cash flow
-9.0%
Cash-on-Cash Return
4.1%
Cap rate
0.7%
Rent to Value Ratio
Active
$389,500
2
bds
|
2
ba
|
822
sqft
|
built
1955
2561 NE 12th Ave, Pompano Beach, FL 33064
$-781
Cash flow
-10.5%
Cash-on-Cash Return
3.7%
Cap rate
0.6%
Rent to Value Ratio

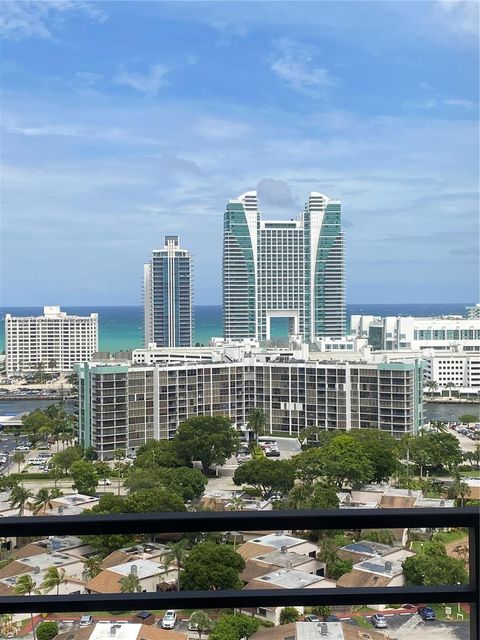
Active
$320,000
2
bds
|
2
ba
|
1,092
sqft
|
built
1971
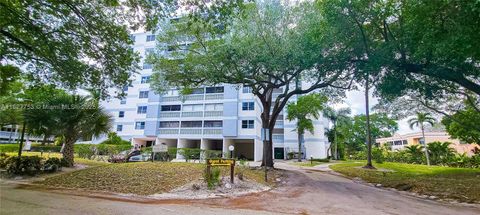
3161 S Ocean Dr, Hallandale Beach, FL 33009
$-632
Cash flow
-10.3%
Cash-on-Cash Return
3.8%
Cap rate
0.9%
Rent to Value Ratio
Active
$265,000
2
bds
|
2
ba
|
1,180
sqft
|
built
1981
3300 W Rolling Hills Cir, Davie, FL 33328
$-966
Cash flow
-19.0%
Cash-on-Cash Return
1.8%
Cap rate
0.9%
Rent to Value Ratio
Active
$889,000
6
bds
|
4
ba
|
3,200
sqft
|
built
1972
1480 SW 66th Ter, Plantation, FL 33317
$-2,383
Cash flow
-14.0%
Cash-on-Cash Return
2.9%
Cap rate
0.4%
Rent to Value Ratio
Active
$1,499,000
4
bds
|
3
ba
|
2,716
sqft
|
built
2000
1807 Victoria Pointe Cir, Weston, FL 33327
$-2,584
Cash flow
-9.0%
Cash-on-Cash Return
4.1%
Cap rate
0.6%
Rent to Value Ratio
Active
$299,000
1
bds
|
1
ba
|
430
sqft
|
built
1967
120 NE 20th Ave, Deerfield Beach, FL 33441
$-944
Cash flow
-16.5%
Cash-on-Cash Return
2.4%
Cap rate
0.8%
Rent to Value Ratio
Active
$515,000
2
bds
|
2
ba
|
1,208
sqft
|
built
2005
110 N Federal Hwy, Fort Lauderdale, FL 33301
$-2,237
Cash flow
-22.7%
Cash-on-Cash Return
0.9%
Cap rate
0.6%
Rent to Value Ratio
Active
$249,900
2
bds
|
2
ba
|
945
sqft
|
built
1980
1913 S Ocean Dr, Hallandale Beach, FL 33009
$-765
Cash flow
-16.0%
Cash-on-Cash Return
2.5%
Cap rate
1.0%
Rent to Value Ratio
Active
$1,399,000
3
bds
|
3
ba
|
1,990
sqft
|
built
2001
100 S Birch Rd, Fort Lauderdale, FL 33316
$-6,567
Cash flow
-24.5%
Cash-on-Cash Return
0.5%
Cap rate
0.5%
Rent to Value Ratio
Active
$2,049,500
3
bds
|
2
ba
|
2,117
sqft
|
built
1955
2200 SE 8th St, Pompano Beach, FL 33062
$-6,374
Cash flow
-16.2%
Cash-on-Cash Return
2.4%
Cap rate
0.3%
Rent to Value Ratio
Active
$295,000
1
bds
|
2
ba
|
950
sqft
|
built
1980
2500 Parkview Dr, Hallandale Beach, FL 33009
$-1,374
Cash flow
-24.3%
Cash-on-Cash Return
0.6%
Cap rate
0.7%
Rent to Value Ratio
Active
$290,000
2
bds
|
2
ba
|
1,080
sqft
|
built
1982
8632 NW 34th Pl, Sunrise, FL 33351
$-709
Cash flow
-12.8%
Cash-on-Cash Return
3.2%
Cap rate
0.8%
Rent to Value Ratio
Active
$2,450,000
3
bds
|
3
ba
|
1,944
sqft
|
built
1955
2008 Admirals Way, Fort Lauderdale, FL 33316
$-7,361
Cash flow
-15.7%
Cash-on-Cash Return
2.5%
Cap rate
0.5%
Rent to Value Ratio
Active
$414,900
3
bds
|
2
ba
|
1,195
sqft
|
built
1959
1644 NE 30th St, Pompano Beach, FL 33064
$-751
Cash flow
-9.4%
Cash-on-Cash Return
4.0%
Cap rate
0.7%
Rent to Value Ratio
Active
$885,000
5
bds
|
4
ba
|
2,414
sqft
|
built
1988
1780 SW 51st Ter, Plantation, FL 33317
$-1,485
Cash flow
-8.8%
Cash-on-Cash Return
4.1%
Cap rate
0.6%
Rent to Value Ratio
Active
$369,000
2
bds
|
1
ba
|
1,062
sqft
|
built
1969
4918 NW 56th Ct, Tamarac, FL 33319
$-1,050
Cash flow
-14.8%
Cash-on-Cash Return
2.7%
Cap rate
0.5%
Rent to Value Ratio
Active
$535,000
3
bds
|
2
ba
|
1,422
sqft
|
built
1976
11461 NW 31st Pl, Sunrise, FL 33323
$-512
Cash flow
-5.0%
Cash-on-Cash Return
5.0%
Cap rate
0.7%
Rent to Value Ratio
Active
$1,300,000
3
bds
|
2
ba
|
2,000
sqft
|
built
1950
1900 NE 16th Ter, Fort Lauderdale, FL 33305
$-3,850
Cash flow
-15.5%
Cash-on-Cash Return
2.6%
Cap rate
0.5%
Rent to Value Ratio
Active
$1,749,000
3
bds
|
3
ba
|
2,308
sqft
|
built
2005
3101 S Ocean Dr, Hollywood, FL 33019
$-8,025
Cash flow
-23.9%
Cash-on-Cash Return
0.6%
Cap rate
0.5%
Rent to Value Ratio
Active
$349,000
1
bds
|
1
ba
|
850
sqft
|
built
1967
4250 Galt Ocean Dr, Fort Lauderdale, FL 33308
$-1,437
Cash flow
-21.5%
Cash-on-Cash Return
1.2%
Cap rate
0.7%
Rent to Value Ratio
Active
$199,900
2
bds
|
2
ba
|
775
sqft
|
built
1974
9421 Evergreen Pl, Davie, FL 33324
$-489
Cash flow
-12.8%
Cash-on-Cash Return
3.2%
Cap rate
1.0%
Rent to Value Ratio
Active
$275,000
3
bds
|
3
ba
|
1,710
sqft
|
built
1981
3520 Oaks Way, Pompano Beach, FL 33069
$-1,009
Cash flow
-19.1%
Cash-on-Cash Return
1.7%
Cap rate
1.0%
Rent to Value Ratio
Active
$1,390,000
4
bds
|
4
ba
|
4,500
sqft
|
built
1976
5200 Woodlands Blvd, Tamarac, FL 33319
$-4,488
Cash flow
-16.8%
Cash-on-Cash Return
2.3%
Cap rate
0.4%
Rent to Value Ratio
Active
$1,275,000
5
bds
|
4
ba
|
3,115
sqft
|
built
1955
2500 NE 19th St, Pompano Beach, FL 33062
$-4,342
Cash flow
-17.8%
Cash-on-Cash Return
2.1%
Cap rate
0.4%
Rent to Value Ratio
Active
$1,495,000
4
bds
|
3
ba
|
2,795
sqft
|
built
1961
2272 NE 31st St, Lighthouse Point, FL 33064
$-4,747
Cash flow
-16.6%
Cash-on-Cash Return
2.3%
Cap rate
0.4%
Rent to Value Ratio
Active
$715,000
2
bds
|
1
ba
|
1,086
sqft
|
built
2005
1850 S Ocean Dr, Hallandale Beach, FL 33009
$-2,902
Cash flow
-21.2%
Cash-on-Cash Return
1.3%
Cap rate
0.6%
Rent to Value Ratio
Active
$477,000
4
bds
|
2
ba
|
1,434
sqft
|
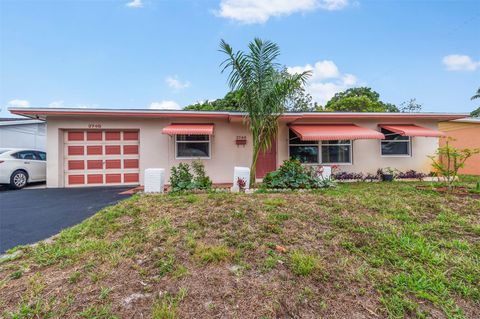
built
1964
2748 NW 35th Ter, Lauderdale Lakes, FL 33311
$-613
Cash flow
-6.7%
Cash-on-Cash Return
4.6%
Cap rate
0.6%
Rent to Value Ratio
Active
$1,350,000
4
bds
|
4
ba
|
3,531
sqft
|
built
1985
5355 NW 77th Ter, Coral Springs, FL 33067
$-4,805
Cash flow
-18.6%
Cash-on-Cash Return
1.9%
Cap rate
0.4%
Rent to Value Ratio
Active
$759,900
5
bds
|
3
ba
|
2,674
sqft
|
built
1999
3500 SW 144th Ave, Miramar, FL 33027
$-931
Cash flow
-6.4%
Cash-on-Cash Return
4.7%
Cap rate
0.8%
Rent to Value Ratio
Active
$415,000
3
bds
|
2
ba
|
1,258
sqft
|
built
1969
3330 SW 59th Ter, West Park, FL 33023
$-1,299
Cash flow
-16.3%
Cash-on-Cash Return
2.4%
Cap rate
0.6%
Rent to Value Ratio
Active
$1,045,000
3
bds
|
3
ba
|
2,000
sqft
|
built
1996
537 NE 17th Way, Fort Lauderdale, FL 33301
$-2,929
Cash flow
-14.6%
Cash-on-Cash Return
2.8%
Cap rate
0.5%
Rent to Value Ratio
Active
$970,000
5
bds
|
3
ba
|
2,071
sqft
|
built
1966
2001 NE 62nd St, Fort Lauderdale, FL 33308
$-2,475
Cash flow
-13.3%
Cash-on-Cash Return
3.1%
Cap rate
0.6%
Rent to Value Ratio
Active
$3,100,000
2
bds
|
3
ba
|
2,247
sqft
|
built
2007
1 N Fort Lauderdale Beach Blvd, Fort Lauderdale, FL 33304
$-15,775
Cash flow
-26.5%
Cash-on-Cash Return
0.0%
Cap rate
0.3%
Rent to Value Ratio
Active
$999,900
4
bds
|
3
ba
|
2,624
sqft
|
built
1982
14755 SW 18th Ct, Davie, FL 33325
$-2,179
Cash flow
-11.4%
Cash-on-Cash Return
3.5%
Cap rate
0.5%
Rent to Value Ratio
Active
$845,000
3
bds
|
3
ba
|
2,047
sqft
|
built
2023
4506 SW 174th Ave, Miramar, FL 33029
$-2,267
Cash flow
-14.0%
Cash-on-Cash Return
2.9%
Cap rate
0.7%
Rent to Value Ratio
Active
$674,900
2
bds
|
2
ba
|
1,675
sqft
|
built
1969
2800 E Sunrise Blvd, Fort Lauderdale, FL 33304
$-3,642
Cash flow
-28.2%
Cash-on-Cash Return
-0.3%
Cap rate
0.5%
Rent to Value Ratio
Active
$6,250,000
4
bds
|
4
ba
|
3,938
sqft
|
built
2005
1525 N Fort Lauderdale Beach Blvd, Fort Lauderdale, FL 33304
$-34,235
Cash flow
-28.6%
Cash-on-Cash Return
-0.4%
Cap rate
0.1%
Rent to Value Ratio