Broward County Investment Properties for Sale
Browse homes for sale and investment properties in Broward County. Refine your search by price, property type, or more.
Best cash flowing properties in Broward County
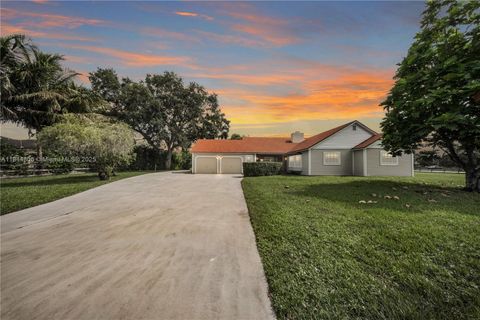
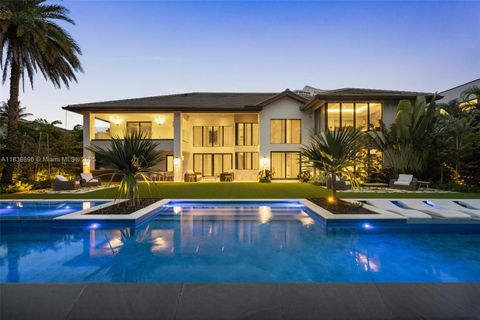
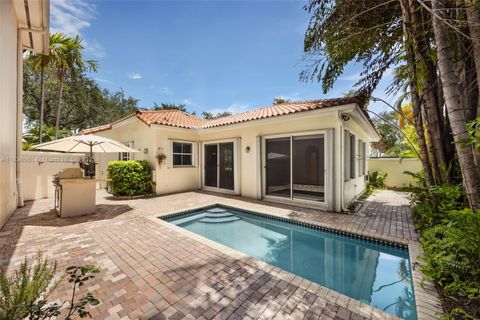
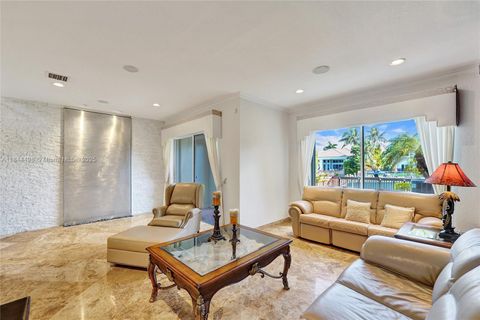
Active
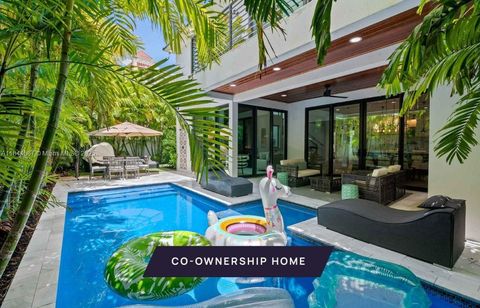
$430,000
4
bds
|
4
ba
|
3,039
sqft
|
built
2020
3400 NE 25th St, Fort Lauderdale, FL 33305
$3,720
Cash flow
45.1%
Cash-on-Cash Return
16.5%
Cap rate
2.3%
Rent to Value Ratio
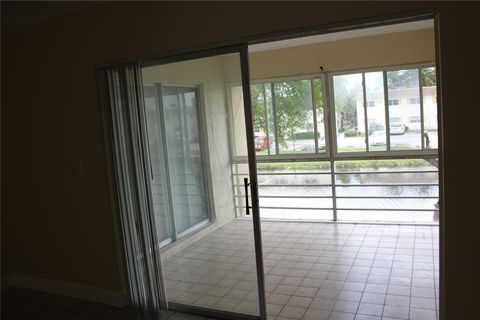
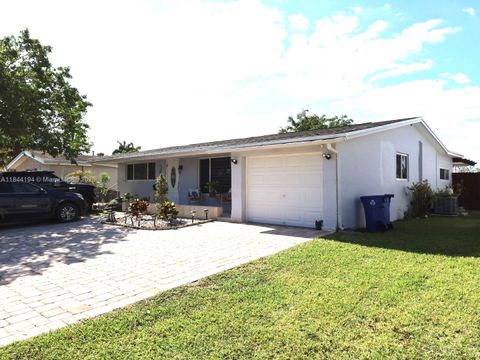
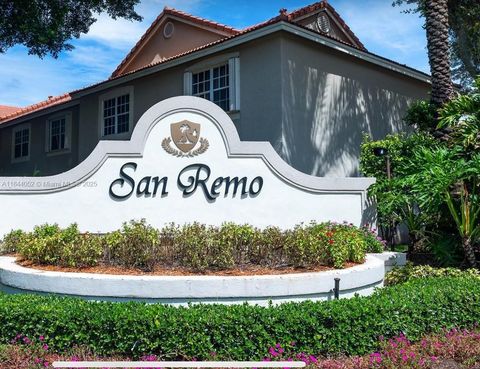
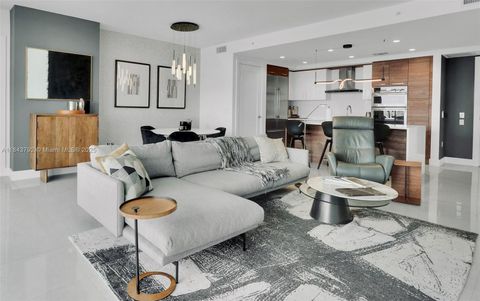
Active
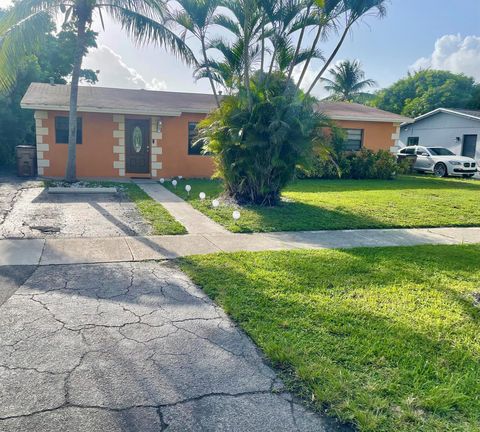
$379,900
3
bds
|
1
ba
|
1,284
sqft
|
built
1978
1260 SW 6th Ave, Deerfield Beach, FL 33441
$-124
Cash flow
-1.7%
Cash-on-Cash Return
5.8%
Cap rate
0.8%
Rent to Value Ratio
7,582 out of 8,882 properties for sale in Broward County
Limited Results Shown
Create a free account, or log in to reveal all property listings and enjoy the complete experience.
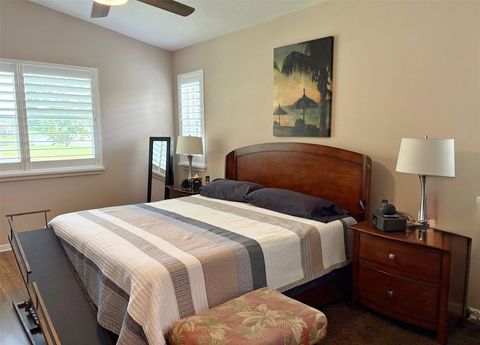
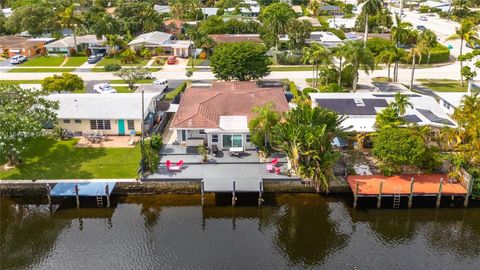
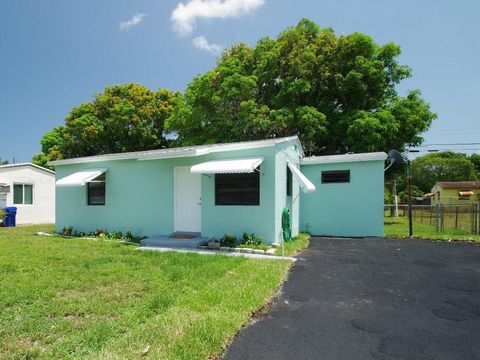
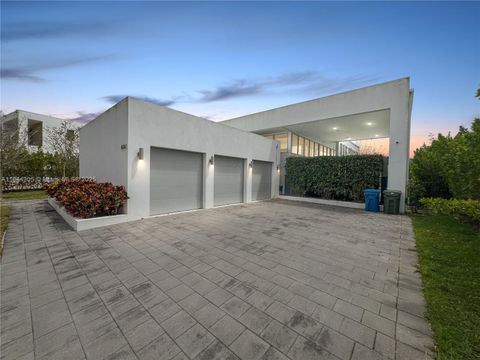
Active
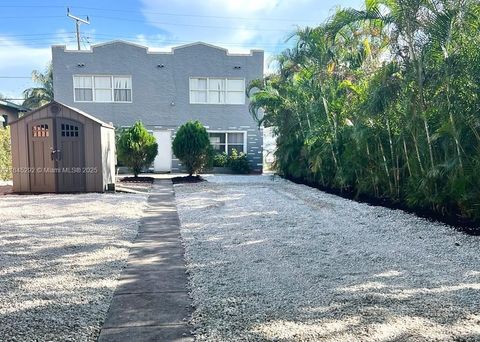
$950,000
2
bds
|
0
ba
|
0
sqft
|
built
1954
1940 Adams St, Hollywood, FL 33020
$-4,699
Cash flow
-25.8%
Cash-on-Cash Return
0.2%
Cap rate
0.2%
Rent to Value Ratio
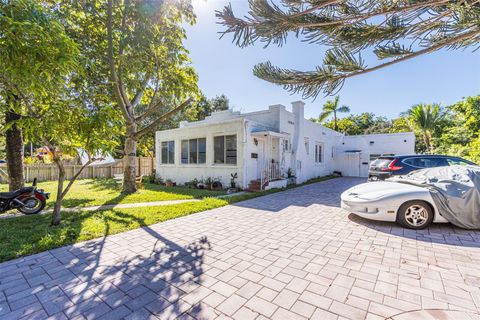
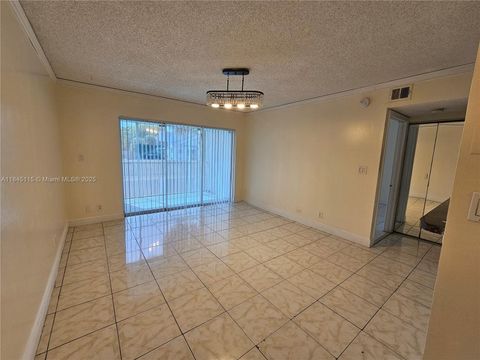
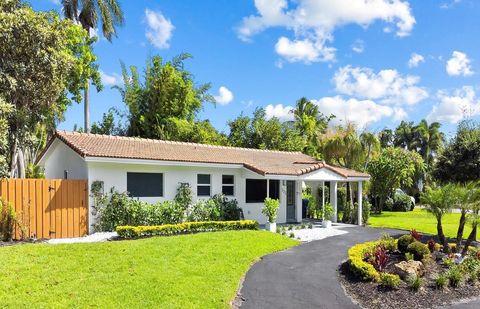
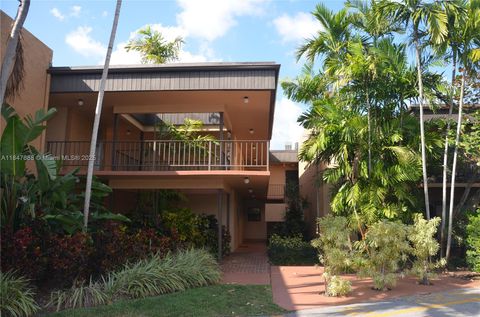
Active
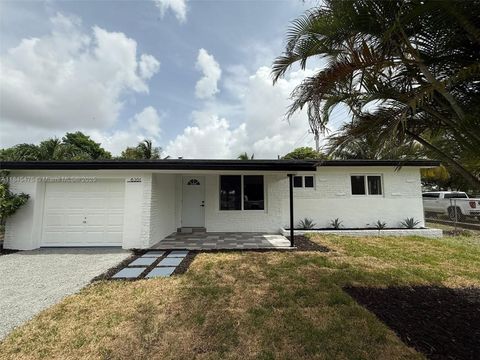
$564,900
3
bds
|
3
ba
|
1,536
sqft
|
built
1961
6201 SW 20th St, Miramar, FL 33023
$-1,489
Cash flow
-13.8%
Cash-on-Cash Return
3.0%
Cap rate
0.6%
Rent to Value Ratio

Active
$495,000
1
bds
|
2
ba
|
1,179
sqft
|
built
1966
3000 Holiday Dr, Fort Lauderdale, FL 33316
$-2,120
Cash flow
-22.3%
Cash-on-Cash Return
1.0%
Cap rate
0.6%
Rent to Value Ratio

Active
$440,000
2
bds
|
1
ba
|
1,158
sqft
|
built
1958
2420 N 58th Ter, Hollywood, FL 33021
$-413
Cash flow
-4.9%
Cash-on-Cash Return
5.0%
Cap rate
0.6%
Rent to Value Ratio
Active
$1,050,000
3
bds
|
3
ba
|
1,840
sqft
|
built
1985
14801 SW 31st Ct, Davie, FL 33331
$-3,535
Cash flow
-17.6%
Cash-on-Cash Return
2.1%
Cap rate
0.4%
Rent to Value Ratio
Active
$170,000
1
bds
|
2
ba
|
800
sqft
|
built
1975
4240 NW 21st St, Lauderhill, FL 33313
$-353
Cash flow
-10.8%
Cash-on-Cash Return
3.7%
Cap rate
0.9%
Rent to Value Ratio

Active
$150,000
1
bds
|
2
ba
|
800
sqft
|
built
1973
3740 Inverrary Dr, Lauderhill, FL 33319
$-350
Cash flow
-12.2%
Cash-on-Cash Return
3.3%
Cap rate
1.1%
Rent to Value Ratio

Active
$240,000
2
bds
|
2
ba
|
940
sqft
|
built
1983
10501 W Broward Blvd, Plantation, FL 33324
$-547
Cash flow
-11.9%
Cash-on-Cash Return
3.4%
Cap rate
0.9%
Rent to Value Ratio
Active
$625,000
3
bds
|
2
ba
|
2,106
sqft
|
built
1997
6161 Swans Ter, Coconut Creek, FL 33073
$-1,555
Cash flow
-13.0%
Cash-on-Cash Return
3.2%
Cap rate
0.6%
Rent to Value Ratio

Active
$1,799,999
3
bds
|
2
ba
|
1,746
sqft
|
built
1959
2228 SE 10th St, Pompano Beach, FL 33062
$-5,324
Cash flow
-15.4%
Cash-on-Cash Return
2.6%
Cap rate
0.4%
Rent to Value Ratio
Active
$849,900
bds
|
0
ba
|
2,869
sqft
|
built
1962
35 SW 4th St, Dania Beach, FL 33004
$-3,866
Cash flow
-23.7%
Cash-on-Cash Return
0.7%
Cap rate
0.2%
Rent to Value Ratio
Active
$11,995,000
6
bds
|
8
ba
|
6,263
sqft
|
built
1999
110 Holiday Dr, Hallandale Beach, FL 33009
$-62,782
Cash flow
-27.3%
Cash-on-Cash Return
-0.1%
Cap rate
0.1%
Rent to Value Ratio
Active
$580,000
3
bds
|
2
ba
|
1,537
sqft
|
built
1974
9170 NW 24th Pl, Sunrise, FL 33322
$-1,103
Cash flow
-9.9%
Cash-on-Cash Return
3.9%
Cap rate
0.6%
Rent to Value Ratio
Active
$899,000
4
bds
|
3
ba
|
2,204
sqft
|
built
1957
817 NW 30th St, Wilton Manors, FL 33311
$-1,515
Cash flow
-8.8%
Cash-on-Cash Return
4.1%
Cap rate
0.7%
Rent to Value Ratio
Active
$165,000
1
bds
|
1
ba
|
615
sqft
|
built
1987
5686 Rock Island Rd, Tamarac, FL 33319
$-260
Cash flow
-8.2%
Cash-on-Cash Return
4.3%
Cap rate
1.0%
Rent to Value Ratio
Active
$875,000
3
bds
|
2
ba
|
1,561
sqft
|
built
1998
1571 Breakwater Ter, Hollywood, FL 33019
$-3,113
Cash flow
-18.6%
Cash-on-Cash Return
1.9%
Cap rate
0.6%
Rent to Value Ratio
Active
$539,000
2
bds
|
3
ba
|
1,131
sqft
|
built
1995
1051 Sorrento Dr, Weston, FL 33326
$-1,668
Cash flow
-16.1%
Cash-on-Cash Return
2.4%
Cap rate
0.5%
Rent to Value Ratio
Active
$335,900
3
bds
|
2
ba
|
952
sqft
|
built
1954
2316 NW 13th Ct, Fort Lauderdale, FL 33311
$-314
Cash flow
-4.9%
Cash-on-Cash Return
5.0%
Cap rate
0.7%
Rent to Value Ratio
Active
$995,000
2
bds
|
2
ba
|
1,458
sqft
|
built
1956
332 NE 29th St, Wilton Manors, FL 33334
$-2,897
Cash flow
-15.2%
Cash-on-Cash Return
2.7%
Cap rate
0.5%
Rent to Value Ratio
Active
$248,000
2
bds
|
2
ba
|
1,100
sqft
|
built
1988
2846 S University Dr, Davie, FL 33328
$-888
Cash flow
-18.7%
Cash-on-Cash Return
1.8%
Cap rate
0.9%
Rent to Value Ratio
Active
$1,250,000
2
bds
|
2
ba
|
1,444
sqft
|
built
1984
1710 S Ocean Ln, Fort Lauderdale, FL 33316
$-6,120
Cash flow
-25.5%
Cash-on-Cash Return
0.3%
Cap rate
0.5%
Rent to Value Ratio
Active
$450,000
3
bds
|
2
ba
|
1,740
sqft
|
built
1982
606 Deer Creek Lake Point North Ln, Deerfield Beach, FL 33442
$-1,414
Cash flow
-16.4%
Cash-on-Cash Return
2.4%
Cap rate
0.7%
Rent to Value Ratio
Active
$419,000
3
bds
|
2
ba
|
1,364
sqft
|
built
1992
1245 NW 52nd Way, Deerfield Beach, FL 33442
$-1,135
Cash flow
-14.1%
Cash-on-Cash Return
2.9%
Cap rate
0.7%
Rent to Value Ratio
Active
$685,000
3
bds
|
3
ba
|
1,806
sqft
|
built
1989
9536 NW 9th Ct, Plantation, FL 33324
$-1,740
Cash flow
-13.3%
Cash-on-Cash Return
3.1%
Cap rate
0.5%
Rent to Value Ratio
Active
$575,000
3
bds
|
3
ba
|
1,793
sqft
|
built
2005
4331 SW 124th Way, Miramar, FL 33027
$-2,036
Cash flow
-18.5%
Cash-on-Cash Return
1.9%
Cap rate
0.6%
Rent to Value Ratio
Active
$179,000
2
bds
|
2
ba
|
875
sqft
|
built
1970
2221 NE 68th St, Fort Lauderdale, FL 33308
$-446
Cash flow
-13.0%
Cash-on-Cash Return
3.2%
Cap rate
1.1%
Rent to Value Ratio
Active
$675,000
3
bds
|
3
ba
|
1,730
sqft
|
built
1952
1912 NE 16th Ter, Fort Lauderdale, FL 33305
$-963
Cash flow
-7.4%
Cash-on-Cash Return
4.4%
Cap rate
0.7%
Rent to Value Ratio
Active
$1,299,000
3
bds
|
3
ba
|
2,204
sqft
|
built
2000
1375 Harbor Vw E, Hollywood, FL 33019
$-3,390
Cash flow
-13.6%
Cash-on-Cash Return
3.0%
Cap rate
0.7%
Rent to Value Ratio
Active
$1,695,000
2
bds
|
3
ba
|
1,501
sqft
|
built
2020
100 E Las Olas Blvd, Fort Lauderdale, FL 33301
$-5,995
Cash flow
-18.5%
Cash-on-Cash Return
1.9%
Cap rate
0.6%
Rent to Value Ratio
Active
$2,700,000
4
bds
|
6
ba
|
3,389
sqft
|
built
2019
16582 Botaniko Dr S, Weston, FL 33326
$-10,906
Cash flow
-21.1%
Cash-on-Cash Return
1.3%
Cap rate
0.4%
Rent to Value Ratio
Active
$165,000
1
bds
|
1
ba
|
750
sqft
|
built
1972
8851 N New River Canal Rd, Plantation, FL 33324
$-172
Cash flow
-5.4%
Cash-on-Cash Return
4.9%
Cap rate
1.1%
Rent to Value Ratio
Active
$1,100,000
3
bds
|
2
ba
|
1,433
sqft
|
built
1961
1709 SW 5th Pl, Fort Lauderdale, FL 33312
$-3,370
Cash flow
-16.0%
Cash-on-Cash Return
2.5%
Cap rate
0.5%
Rent to Value Ratio

Active
$520,000
2
bds
|
2
ba
|
1,287
sqft
|
built
1979
11701 NW 33rd St, Sunrise, FL 33323
$-684
Cash flow
-6.9%
Cash-on-Cash Return
4.6%
Cap rate
0.6%
Rent to Value Ratio

Active
$975,000
5
bds
|
3
ba
|
2,718
sqft
|
built
2001
11425 NW 75th Mnr, Parkland, FL 33076
$-2,626
Cash flow
-14.1%
Cash-on-Cash Return
2.9%
Cap rate
0.5%
Rent to Value Ratio
Active
$412,000
3
bds
|
3
ba
|
1,496
sqft
|
built
2020
1106 NW 40th Ave, Lauderhill, FL 33313
$-726
Cash flow
-9.2%
Cash-on-Cash Return
4.0%
Cap rate
0.8%
Rent to Value Ratio
Active
$829,998
3
bds
|
2
ba
|
1,719
sqft
|
built
1953
316 NW 24th St, Wilton Manors, FL 33311
$-2,120
Cash flow
-13.3%
Cash-on-Cash Return
3.1%
Cap rate
0.4%
Rent to Value Ratio

Active
$637,900
4
bds
|
2
ba
|
1,416
sqft
|
built
1960
3331 N 66th Ave, Hollywood, FL 33024
$-1,611
Cash flow
-13.2%
Cash-on-Cash Return
3.1%
Cap rate
0.5%
Rent to Value Ratio

Active
$495,000
3
bds
|
2
ba
|
920
sqft
|
built
1958
531 N 68th Ter, Hollywood, FL 33024
$-845
Cash flow
-8.9%
Cash-on-Cash Return
4.1%
Cap rate
0.5%
Rent to Value Ratio