Broward County Investment Properties for Sale
Browse homes for sale and investment properties in Broward County. Refine your search by price, property type, or more.
Best cash flowing properties in Broward County

Active
$249,999
2
bds
|
2
ba
|
1,050
sqft
|
built
1974
2440 Deer Creek Country Club Blvd, Deerfield Beach, FL 33442
$0
Cash flow
n/a
Cash-on-Cash Return
n/a
Cap rate
n/a
Rent to Value Ratio

Active
$1,695,000
2
bds
|
2
ba
|
1,487
sqft
|
built
1960
338 Taylor St, Hollywood, FL 33019
$0
Cash flow
n/a
Cash-on-Cash Return
n/a
Cap rate
n/a
Rent to Value Ratio
7,582 out of 8,882 properties for sale in Broward County
Limited Results Shown
Create a free account, or log in to reveal all property listings and enjoy the complete experience.

Active
$799,900
6
bds
|
4
ba
|
2,160
sqft
|
built
2020
4070 SW 49th Ct, Fort Lauderdale, FL 33314
$-1,380
Cash flow
-9.0%
Cash-on-Cash Return
4.1%
Cap rate
0.5%
Rent to Value Ratio
Active
$680,000
2
bds
|
2
ba
|
1,130
sqft
|
built
2002
2080 S Ocean Dr, Hallandale Beach, FL 33009
$-2,826
Cash flow
-21.7%
Cash-on-Cash Return
1.2%
Cap rate
0.6%
Rent to Value Ratio

Active
$650,000
3
bds
|
2
ba
|
2,158
sqft
|
built
1976
6307 Silk Oak Cir, Tamarac, FL 33319
$-1,289
Cash flow
-10.3%
Cash-on-Cash Return
3.8%
Cap rate
0.7%
Rent to Value Ratio

Active
$229,000
2
bds
|
1
ba
|
875
sqft
|
built
1965
2455 NE 51st St, Fort Lauderdale, FL 33308
$-600
Cash flow
-13.7%
Cash-on-Cash Return
3.0%
Cap rate
1.0%
Rent to Value Ratio

Active
$179,500
2
bds
|
2
ba
|
729
sqft
|
built
1969
241 SE 9th Ave, Pompano Beach, FL 33060
$-204
Cash flow
-5.9%
Cash-on-Cash Return
4.8%
Cap rate
1.1%
Rent to Value Ratio

Active
$488,000
2
bds
|
2
ba
|
1,030
sqft
|
built
2015
2602 E Hallandale Beach Blvd, Hallandale Beach, FL 33009
$0
Cash flow
n/a
Cash-on-Cash Return
n/a
Cap rate
n/a
Rent to Value Ratio

Active
$325,000
2
bds
|
2
ba
|
1,075
sqft
|
built
1979
600 Parkview Dr, Hallandale Beach, FL 33009
$-1,197
Cash flow
-19.2%
Cash-on-Cash Return
1.7%
Cap rate
0.8%
Rent to Value Ratio
Active
$849,900
3
bds
|
2
ba
|
1,481
sqft
|
built
1954
2936 Coral Shores Dr, Fort Lauderdale, FL 33306
$-1,598
Cash flow
-9.8%
Cash-on-Cash Return
3.9%
Cap rate
0.5%
Rent to Value Ratio

Active
$150,000
2
bds
|
2
ba
|
880
sqft
|
built
1974
259 S Cypress Rd, Pompano Beach, FL 33060
$-588
Cash flow
-20.5%
Cash-on-Cash Return
1.4%
Cap rate
1.2%
Rent to Value Ratio

Active
$425,000
1
bds
|
2
ba
|
980
sqft
|
built
1970
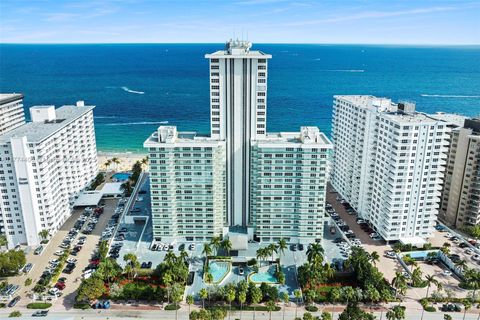
3750 Galt Ocean Dr, Fort Lauderdale, FL 33308
$-1,477
Cash flow
-18.1%
Cash-on-Cash Return
2.0%
Cap rate
0.6%
Rent to Value Ratio

Active
$1,249,000
3
bds
|
2
ba
|
2,485
sqft
|
built
1973
837 Washington St, Hollywood, FL 33019
$-4,117
Cash flow
-17.2%
Cash-on-Cash Return
2.2%
Cap rate
0.4%
Rent to Value Ratio

Active
$690,000
3
bds
|
2
ba
|
1,818
sqft
|
built
1969
1540 NE 47th St, Oakland Park, FL 33334
$-1,463
Cash flow
-11.1%
Cash-on-Cash Return
3.6%
Cap rate
0.6%
Rent to Value Ratio

Active
$639,999
1
bds
|
1
ba
|
724
sqft
|
built
2011
3101 Bayshore Dr, Fort Lauderdale, FL 33304
$-3,168
Cash flow
-25.8%
Cash-on-Cash Return
0.2%
Cap rate
0.6%
Rent to Value Ratio
Active
$585,000
3
bds
|
3
ba
|
2,192
sqft
|
built
1997
4004 NW 61st Ter, Coral Springs, FL 33067
$-1,523
Cash flow
-13.6%
Cash-on-Cash Return
3.0%
Cap rate
0.6%
Rent to Value Ratio
Active
$295,000
2
bds
|
2
ba
|
1,000
sqft
|
built
1990
9977 Westview Dr, Coral Springs, FL 33076
$-633
Cash flow
-11.2%
Cash-on-Cash Return
3.6%
Cap rate
0.8%
Rent to Value Ratio

Active
$3,095,000
6
bds
|
7
ba
|
5,647
sqft
|
built
2004
5941 SW 185th Way, Southwest Ranches, FL 33332
$-12,392
Cash flow
-20.9%
Cash-on-Cash Return
1.3%
Cap rate
0.3%
Rent to Value Ratio

Active
$349,900
3
bds
|
3
ba
|
1,604
sqft
|
built
1982
1616 Cypress Pointe Dr, Coral Springs, FL 33071
$-1,261
Cash flow
-18.8%
Cash-on-Cash Return
1.8%
Cap rate
0.7%
Rent to Value Ratio

Active
$179,900
1
bds
|
1
ba
|
550
sqft
|
built
1970
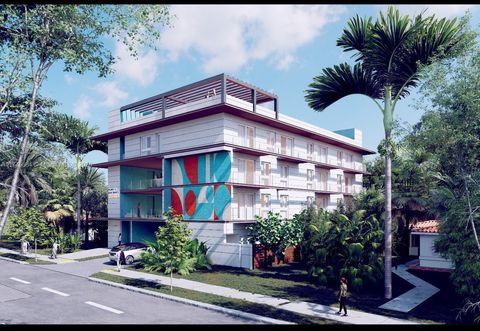
1824 Monroe St, Hollywood, FL 33020
$-442
Cash flow
-12.8%
Cash-on-Cash Return
3.2%
Cap rate
0.8%
Rent to Value Ratio
Active
$474,900
1
bds
|
2
ba
|
1,088
sqft
|
built
1975
3900 Galt Ocean Dr, Fort Lauderdale, FL 33308
$-1,685
Cash flow
-18.5%
Cash-on-Cash Return
1.9%
Cap rate
0.7%
Rent to Value Ratio
Active
$436,000
3
bds
|
2
ba
|
1,273
sqft
|
built
1954
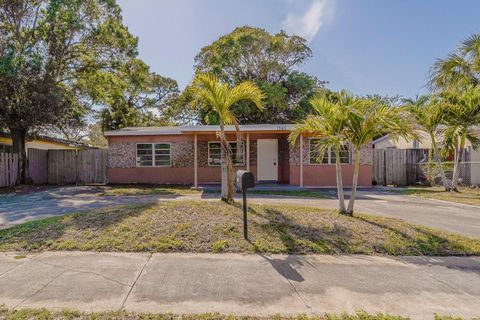
1345 SW 22nd Ter, Fort Lauderdale, FL 33312
$-903
Cash flow
-10.8%
Cash-on-Cash Return
3.7%
Cap rate
0.6%
Rent to Value Ratio

Active
$615,000
3
bds
|
2
ba
|
1,533
sqft
|
built
1976
750 NW 77th Ave, Plantation, FL 33324
$-48,842
Cash flow
-414.4%
Cash-on-Cash Return
-89.2%
Cap rate
0.6%
Rent to Value Ratio

Active
$1,150,000
2
bds
|
2
ba
|
1,880
sqft
|
built
1969
2100 S Ocean Ln, Fort Lauderdale, FL 33316
$-4,543
Cash flow
-20.6%
Cash-on-Cash Return
1.4%
Cap rate
0.6%
Rent to Value Ratio

Active
$589,900
3
bds
|
3
ba
|
2,006
sqft
|
built
1981
3750 NW 73rd Way, Coral Springs, FL 33065
$-845
Cash flow
-7.5%
Cash-on-Cash Return
4.4%
Cap rate
0.7%
Rent to Value Ratio
Active
$719,000
4
bds
|
3
ba
|
2,314
sqft
|
built
2002
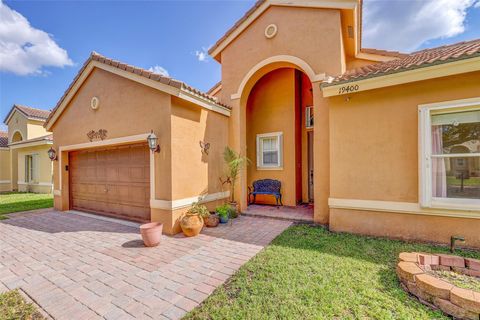
19400 SW 29th Ct, Miramar, FL 33029
$-1,608
Cash flow
-11.7%
Cash-on-Cash Return
3.5%
Cap rate
0.6%
Rent to Value Ratio

Active
$949,000
2
bds
|
2
ba
|
1,176
sqft
|
built
2011
3101 Bayshore Dr, Fort Lauderdale, FL 33304
$-4,420
Cash flow
-24.3%
Cash-on-Cash Return
0.6%
Cap rate
0.7%
Rent to Value Ratio

Active
$580,000
3
bds
|
2
ba
|
1,580
sqft
|
built
1988
3185 NW 120th Way, Sunrise, FL 33323
$-1,427
Cash flow
-12.8%
Cash-on-Cash Return
3.2%
Cap rate
0.6%
Rent to Value Ratio
Active
$1,125,000
4
bds
|
3
ba
|
1,508
sqft
|
built
1951
2011 Plunkett St, Hollywood, FL 33020
$-4,576
Cash flow
-21.2%
Cash-on-Cash Return
1.3%
Cap rate
0.2%
Rent to Value Ratio
Active
$499,000
2
bds
|
1
ba
|
999
sqft
|
built
2007
1945 S Ocean Dr, Hallandale Beach, FL 33009
$-1,691
Cash flow
-17.7%
Cash-on-Cash Return
2.1%
Cap rate
0.7%
Rent to Value Ratio

Active
$350,000
3
bds
|
3
ba
|
1,480
sqft
|
built
1985
3779 Carambola Cir N, Coconut Creek, FL 33066
$-513
Cash flow
-7.6%
Cash-on-Cash Return
4.4%
Cap rate
0.8%
Rent to Value Ratio

Active
$119,000
1
bds
|
1
ba
|
720
sqft
|
built
1979
6700 Cypress Rd, Plantation, FL 33317
$-101
Cash flow
-4.4%
Cash-on-Cash Return
5.1%
Cap rate
1.3%
Rent to Value Ratio

Active
$350,650
1
bds
|
2
ba
|
710
sqft
|
built
1970
2731 NE 14th Street Cswy, Pompano Beach, FL 33062
$-1,402
Cash flow
-20.9%
Cash-on-Cash Return
1.3%
Cap rate
0.6%
Rent to Value Ratio

Active
$585,000
4
bds
|
3
ba
|
1,898
sqft
|
built
1962
5101 SW 6th Pl, Margate, FL 33068
$-767
Cash flow
-6.8%
Cash-on-Cash Return
4.6%
Cap rate
0.7%
Rent to Value Ratio

Active
$399,000
2
bds
|
2
ba
|
970
sqft
|
built
1974
111 Briny Ave, Pompano Beach, FL 33062
$-2,036
Cash flow
-26.6%
Cash-on-Cash Return
0.0%
Cap rate
0.6%
Rent to Value Ratio

Active
$1,825,000
5
bds
|
5
ba
|
3,557
sqft
|
built
1993
17451 SW 46th St, Southwest Ranches, FL 33331
$-6,270
Cash flow
-17.9%
Cash-on-Cash Return
2.0%
Cap rate
0.4%
Rent to Value Ratio

Active
$339,000
2
bds
|
2
ba
|
1,300
sqft
|
built
1970
401 Golden Isles Dr, Hallandale Beach, FL 33009
$-1,449
Cash flow
-22.3%
Cash-on-Cash Return
1.0%
Cap rate
0.8%
Rent to Value Ratio
Active
$182,000
1
bds
|
2
ba
|
630
sqft
|
built
1984
5501 Lakeside Dr, Margate, FL 33063
$-382
Cash flow
-11.0%
Cash-on-Cash Return
3.6%
Cap rate
0.9%
Rent to Value Ratio

Active
$669,900
4
bds
|
3
ba
|
2,134
sqft
|
built
1977
217 SE 5th St, Dania Beach, FL 33004
$-1,340
Cash flow
-10.4%
Cash-on-Cash Return
3.7%
Cap rate
0.6%
Rent to Value Ratio

Active
$199,000
2
bds
|
2
ba
|
985
sqft
|
built
1989
8734 SW 3rd St, Pembroke Pines, FL 33025
$-318
Cash flow
-8.3%
Cash-on-Cash Return
4.2%
Cap rate
1.2%
Rent to Value Ratio