Miami Dade County Investment Properties for Sale
Browse homes for sale and investment properties in Miami Dade County. Refine your search by price, property type, or more.
Best cash flowing properties in Miami Dade County

Active
$135,000
bds
|
1
ba
|
112
sqft
|
built
1966
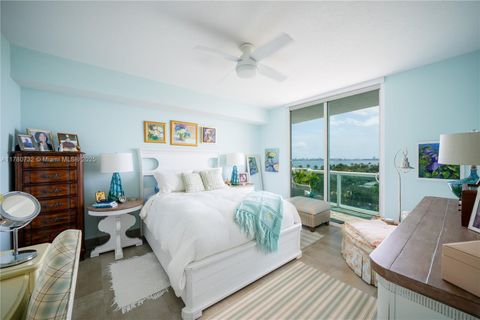
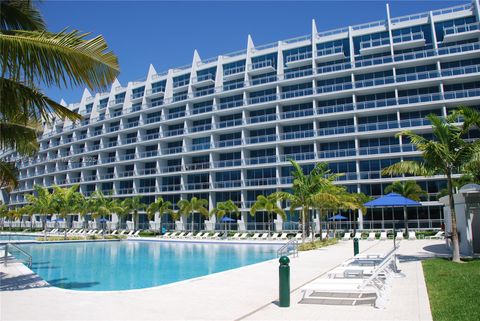
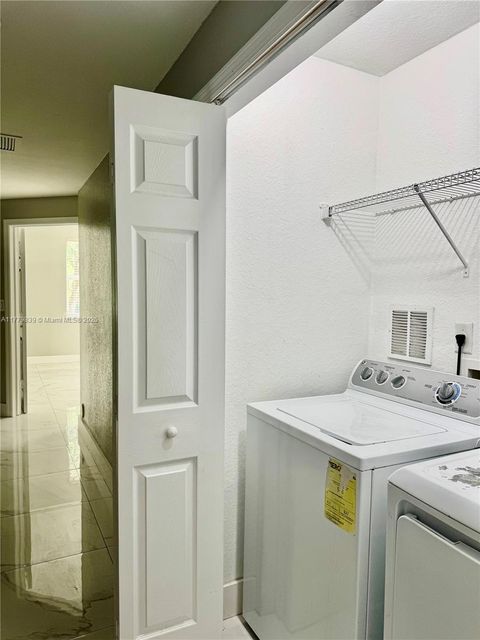
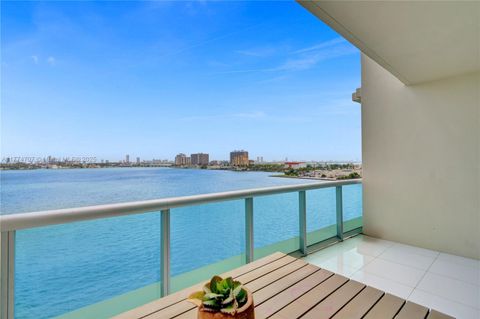
2899 Collins Ave, Miami Beach, FL 33140
$597
Cash flow
23.1%
Cash-on-Cash Return
11.5%
Cap rate
1.6%
Rent to Value Ratio

Active
$330,000
3
bds
|
2
ba
|
1,011
sqft
|
built
1988
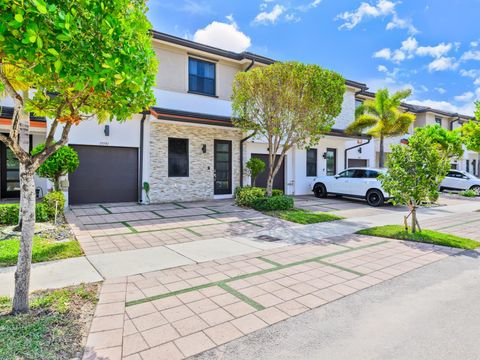
546 SW 1st St, Miami, FL 33130
$48
Cash flow
0.8%
Cash-on-Cash Return
6.3%
Cap rate
0.9%
Rent to Value Ratio
10,000 out of 13,422 properties for sale in Miami Dade County
Limited Results Shown
Create a free account, or log in to reveal all property listings and enjoy the complete experience.

Active
$319,000
1
bds
|
1
ba
|
496
sqft
|
built
1952
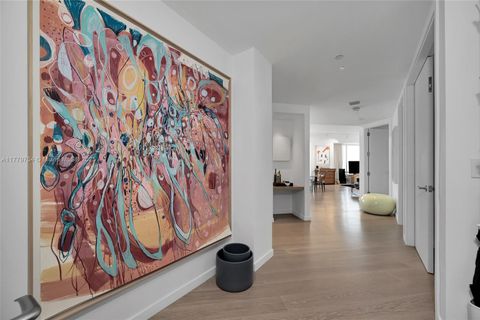
1840 James Ave, Miami Beach, FL 33139
$-857
Cash flow
-14.0%
Cash-on-Cash Return
2.9%
Cap rate
0.7%
Rent to Value Ratio

Active
$699,900
3
bds
|
2
ba
|
1,414
sqft
|
built
1941
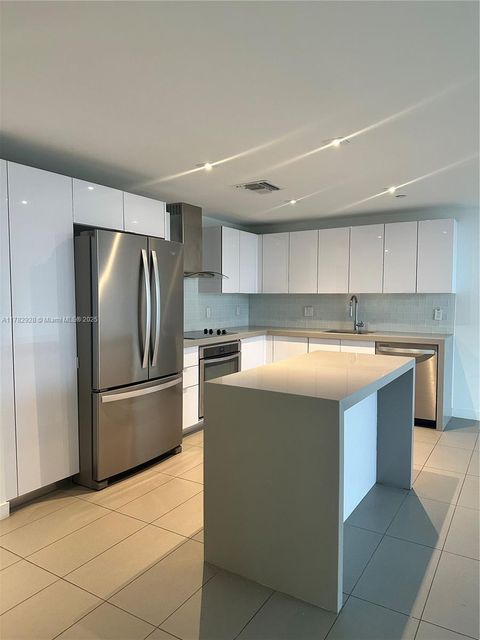
3001 NW 3rd St, Miami, FL 33125
$-1,800
Cash flow
-13.4%
Cash-on-Cash Return
3.1%
Cap rate
0.5%
Rent to Value Ratio

Active
$314,000
1
bds
|
1
ba
|
726
sqft
|
built
1966
2899 Collins Ave, Miami Beach, FL 33140
$-1,159
Cash flow
-19.3%
Cash-on-Cash Return
1.7%
Cap rate
0.6%
Rent to Value Ratio
Active
$765,000
3
bds
|
2
ba
|
1,552
sqft
|
built
2007
7900 Harbor Island Dr, North Bay Village, FL 33141
$-2,542
Cash flow
-17.3%
Cash-on-Cash Return
2.2%
Cap rate
0.6%
Rent to Value Ratio

Active
$920,000
3
bds
|
2
ba
|
1,489
sqft
|
built
2010
250 Sunny Isles Blvd, Sunny Isles Beach, FL 33160
$-3,159
Cash flow
-17.9%
Cash-on-Cash Return
2.0%
Cap rate
0.7%
Rent to Value Ratio

Active
$530,500
3
bds
|
3
ba
|
1,626
sqft
|
built
1940
20 NE 118th St, Miami, FL 33161
$-1,430
Cash flow
-14.1%
Cash-on-Cash Return
2.9%
Cap rate
0.6%
Rent to Value Ratio
Active
$1,150,000
2
bds
|
0
ba
|
1,928
sqft
|
built
1916
1114 SW 13th Ct, Miami, FL 33135
$-5,313
Cash flow
-24.1%
Cash-on-Cash Return
0.6%
Cap rate
0.2%
Rent to Value Ratio
Active
$695,000
2
bds
|
3
ba
|
1,663
sqft
|
built
2008
2950 NE 188th St, Aventura, FL 33180
$-2,834
Cash flow
-21.3%
Cash-on-Cash Return
1.3%
Cap rate
0.7%
Rent to Value Ratio

Active
$530,000
2
bds
|
2
ba
|
1,492
sqft
|
built
1972
19380 Collins Ave, Sunny Isles Beach, FL 33160
$-1,983
Cash flow
-19.5%
Cash-on-Cash Return
1.7%
Cap rate
0.7%
Rent to Value Ratio

Active
$990,000
1
bds
|
2
ba
|
880
sqft
|
built
2016
1300 S Miami Ave, Miami, FL 33130
$-3,968
Cash flow
-20.9%
Cash-on-Cash Return
1.3%
Cap rate
0.5%
Rent to Value Ratio

Active
$650,000
2
bds
|
2
ba
|
1,227
sqft
|
built
2005
325 S Biscayne Blvd, Miami, FL 33131
$-2,736
Cash flow
-22.0%
Cash-on-Cash Return
1.1%
Cap rate
0.6%
Rent to Value Ratio

Active
$1,325,000
2
bds
|
2
ba
|
1,645
sqft
|
built
2018
455 NE 39th St, Miami, FL 33137
$-2,698
Cash flow
-10.6%
Cash-on-Cash Return
3.7%
Cap rate
0.5%
Rent to Value Ratio

Active
$799,900
3
bds
|
3
ba
|
1,820
sqft
|
built
1957
30 NW 152nd St, Miami, FL 33169
$-1,137
Cash flow
-7.4%
Cash-on-Cash Return
4.4%
Cap rate
0.6%
Rent to Value Ratio

Active
$695,000
4
bds
|
2
ba
|
1,516
sqft
|
built
1956
820 W 54th St, Hialeah, FL 33012
$-1,489
Cash flow
-11.2%
Cash-on-Cash Return
3.6%
Cap rate
0.5%
Rent to Value Ratio
Active
$274,900
2
bds
|
2
ba
|
980
sqft
|
built
1966
20380 NW 7th Ave, Miami Gardens, FL 33169
$-386
Cash flow
-7.3%
Cash-on-Cash Return
4.5%
Cap rate
0.7%
Rent to Value Ratio

Active
$230,000
2
bds
|
2
ba
|
1,048
sqft
|
built
2006
2665 NE 4th St, Homestead, FL 33033
$-443
Cash flow
-10.0%
Cash-on-Cash Return
3.8%
Cap rate
0.9%
Rent to Value Ratio

Active
$549,000
3
bds
|
2
ba
|
1,080
sqft
|
built
1970
19513 SW 116th Ave, Miami, FL 33157
$-1,150
Cash flow
-10.9%
Cash-on-Cash Return
3.6%
Cap rate
0.6%
Rent to Value Ratio
Active
$430,000
3
bds
|
2
ba
|
1,207
sqft
|
built
2011
11503 NW 89th St, Doral, FL 33178
$-881
Cash flow
-10.7%
Cash-on-Cash Return
3.7%
Cap rate
0.8%
Rent to Value Ratio

Active
$407,999
1
bds
|
2
ba
|
910
sqft
|
built
1968
6770 Indian Creek Dr, Miami Beach, FL 33141
$-1,511
Cash flow
-19.3%
Cash-on-Cash Return
1.7%
Cap rate
0.7%
Rent to Value Ratio

Active
$1,425,000
4
bds
|
3
ba
|
3,153
sqft
|
built
1965
13925 SW 74th Ave, Palmetto Bay, FL 33158
$-2,870
Cash flow
-10.5%
Cash-on-Cash Return
3.7%
Cap rate
0.5%
Rent to Value Ratio

Active
$450,000
3
bds
|
2
ba
|
1,164
sqft
|
built
2004
6001 SW 70th St, South Miami, FL 33143
$-1,487
Cash flow
-17.2%
Cash-on-Cash Return
2.2%
Cap rate
0.7%
Rent to Value Ratio

Active
$215,000
2
bds
|
2
ba
|
1,146
sqft
|
built
1962
11930 NE 19th Dr, North Miami, FL 33181
$-44
Cash flow
-1.1%
Cash-on-Cash Return
5.9%
Cap rate
1.1%
Rent to Value Ratio

Active
$3,950,000
2
bds
|
3
ba
|
1,704
sqft
|
built
2016
10201 Collins Ave, Bal Harbour, FL 33154
$-22,728
Cash flow
-30.0%
Cash-on-Cash Return
-0.8%
Cap rate
0.2%
Rent to Value Ratio

Active
$275,000
2
bds
|
1
ba
|
760
sqft
|
built
1981
3601 SW 117th Ave, Miami, FL 33175
$-611
Cash flow
-11.6%
Cash-on-Cash Return
3.5%
Cap rate
0.7%
Rent to Value Ratio
Active
$605,000
3
bds
|
3
ba
|
1,850
sqft
|
built
2017
15591 NW 91st Ct, Miami Lakes, FL 33018
$-1,686
Cash flow
-14.5%
Cash-on-Cash Return
2.8%
Cap rate
0.6%
Rent to Value Ratio

Active
$656,500
1
bds
|
1
ba
|
443
sqft
|
built
2022
398 NE 5th St, Miami, FL 33132
$-2,104
Cash flow
-16.7%
Cash-on-Cash Return
2.3%
Cap rate
0.6%
Rent to Value Ratio
Active
$4,650,000
3
bds
|
3
ba
|
2,738
sqft
|
built
2003
1425 Brickell Ave, Miami, FL 33131
$-21,909
Cash flow
-24.6%
Cash-on-Cash Return
0.5%
Cap rate
0.2%
Rent to Value Ratio

Active
$695,000
1
bds
|
1
ba
|
1,019
sqft
|
built
1965
10185 Collins Ave, Bal Harbour, FL 33154
$-2,959
Cash flow
-22.2%
Cash-on-Cash Return
1.0%
Cap rate
0.5%
Rent to Value Ratio

Active
$592,000
4
bds
|
3
ba
|
2,799
sqft
|
built
2007
13990 SW 274th Ter, Homestead, FL 33032
$-1,516
Cash flow
-13.4%
Cash-on-Cash Return
3.1%
Cap rate
0.5%
Rent to Value Ratio

Active
$180,000
1
bds
|
1
ba
|
578
sqft
|
built
1949
630 84th St, Miami Beach, FL 33141
$-657
Cash flow
-19.0%
Cash-on-Cash Return
1.8%
Cap rate
1.0%
Rent to Value Ratio
Active
$440,000
1
bds
|
1
ba
|
752
sqft
|
built
2018
1600 NE 1st Ave, Miami, FL 33132
$-1,697
Cash flow
-20.1%
Cash-on-Cash Return
1.5%
Cap rate
0.6%
Rent to Value Ratio
Active
$1,039,000
2
bds
|
3
ba
|
1,884
sqft
|
built
2009
7935 East Dr, North Bay Village, FL 33141
$-3,964
Cash flow
-19.9%
Cash-on-Cash Return
1.6%
Cap rate
0.6%
Rent to Value Ratio

Active
$295,000
1
bds
|
1
ba
|
570
sqft
|
built
1940
1561 Lenox Ave, Miami Beach, FL 33139
$-1,006
Cash flow
-17.8%
Cash-on-Cash Return
2.1%
Cap rate
0.7%
Rent to Value Ratio

Active
$299,000
1
bds
|
2
ba
|
718
sqft
|
built
1972
1345 Lincoln Rd, Miami Beach, FL 33139
$-547
Cash flow
-9.5%
Cash-on-Cash Return
4.0%
Cap rate
0.9%
Rent to Value Ratio
Active
$655,000
4
bds
|
3
ba
|
2,084
sqft
|
built
1993
14515 SW 138th Ave, Miami, FL 33186
$-1,416
Cash flow
-11.3%
Cash-on-Cash Return
3.6%
Cap rate
0.5%
Rent to Value Ratio

Active
$990,000
3
bds
|
3
ba
|
1,620
sqft
|
built
2003
2752 SW 11th St, Miami, FL 33135
$-2,925
Cash flow
-15.4%
Cash-on-Cash Return
2.6%
Cap rate
0.4%
Rent to Value Ratio

Active
$1,595,000
3
bds
|
0
ba
|
3,287
sqft
|
built
1923
1664 SW 9th St, Miami, FL 33135
$-6,761
Cash flow
-22.1%
Cash-on-Cash Return
1.1%
Cap rate
0.2%
Rent to Value Ratio

Active
$3,697,000
2
bds
|
3
ba
|
1,672
sqft
|
built
2024
1425 Brickell Ave, Miami, FL 33131
$-17,555
Cash flow
-24.8%
Cash-on-Cash Return
0.4%
Cap rate
0.2%
Rent to Value Ratio