Palm Beach County Investment Properties for Sale
Browse homes for sale and investment properties in Palm Beach County. Refine your search by price, property type, or more.
Best cash flowing properties in Palm Beach County
Active
$205,000
3
bds
|
2
ba
|
1,128
sqft
|
built
1962
125 SW 11th Ave, South Bay, FL 33493
$140
Cash flow
3.6%
Cash-on-Cash Return
7.0%
Cap rate
1.0%
Rent to Value Ratio
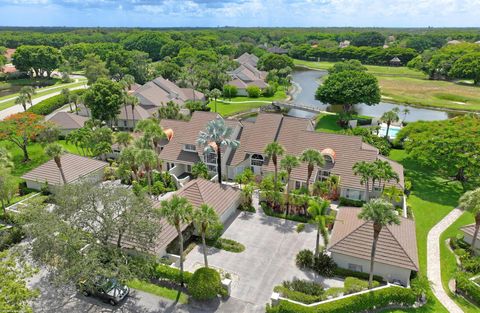
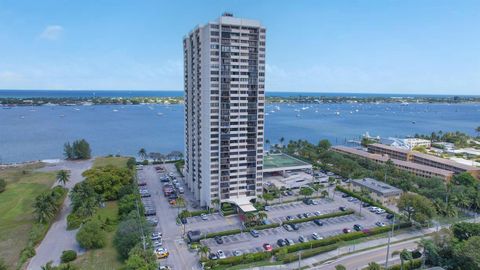
Active
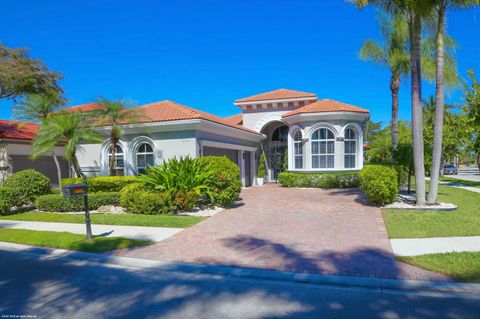
$825,000
2
bds
|
2
ba
|
1,735
sqft
|
built
1985
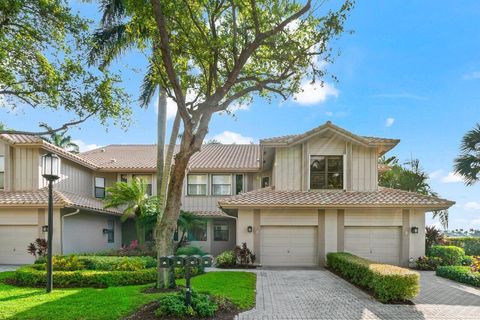
2623 Muirfield Ct, Wellington, FL 33414
$77
Cash flow
0.5%
Cash-on-Cash Return
6.3%
Cap rate
1.1%
Rent to Value Ratio
5,431 out of 6,593 properties for sale in Palm Beach County
Limited Results Shown
Create a free account, or log in to reveal all property listings and enjoy the complete experience.
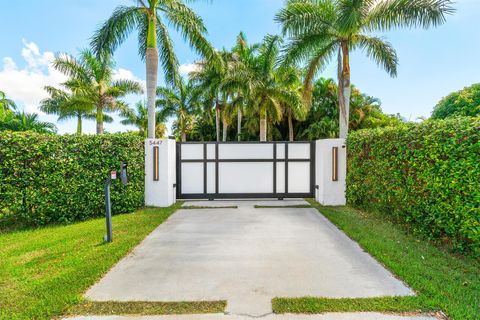
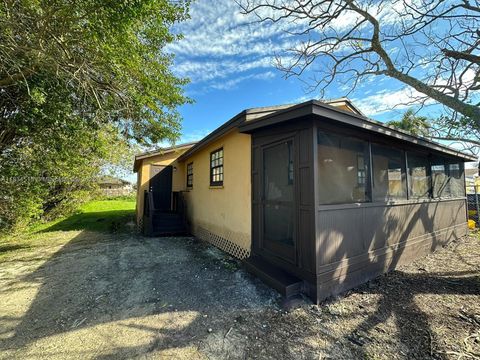
Active
$5,795,000
3
bds
|
3
ba
|
3,286
sqft
|
built
1958
5447 Center St, Jupiter, FL 33458
$-27,085
Cash flow
-24.4%
Cash-on-Cash Return
0.5%
Cap rate
0.1%
Rent to Value Ratio
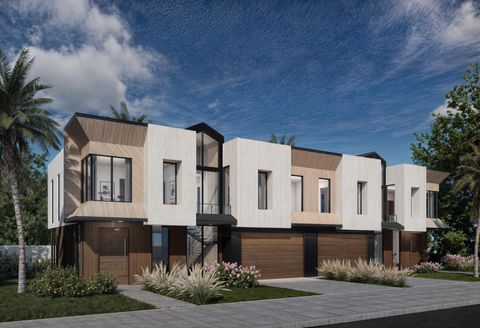
Active
$3,750,000
4
bds
|
5
ba
|
3,055
sqft
|
built
2026
801 Bond Way, Delray Beach, FL 33483
$-18,716
Cash flow
-26.0%
Cash-on-Cash Return
0.2%
Cap rate
0.1%
Rent to Value Ratio
Active
$199,000
1
bds
|
2
ba
|
660
sqft
|
built
1975
9355 SW 8th St, Boca Raton, FL 33428
$-598
Cash flow
-15.7%
Cash-on-Cash Return
2.5%
Cap rate
0.8%
Rent to Value Ratio
Active
$530,000
4
bds
|
3
ba
|
1,798
sqft
|
built
1995
20931 Via Jasmine, Boca Raton, FL 33428
$-1,724
Cash flow
-17.0%
Cash-on-Cash Return
2.2%
Cap rate
0.5%
Rent to Value Ratio
Active
$750,000
bds
|
0
ba
|
2,544
sqft
|
built
1954
1125 N F St, Lake Worth, FL 33460
$-2,456
Cash flow
-17.1%
Cash-on-Cash Return
2.2%
Cap rate
0.4%
Rent to Value Ratio
Active
$1,297,000
6
bds
|
5
ba
|
3,477
sqft
|
built
2021
13148 Whistler Mountain Rd, Delray Beach, FL 33446
$-2,381
Cash flow
-9.6%
Cash-on-Cash Return
3.9%
Cap rate
0.7%
Rent to Value Ratio
Active
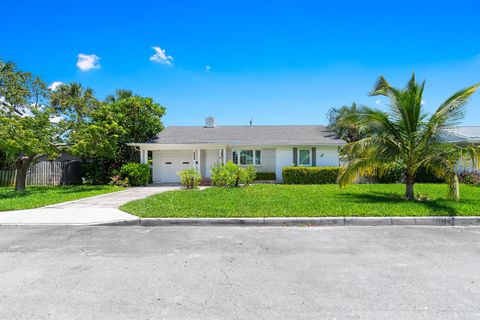
$699,000
4
bds
|
2
ba
|
2,262
sqft
|
built
1964
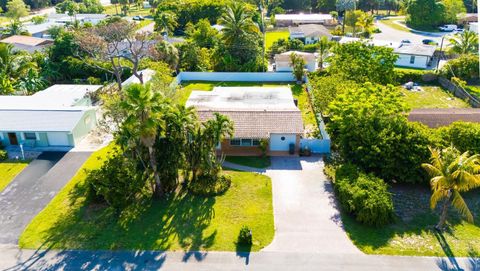
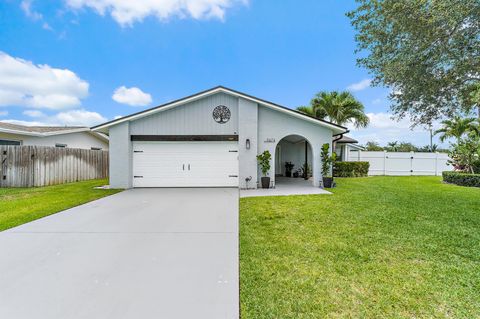
439 Forest Estate Dr, West Palm Beach, FL 33415
$-1,465
Cash flow
-10.9%
Cash-on-Cash Return
3.6%
Cap rate
0.6%
Rent to Value Ratio
Active
$410,000
3
bds
|
4
ba
|
1,542
sqft
|
built
2007
122 W Royal Palm Cir, Jupiter, FL 33458
$-1,509
Cash flow
-19.2%
Cash-on-Cash Return
1.7%
Cap rate
0.7%
Rent to Value Ratio
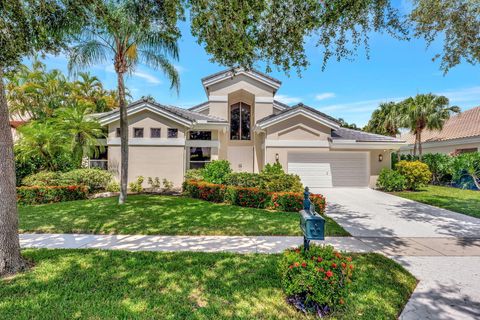
Active
$1,400,000
4
bds
|
3
ba
|
2,665
sqft
|
built
1990
7700 Fairway Trl, Boca Raton, FL 33487
$-4,497
Cash flow
-16.8%
Cash-on-Cash Return
2.3%
Cap rate
0.4%
Rent to Value Ratio
Active
$250,000
2
bds
|
2
ba
|
1,008
sqft
|
built
1984
9780 Pineapple Tree Dr, Boynton Beach, FL 33436
$-620
Cash flow
-12.9%
Cash-on-Cash Return
3.2%
Cap rate
0.8%
Rent to Value Ratio
Active
$585,000
3
bds
|
3
ba
|
2,110
sqft
|
built
1997
16927 Isle Of Palms Dr, Delray Beach, FL 33484
$-1,652
Cash flow
-14.7%
Cash-on-Cash Return
2.8%
Cap rate
0.6%
Rent to Value Ratio
Active
$699,000
3
bds
|
2
ba
|
1,839
sqft
|
built
1995
3971 Schooner Pointe Dr, Jupiter, FL 33477
$-3,136
Cash flow
-23.4%
Cash-on-Cash Return
0.8%
Cap rate
0.6%
Rent to Value Ratio
Active
$265,000
1
bds
|
1
ba
|
820
sqft
|
built
2010
350 N Federal Hwy, Boynton Beach, FL 33435
$-878
Cash flow
-17.3%
Cash-on-Cash Return
2.2%
Cap rate
0.9%
Rent to Value Ratio
Active
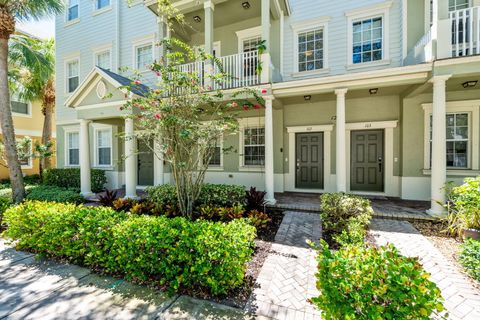
$359,900
2
bds
|
3
ba
|
1,786
sqft
|
built
2008
221 Greenwich Cir, Jupiter, FL 33458
$-950
Cash flow
-13.8%
Cash-on-Cash Return
3.0%
Cap rate
0.7%
Rent to Value Ratio
Active
$300,000
2
bds
|
3
ba
|
1,192
sqft
|
built
1986
2403 Lena Ln, West Palm Beach, FL 33415
$-551
Cash flow
-9.6%
Cash-on-Cash Return
3.9%
Cap rate
0.8%
Rent to Value Ratio
Active
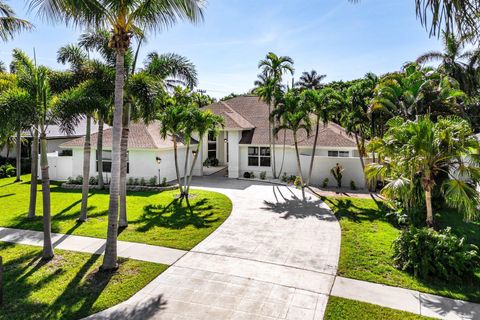
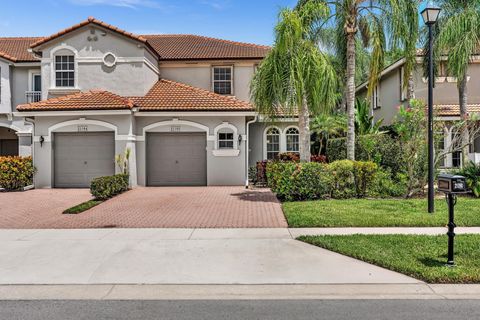
$1,134,900
3
bds
|
3
ba
|
2,506
sqft
|
built
2005
10601 Piazza Fontana, West Palm Beach, FL 33412
$-3,233
Cash flow
-14.9%
Cash-on-Cash Return
2.7%
Cap rate
0.5%
Rent to Value Ratio
Active
$449,000
3
bds
|
2
ba
|
1,600
sqft
|
built
1984
13 Lexington Ln E, Palm Beach Gardens, FL 33418
$-1,112
Cash flow
-12.9%
Cash-on-Cash Return
3.2%
Cap rate
0.7%
Rent to Value Ratio
Active
$264,900
1
bds
|
1
ba
|
805
sqft
|
built
1980
665 Enfield St, Boca Raton, FL 33487
$-112
Cash flow
-2.2%
Cash-on-Cash Return
5.6%
Cap rate
0.9%
Rent to Value Ratio
Active
$609,000
3
bds
|
3
ba
|
1,728
sqft
|
built
2019
10143 Akenside Dr, Boca Raton, FL 33428
$-1,451
Cash flow
-12.4%
Cash-on-Cash Return
3.3%
Cap rate
0.6%
Rent to Value Ratio
Active
$749,900
3
bds
|
3
ba
|
1,848
sqft
|
built
2007
2640 Lake Shore Dr, Riviera Beach, FL 33404
$-2,554
Cash flow
-17.8%
Cash-on-Cash Return
2.1%
Cap rate
0.7%
Rent to Value Ratio
Active
$279,900
2
bds
|
3
ba
|
1,262
sqft
|
built
1979
4803 Waterview Cir, Palm Springs, FL 33461
$-776
Cash flow
-14.5%
Cash-on-Cash Return
2.8%
Cap rate
0.7%
Rent to Value Ratio
Active
$4,295,000
3
bds
|
6
ba
|
3,546
sqft
|
built
1998
18 Sabal Island Dr, Ocean Ridge, FL 33435
$-20,652
Cash flow
-25.1%
Cash-on-Cash Return
0.4%
Cap rate
0.2%
Rent to Value Ratio
Active
$739,000
4
bds
|
2
ba
|
1,608
sqft
|
built
1977
9674 Dogwood Ave, Palm Beach Gardens, FL 33410
$-1,538
Cash flow
-10.9%
Cash-on-Cash Return
3.7%
Cap rate
0.5%
Rent to Value Ratio
Active
$505,000
4
bds
|
3
ba
|
1,821
sqft
|
built
1999
21090 Via Eden, Boca Raton, FL 33433
$-837
Cash flow
-8.6%
Cash-on-Cash Return
4.2%
Cap rate
0.7%
Rent to Value Ratio
Active
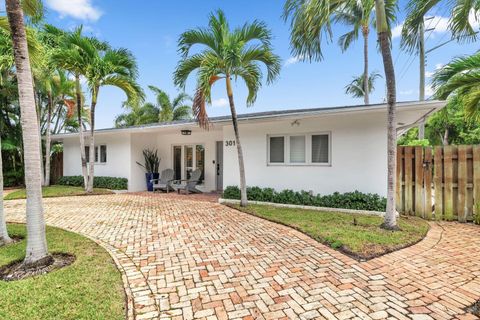
$1,650,000
3
bds
|
2
ba
|
1,626
sqft
|
built
1957
301 Edgewood Dr, West Palm Beach, FL 33405
$-4,472
Cash flow
-14.1%
Cash-on-Cash Return
2.9%
Cap rate
0.4%
Rent to Value Ratio
Active
$485,000
3
bds
|
3
ba
|
1,826
sqft
|
built
2023
4828 Chantilly Rd, Lake Worth, FL 33467
$-1,181
Cash flow
-12.7%
Cash-on-Cash Return
3.2%
Cap rate
0.7%
Rent to Value Ratio
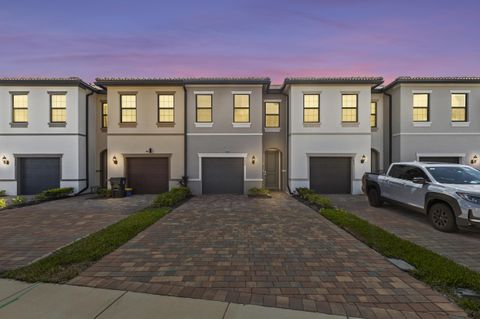
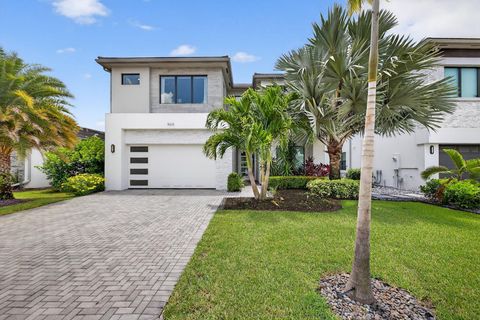
Active
$769,000
4
bds
|
4
ba
|
2,583
sqft
|
built
2019
3252 Dunning Dr, Royal Palm Beach, FL 33411
$-1,286
Cash flow
-8.7%
Cash-on-Cash Return
4.1%
Cap rate
0.7%
Rent to Value Ratio
Active
$279,900
2
bds
|
3
ba
|
1,262
sqft
|
built
1980
5203 Waterview Cir, Palm Springs, FL 33461
$-638
Cash flow
-11.9%
Cash-on-Cash Return
3.4%
Cap rate
0.8%
Rent to Value Ratio
Active
$380,000
3
bds
|
3
ba
|
1,389
sqft
|
built
2013
183 Monterey Bay Dr, Boynton Beach, FL 33426
$-1,079
Cash flow
-14.8%
Cash-on-Cash Return
2.7%
Cap rate
0.7%
Rent to Value Ratio
Active
$569,000
3
bds
|
2
ba
|
1,356
sqft
|
built
2001
3185 Capri Rd, Palm Beach Gardens, FL 33410
$-1,058
Cash flow
-9.7%
Cash-on-Cash Return
3.9%
Cap rate
0.6%
Rent to Value Ratio
Active
$245,000
1
bds
|
1
ba
|
746
sqft
|
built
1989
1120 Lake Shore Dr, Lake Park, FL 33403
$-876
Cash flow
-18.7%
Cash-on-Cash Return
1.9%
Cap rate
0.7%
Rent to Value Ratio
Active
$550,000
3
bds
|
2
ba
|
1,528
sqft
|
built
1994
13034 Sheridan Ter, Wellington, FL 33414
$-965
Cash flow
-9.2%
Cash-on-Cash Return
4.0%
Cap rate
0.6%
Rent to Value Ratio
Active
$1,115,000
4
bds
|
3
ba
|
2,407
sqft
|
built
1999
9525 Cross Creek Dr, Boynton Beach, FL 33436
$-3,098
Cash flow
-14.5%
Cash-on-Cash Return
2.8%
Cap rate
0.4%
Rent to Value Ratio
Active
$399,000
3
bds
|
2
ba
|
1,502
sqft
|
built
1996
152 Sandy Ln, Royal Palm Beach, FL 33411
$-633
Cash flow
-8.3%
Cash-on-Cash Return
4.2%
Cap rate
0.7%
Rent to Value Ratio
Active
$349,900
2
bds
|
2
ba
|
1,170
sqft
|
built
1978
5600 N Flagler Dr, West Palm Beach, FL 33407
$-1,654
Cash flow
-24.7%
Cash-on-Cash Return
0.5%
Cap rate
0.8%
Rent to Value Ratio
Active
$549,000
2
bds
|
2
ba
|
1,458
sqft
|
built
1948
1714 N Palmway, Lake Worth, FL 33460
$-871
Cash flow
-8.3%
Cash-on-Cash Return
4.2%
Cap rate
0.7%
Rent to Value Ratio
Active
$1,795,000
4
bds
|
5
ba
|
2,996
sqft
|
built
1991
6039 NW 31st Ter, Boca Raton, FL 33496
$-5,431
Cash flow
-15.8%
Cash-on-Cash Return
2.5%
Cap rate
0.4%
Rent to Value Ratio
Active
$2,300,000
5
bds
|
6
ba
|
3,807
sqft
|
built
2020
8618 Tower Bridge Ct, Boca Raton, FL 33496
$-7,181
Cash flow
-16.3%
Cash-on-Cash Return
2.4%
Cap rate
0.4%
Rent to Value Ratio