Palm Beach County Investment Properties for Sale
Browse homes for sale and investment properties in Palm Beach County. Refine your search by price, property type, or more.
Best cash flowing properties in Palm Beach County
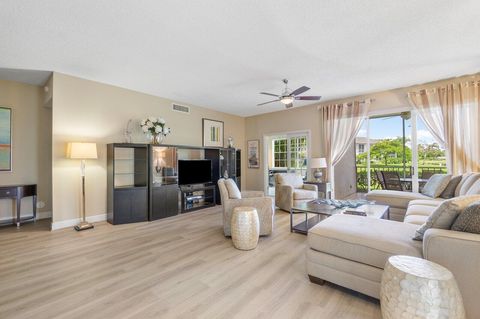
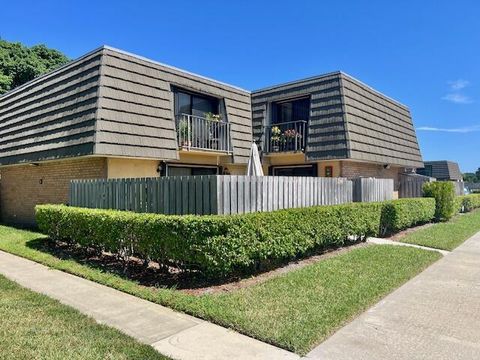
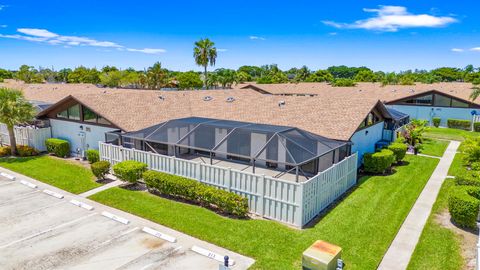
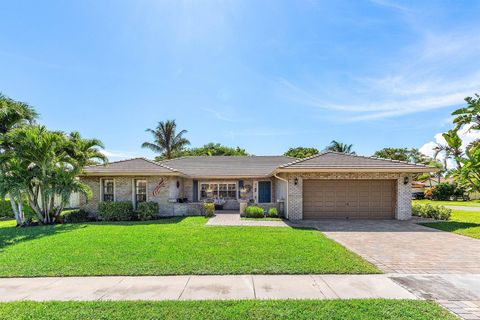
Active
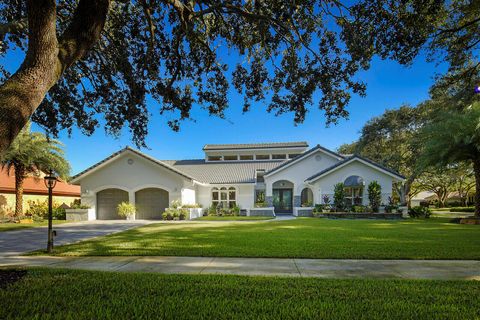
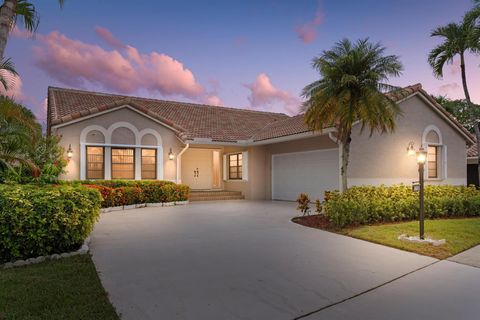
$599,000
3
bds
|
2
ba
|
1,751
sqft
|
built
1989
5070 Lake Catalina Dr, Boca Raton, FL 33496
$1,574
Cash flow
13.7%
Cash-on-Cash Return
9.3%
Cap rate
1.3%
Rent to Value Ratio
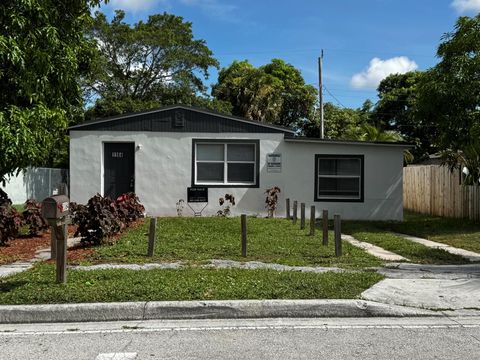
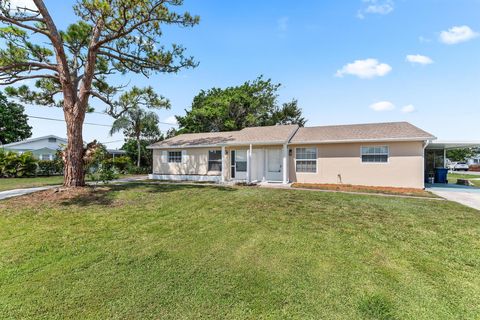
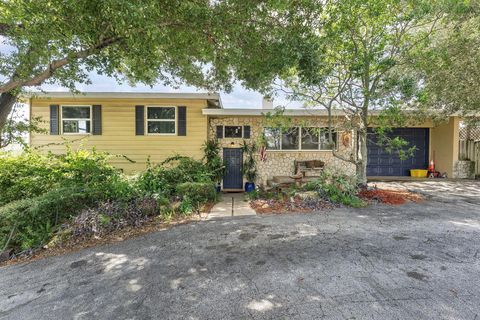
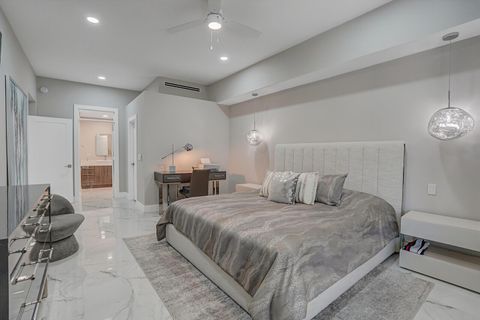
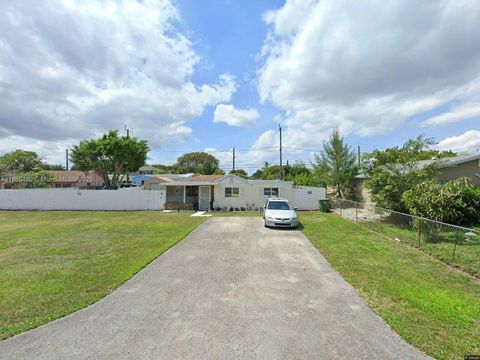
Active
$325,000
3
bds
|
2
ba
|
1,269
sqft
|
built
1958
1164 W 31st St, Riviera Beach, FL 33404
$113
Cash flow
1.8%
Cash-on-Cash Return
6.6%
Cap rate
0.9%
Rent to Value Ratio
5,554 out of 6,739 properties for sale in Palm Beach County
Limited Results Shown
Create a free account, or log in to reveal all property listings and enjoy the complete experience.
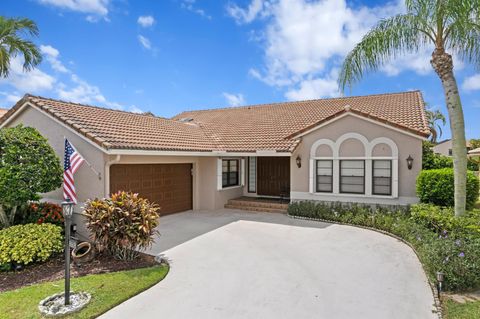
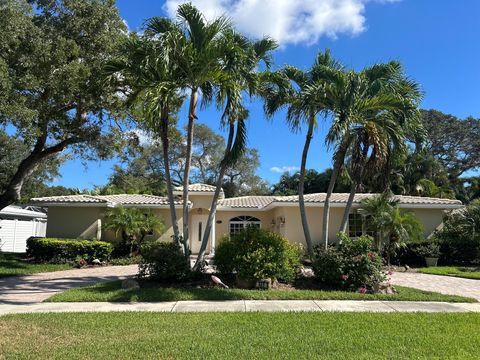
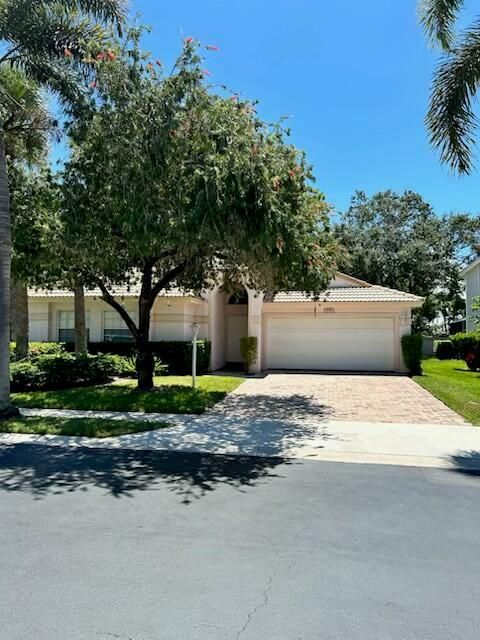
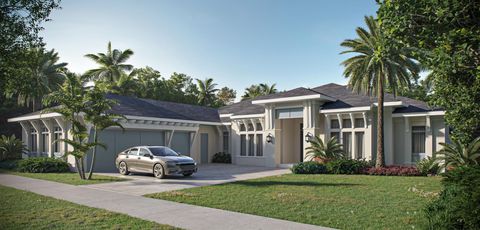
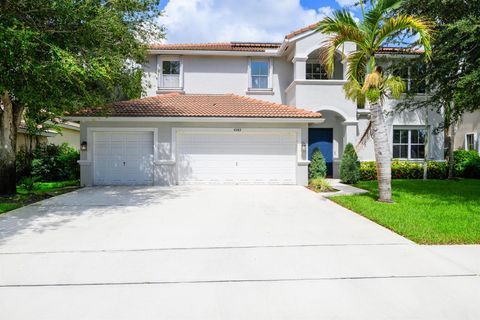
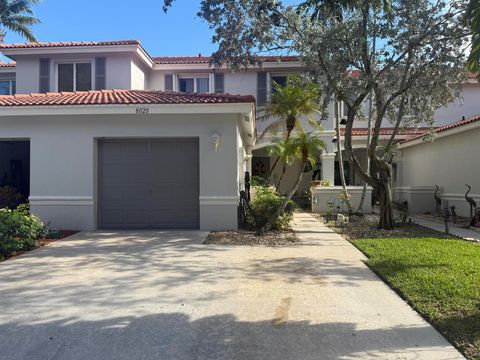
Active
$625,000
3
bds
|
2
ba
|
1,986
sqft
|
built
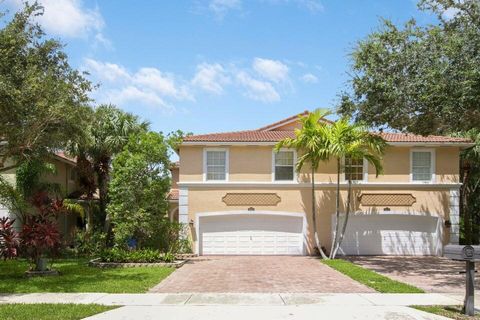
1987
8668 Eagle Run Dr, Boca Raton, FL 33434
$-1,344
Cash flow
-11.2%
Cash-on-Cash Return
3.6%
Cap rate
0.6%
Rent to Value Ratio
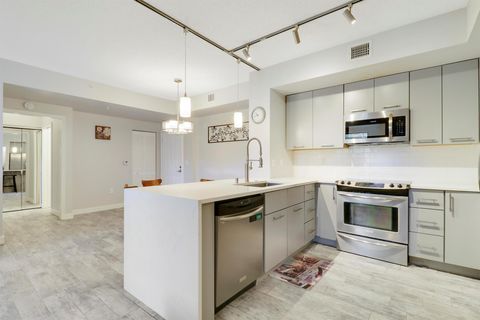
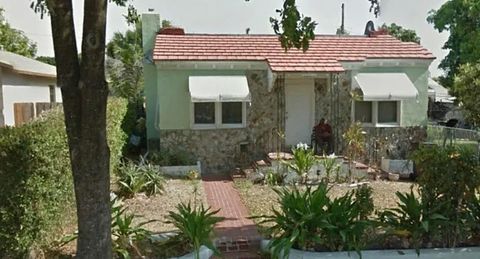
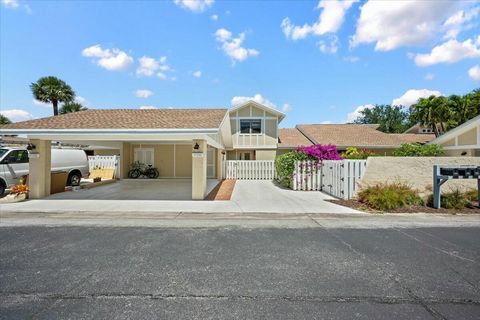
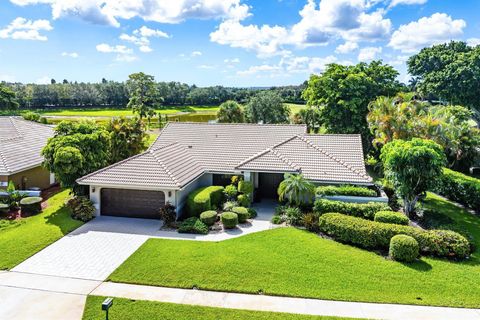
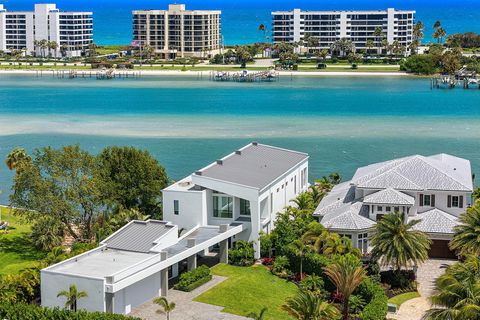
Active
$535,000
2
bds
|
2
ba
|
1,120
sqft
|
built
2001
720 S Sapodilla Ave, West Palm Beach, FL 33401
$-2,235
Cash flow
-21.8%
Cash-on-Cash Return
1.1%
Cap rate
0.5%
Rent to Value Ratio
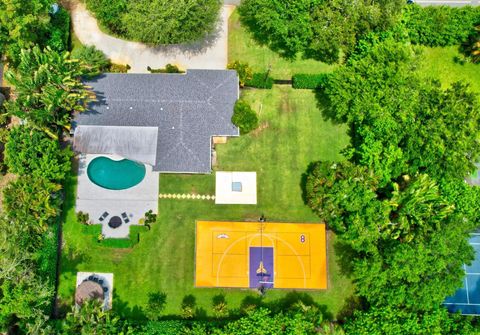
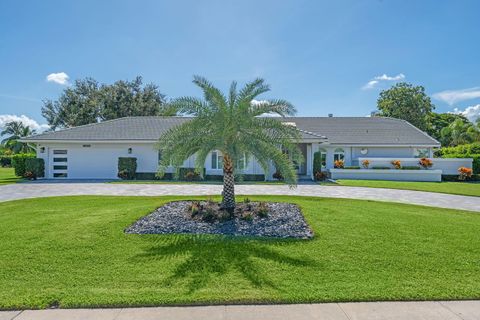
Active
$669,000
3
bds
|
2
ba
|
2,008
sqft
|
built
1981
6560 Las Flores Dr, Boca Raton, FL 33433
$-1,841
Cash flow
-14.4%
Cash-on-Cash Return
2.8%
Cap rate
0.5%
Rent to Value Ratio
Active
$650,000
3
bds
|
3
ba
|
1,725
sqft
|
built
1985
5535 Eton Ct, Boca Raton, FL 33486
$-1,256
Cash flow
-10.1%
Cash-on-Cash Return
3.8%
Cap rate
0.6%
Rent to Value Ratio
Active
$749,000
3
bds
|
2
ba
|
2,142
sqft
|
built
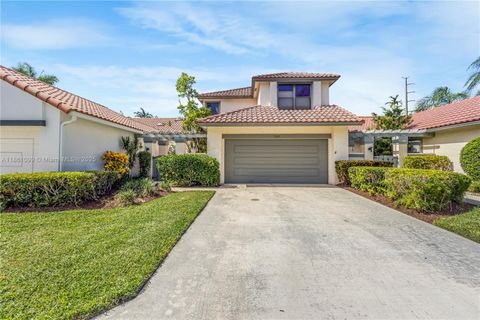
1990
6296 Via Palladium, Boca Raton, FL 33433
$-1,737
Cash flow
-12.1%
Cash-on-Cash Return
3.4%
Cap rate
0.5%
Rent to Value Ratio
Active
$520,000
3
bds
|
3
ba
|
1,774
sqft
|
built
2005
9205 Villa Palma Ln, West Palm Beach, FL 33418
$-957
Cash flow
-9.6%
Cash-on-Cash Return
3.9%
Cap rate
0.7%
Rent to Value Ratio
Active
$475,000
2
bds
|
2
ba
|
1,008
sqft
|
built
1972
200 E Royal Palm Rd, Boca Raton, FL 33432
$-1,700
Cash flow
-18.7%
Cash-on-Cash Return
1.9%
Cap rate
0.7%
Rent to Value Ratio
Active
$799,000
2
bds
|
2
ba
|
1,400
sqft
|
built
1997
3594 S Ocean Blvd, Highland Beach, FL 33487
$-2,675
Cash flow
-17.5%
Cash-on-Cash Return
2.1%
Cap rate
0.6%
Rent to Value Ratio
Active
$325,000
2
bds
|
2
ba
|
943
sqft
|
built
1977
227 Castlewood Dr, North Palm Beach, FL 33408
$-903
Cash flow
-14.5%
Cash-on-Cash Return
2.8%
Cap rate
0.7%
Rent to Value Ratio
Active
$439,000
2
bds
|
2
ba
|
1,064
sqft
|
built
2008
4905 Midtown Ln, Palm Beach Gardens, FL 33418
$-1,019
Cash flow
-12.1%
Cash-on-Cash Return
3.4%
Cap rate
0.7%
Rent to Value Ratio
Active
$424,900
3
bds
|
3
ba
|
1,628
sqft
|
built
2001
4872 Pinemore Ln, Lake Worth, FL 33463
$-712
Cash flow
-8.7%
Cash-on-Cash Return
4.1%
Cap rate
0.7%
Rent to Value Ratio
Active
$671,000
3
bds
|
3
ba
|
2,164
sqft
|
built
2007
8305 NW 8th Ter, Boca Raton, FL 33487
$-1,659
Cash flow
-12.9%
Cash-on-Cash Return
3.2%
Cap rate
0.6%
Rent to Value Ratio
Active
$234,999
3
bds
|
2
ba
|
1,578
sqft
|
built
1995
5135 Floria Dr, Boynton Beach, FL 33437
$-378
Cash flow
-8.4%
Cash-on-Cash Return
4.2%
Cap rate
1.1%
Rent to Value Ratio
Active
$79,000
2
bds
|
2
ba
|
1,429
sqft
|
built
1981
28 Stratford Ln W, Boynton Beach, FL 33436
$-401
Cash flow
-26.5%
Cash-on-Cash Return
0.1%
Cap rate
2.5%
Rent to Value Ratio
Active
$1,695,000
4
bds
|
3
ba
|
2,586
sqft
|
built
1986
2155 Rabbit Hollowe Cir, Delray Beach, FL 33445
$-5,629
Cash flow
-17.3%
Cash-on-Cash Return
2.2%
Cap rate
0.3%
Rent to Value Ratio
Active
$414,900
2
bds
|
1
ba
|
1,013
sqft
|
built
1971
308 Stillwater Dr, Jupiter, FL 33458
$-784
Cash flow
-9.9%
Cash-on-Cash Return
3.9%
Cap rate
0.6%
Rent to Value Ratio
Active
$875,000
3
bds
|
2
ba
|
1,407
sqft
|
built
1960
645 SW 5th St, Boca Raton, FL 33486
$-2,338
Cash flow
-13.9%
Cash-on-Cash Return
2.9%
Cap rate
0.4%
Rent to Value Ratio
Active
$475,000
5
bds
|
1
ba
|
1,798
sqft
|
built
1926
833 30th Ct, West Palm Beach, FL 33407
$-983
Cash flow
-10.8%
Cash-on-Cash Return
3.7%
Cap rate
0.6%
Rent to Value Ratio
Active
$270,000
2
bds
|
3
ba
|
1,236
sqft
|
built
1983
201 2nd Way, West Palm Beach, FL 33407
$-775
Cash flow
-15.0%
Cash-on-Cash Return
2.7%
Cap rate
0.9%
Rent to Value Ratio
Active
$850,000
4
bds
|
2
ba
|
2,046
sqft
|
built
1998
208 Jones Creek Dr, Jupiter, FL 33458
$-1,778
Cash flow
-10.9%
Cash-on-Cash Return
3.6%
Cap rate
0.5%
Rent to Value Ratio
Active
$730,000
4
bds
|
3
ba
|
1,586
sqft
|
built
1981
17210 Fownes Cres, Jupiter, FL 33477
$-2,510
Cash flow
-17.9%
Cash-on-Cash Return
2.0%
Cap rate
0.5%
Rent to Value Ratio
Active
$985,000
3
bds
|
3
ba
|
1,882
sqft
|
built
1958
351 Homewood Blvd, Delray Beach, FL 33445
$-486
Cash flow
-2.6%
Cash-on-Cash Return
5.6%
Cap rate
0.8%
Rent to Value Ratio
Active
$175,000
1
bds
|
1
ba
|
627
sqft
|
built
1984
639 Executive Center Dr, West Palm Beach, FL 33401
$-417
Cash flow
-12.4%
Cash-on-Cash Return
3.3%
Cap rate
0.9%
Rent to Value Ratio
Active
$800,088
3
bds
|
4
ba
|
1,749
sqft
|
built
2007
2640 Lake Shore Dr, Riviera Beach, FL 33404
$-2,527
Cash flow
-16.5%
Cash-on-Cash Return
2.4%
Cap rate
0.8%
Rent to Value Ratio
Active
$685,000
2
bds
|
2
ba
|
1,891
sqft
|
built
2015
3011 Strada Ct, Royal Palm Beach, FL 33411
$-1,316
Cash flow
-10.0%
Cash-on-Cash Return
3.8%
Cap rate
0.5%
Rent to Value Ratio
Active
$515,000
2
bds
|
2
ba
|
1,071
sqft
|
built
2001
1801 N Flagler Dr, West Palm Beach, FL 33407
$-1,950
Cash flow
-19.8%
Cash-on-Cash Return
1.6%
Cap rate
0.6%
Rent to Value Ratio
Active
$650,000
3
bds
|
2
ba
|
1,986
sqft
|
built
1987
8681 Eagle Run Dr, Boca Raton, FL 33434
$-1,479
Cash flow
-11.9%
Cash-on-Cash Return
3.4%
Cap rate
0.6%
Rent to Value Ratio
Active
$700,000
4
bds
|
3
ba
|
2,457
sqft
|
built
1961
116 SE 28th Ave, Boynton Beach, FL 33435
$-1,521
Cash flow
-11.3%
Cash-on-Cash Return
3.5%
Cap rate
0.6%
Rent to Value Ratio
Active
$3,999,000
4
bds
|
5
ba
|
3,907
sqft
|
built
2026
4915 King Palm Cir, Boynton Beach, FL 33436
$-16,510
Cash flow
-21.5%
Cash-on-Cash Return
1.2%
Cap rate
0.2%
Rent to Value Ratio
Active
$699,000
3
bds
|
2
ba
|
2,018
sqft
|
built
1986
11434 Boca Woods Ln, Boca Raton, FL 33428
$-1,078
Cash flow
-8.0%
Cash-on-Cash Return
4.3%
Cap rate
0.7%
Rent to Value Ratio
Active
$450,000
3
bds
|
2
ba
|
1,276
sqft
|
built
1985
9843 Boca Gardens Trl, Boca Raton, FL 33496
$-989
Cash flow
-11.5%
Cash-on-Cash Return
3.5%
Cap rate
0.7%
Rent to Value Ratio
Active
$349,000
3
bds
|
2
ba
|
1,807
sqft
|
built
1995
10185 Andover Coach Cir, Wellington, FL 33449
$-853
Cash flow
-12.8%
Cash-on-Cash Return
3.2%
Cap rate
1.0%
Rent to Value Ratio
Active
$817,000
5
bds
|
3
ba
|
2,673
sqft
|
built
2002
6283 Shadow Tree Ln, Lake Worth, FL 33463
$-2,109
Cash flow
-13.5%
Cash-on-Cash Return
3.0%
Cap rate
0.6%
Rent to Value Ratio
Active
$10,450,000
5
bds
|
6
ba
|
4,550
sqft
|
built
2022
3445 Harbor Rd N, Jupiter, FL 33469
$-54,817
Cash flow
-27.4%
Cash-on-Cash Return
-0.1%
Cap rate
0.1%
Rent to Value Ratio
Active
$379,900
3
bds
|
3
ba
|
1,571
sqft
|
built
2003
8020 Big Pine Way, Riviera Beach, FL 33407
$-786
Cash flow
-10.8%
Cash-on-Cash Return
3.7%
Cap rate
0.7%
Rent to Value Ratio
Active
$475,000
2
bds
|
1
ba
|
551
sqft
|
built
1939
3781 Riedel Ave, Palm Springs, FL 33461
$-1,382
Cash flow
-15.2%
Cash-on-Cash Return
2.7%
Cap rate
0.4%
Rent to Value Ratio
Active
$869,000
3
bds
|
2
ba
|
2,185
sqft
|
built
1982
21911 Satinwood Dr, Boca Raton, FL 33428
$-1,756
Cash flow
-10.5%
Cash-on-Cash Return
3.7%
Cap rate
0.5%
Rent to Value Ratio
Active
$2,495,000
5
bds
|
5
ba
|
4,584
sqft
|
built
1988
21059 Sweetwater Ln N, Boca Raton, FL 33428
$-7,884
Cash flow
-16.5%
Cash-on-Cash Return
2.4%
Cap rate
0.4%
Rent to Value Ratio