Palm Beach County Investment Properties for Sale
Browse homes for sale and investment properties in Palm Beach County. Refine your search by price, property type, or more.
Best cash flowing properties in Palm Beach County

Active
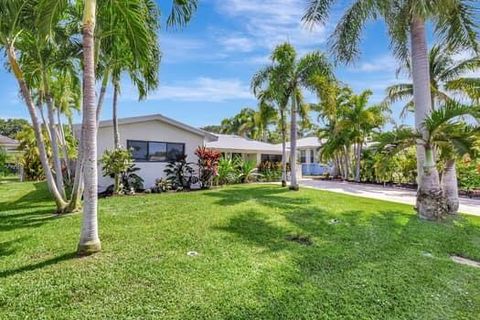
$749,000
3
bds
|
2
ba
|
1,282
sqft
|
built
1964
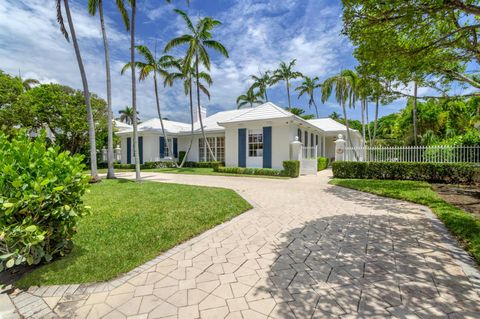
19 Willow Rd, Jupiter, FL 33469
$644
Cash flow
4.5%
Cash-on-Cash Return
7.2%
Cap rate
1.1%
Rent to Value Ratio
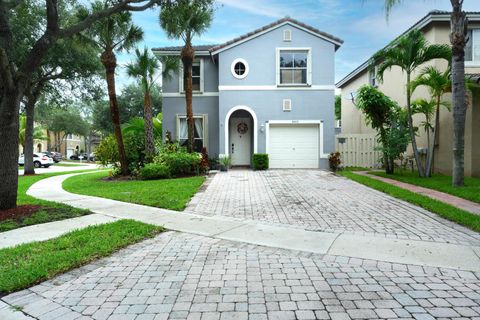
Active
$174,000
3
bds
|
2
ba
|
1,736
sqft
|
built
1997
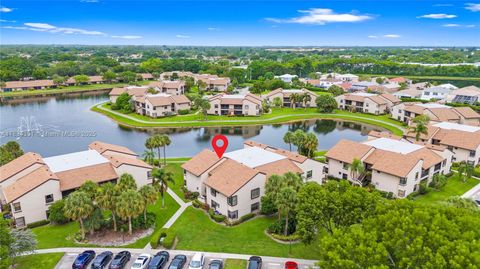
8018 Aberdeen Dr, Boynton Beach, FL 33472
$192
Cash flow
5.8%
Cash-on-Cash Return
7.5%
Cap rate
1.8%
Rent to Value Ratio
5,051 out of 6,122 properties for sale in Palm Beach County
Limited Results Shown
Create a free account, or log in to reveal all property listings and enjoy the complete experience.
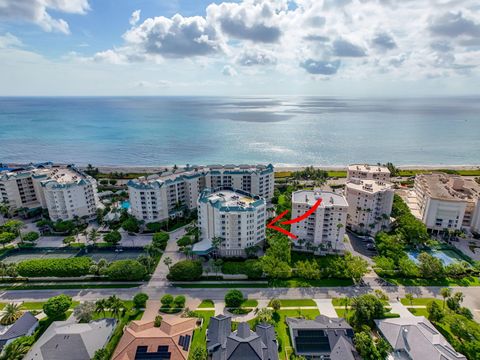
Active
$4,995,000
7
bds
|
9
ba
|
6,907
sqft
|
built
2008
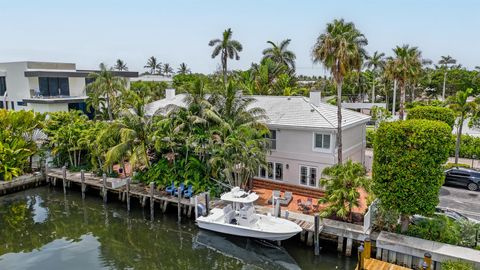
932 Banyan Dr, Delray Beach, FL 33483
$-22,727
Cash flow
-23.7%
Cash-on-Cash Return
0.7%
Cap rate
0.2%
Rent to Value Ratio

Active
$499,000
3
bds
|
2
ba
|
1,368
sqft
|
built
1950
222 Cypress Dr, Lake Park, FL 33403
$-1,210
Cash flow
-12.7%
Cash-on-Cash Return
3.2%
Cap rate
0.6%
Rent to Value Ratio
Active
$850,000
6
bds
|
5
ba
|
4,066
sqft
|
built
2005
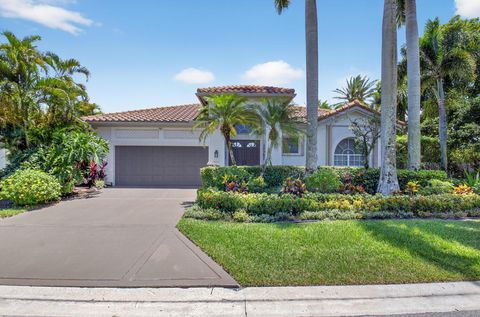
1198 Bay View Way, Wellington, FL 33414
$-1,556
Cash flow
-9.6%
Cash-on-Cash Return
4.0%
Cap rate
0.7%
Rent to Value Ratio

Active
$489,900
3
bds
|
3
ba
|
1,839
sqft
|
built
2002
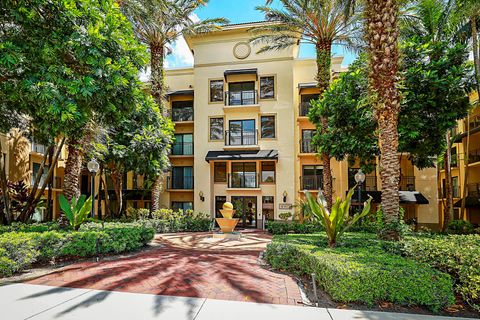
119 Osceola Ln, Jupiter, FL 33458
$-1,067
Cash flow
-11.4%
Cash-on-Cash Return
3.5%
Cap rate
0.7%
Rent to Value Ratio
Active
$1,150,000
3
bds
|
1
ba
|
1,178
sqft
|
built
1925
2118 Florida Ave, West Palm Beach, FL 33401
$-3,234
Cash flow
-14.7%
Cash-on-Cash Return
2.8%
Cap rate
0.4%
Rent to Value Ratio
Active
$339,000
2
bds
|
2
ba
|
1,068
sqft
|
built
2003
616 Clearwater Park Rd, West Palm Beach, FL 33401
$-1,417
Cash flow
-21.8%
Cash-on-Cash Return
1.1%
Cap rate
0.7%
Rent to Value Ratio
Active
$322,000
3
bds
|
2
ba
|
1,515
sqft
|
built
2005
802 W Windward Way, Lantana, FL 33462
$-1,249
Cash flow
-20.2%
Cash-on-Cash Return
1.5%
Cap rate
1.0%
Rent to Value Ratio
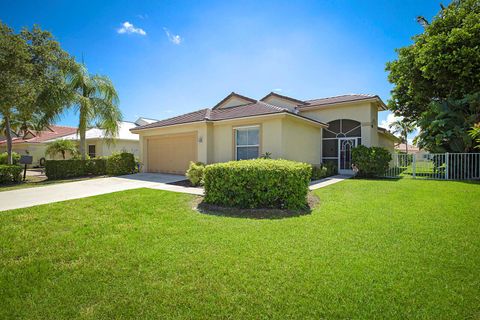
Active
$649,999
4
bds
|
2
ba
|
1,804
sqft
|
built
1981
4619 Coconut Blvd, Royal Palm Beach, FL 33411
$-1,213
Cash flow
-9.7%
Cash-on-Cash Return
3.9%
Cap rate
0.6%
Rent to Value Ratio
Active
$2,195,000
3
bds
|
4
ba
|
2,545
sqft
|
built
2009
200 E Palmetto Park Rd, Boca Raton, FL 33432
$-9,647
Cash flow
-22.9%
Cash-on-Cash Return
0.9%
Cap rate
0.4%
Rent to Value Ratio

Active
$898,980
3
bds
|
3
ba
|
2,561
sqft
|
built
2014
4615 Siena Cir, Wellington, FL 33414
$-1,507
Cash flow
-8.7%
Cash-on-Cash Return
4.1%
Cap rate
0.7%
Rent to Value Ratio
Active
$18,900,000
5
bds
|
5
ba
|
4,237
sqft
|
built
1951
145 Clarendon Ave, Palm Beach, FL 33480
$-108,938
Cash flow
-30.1%
Cash-on-Cash Return
-0.8%
Cap rate
0.0%
Rent to Value Ratio
Active
$2,395,000
3
bds
|
3
ba
|
2,642
sqft
|
built
1987
3486 Lantern Bay Dr, Jupiter, FL 33477
$-9,714
Cash flow
-21.2%
Cash-on-Cash Return
1.3%
Cap rate
0.3%
Rent to Value Ratio
Active
$6,850,000
3
bds
|
4
ba
|
3,118
sqft
|
built
2023
200 Arkona Ct, West Palm Beach, FL 33401
$-41,636
Cash flow
-31.7%
Cash-on-Cash Return
-1.1%
Cap rate
0.1%
Rent to Value Ratio
Active
$299,000
2
bds
|
1
ba
|
780
sqft
|
built
1955
921 32nd St, West Palm Beach, FL 33407
$-149
Cash flow
-2.6%
Cash-on-Cash Return
5.6%
Cap rate
0.8%
Rent to Value Ratio
Active
$485,000
2
bds
|
2
ba
|
1,025
sqft
|
built
2001
651 Okeechobee Blvd, West Palm Beach, FL 33401
$-1,993
Cash flow
-21.4%
Cash-on-Cash Return
1.2%
Cap rate
0.7%
Rent to Value Ratio
Active
$1,575,000
3
bds
|
3
ba
|
1,925
sqft
|
built
1957
110 NW 12th St, Delray Beach, FL 33444
$-3,652
Cash flow
-12.1%
Cash-on-Cash Return
3.4%
Cap rate
0.6%
Rent to Value Ratio
Active
$440,000
3
bds
|
3
ba
|
1,674
sqft
|
built
2003
4043 Lake Tahoe Cir, West Palm Beach, FL 33409
$-1,082
Cash flow
-12.8%
Cash-on-Cash Return
3.2%
Cap rate
0.6%
Rent to Value Ratio
Active
$1,640,000
3
bds
|
4
ba
|
2,490
sqft
|
built
2003
230 Ocean Grande Blvd, Jupiter, FL 33477
$-5,792
Cash flow
-18.4%
Cash-on-Cash Return
1.9%
Cap rate
0.5%
Rent to Value Ratio
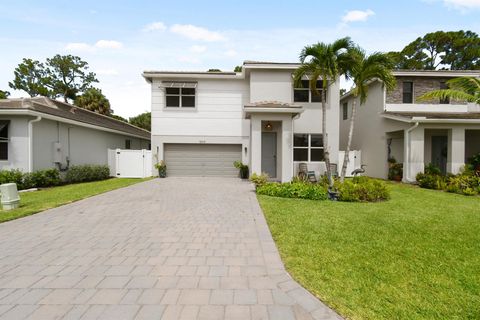
Active
$499,900
3
bds
|
3
ba
|
2,278
sqft
|
built
2014
2061 Foxtail View Ct, Royal Palm Beach, FL 33411
$-815
Cash flow
-8.5%
Cash-on-Cash Return
4.2%
Cap rate
0.8%
Rent to Value Ratio

Active
$299,875
2
bds
|
2
ba
|
1,035
sqft
|
built
2003
106 Lighthouse Cir, Jupiter, FL 33469
$-870
Cash flow
-15.1%
Cash-on-Cash Return
2.7%
Cap rate
0.9%
Rent to Value Ratio
Active
$649,999
4
bds
|
3
ba
|
1,973
sqft
|
built
1992
22488 Overture Cir, Boca Raton, FL 33428
$-1,486
Cash flow
-11.9%
Cash-on-Cash Return
3.4%
Cap rate
0.6%
Rent to Value Ratio
Active
$490,000
3
bds
|
4
ba
|
1,885
sqft
|
built
1998
5524 Boynton Gardens Dr, Boynton Beach, FL 33437
$-1,379
Cash flow
-14.7%
Cash-on-Cash Return
2.8%
Cap rate
0.6%
Rent to Value Ratio
Active
$269,900
2
bds
|
3
ba
|
1,222
sqft
|
built
2006
1224 Lucaya Dr, Riviera Beach, FL 33404
$-581
Cash flow
-11.2%
Cash-on-Cash Return
3.6%
Cap rate
0.9%
Rent to Value Ratio
Active
$574,999
3
bds
|
2
ba
|
2,120
sqft
|
built
1986
187 Bilbao St, Royal Palm Beach, FL 33411
$-728
Cash flow
-6.6%
Cash-on-Cash Return
4.6%
Cap rate
0.6%
Rent to Value Ratio

Active
$1,095,000
3
bds
|
3
ba
|
2,726
sqft
|
built
1991
10791 River Glenn Dr, Boca Raton, FL 33428
$-2,986
Cash flow
-14.2%
Cash-on-Cash Return
2.9%
Cap rate
0.4%
Rent to Value Ratio
Active
$350,000
2
bds
|
2
ba
|
1,442
sqft
|
built
1990
103 Half Moon Cir, Hypoluxo, FL 33462
$-1,419
Cash flow
-21.2%
Cash-on-Cash Return
1.3%
Cap rate
0.7%
Rent to Value Ratio
Active
$2,303,000
4
bds
|
4
ba
|
2,299
sqft
|
built
1955
1455 NE 4th Ave, Boca Raton, FL 33432
$-9,011
Cash flow
-20.4%
Cash-on-Cash Return
1.5%
Cap rate
0.2%
Rent to Value Ratio
Active
$625,000
3
bds
|
2
ba
|
1,627
sqft
|
built
1980
7576 Sierra Ter E, Boca Raton, FL 33433
$-1,719
Cash flow
-14.3%
Cash-on-Cash Return
2.8%
Cap rate
0.6%
Rent to Value Ratio

Active
$379,900
2
bds
|
2
ba
|
1,520
sqft
|
built
2003
11015 Legacy Ln, Palm Beach Gardens, FL 33410
$-1,205
Cash flow
-16.5%
Cash-on-Cash Return
2.3%
Cap rate
0.7%
Rent to Value Ratio
Active
$345,000
2
bds
|
2
ba
|
978
sqft
|
built
1985
8577 Boca Glades Blvd W, Boca Raton, FL 33434
$-843
Cash flow
-12.7%
Cash-on-Cash Return
3.2%
Cap rate
0.7%
Rent to Value Ratio
Active
$1,950,000
3
bds
|
3
ba
|
1,764
sqft
|
built
1988
802 Andrews Ave, Delray Beach, FL 33483
$-5,235
Cash flow
-14.0%
Cash-on-Cash Return
2.9%
Cap rate
0.5%
Rent to Value Ratio
Active
$1,175,000
3
bds
|
3
ba
|
2,521
sqft
|
built
1994
2374 NW 23rd Rd, Boca Raton, FL 33434
$-3,514
Cash flow
-15.6%
Cash-on-Cash Return
2.6%
Cap rate
0.5%
Rent to Value Ratio
Active
$395,000
2
bds
|
2
ba
|
1,001
sqft
|
built
2008
4903 Midtown Ln, Palm Beach Gardens, FL 33418
$-1,084
Cash flow
-14.3%
Cash-on-Cash Return
2.9%
Cap rate
0.7%
Rent to Value Ratio
Active
$539,000
3
bds
|
2
ba
|
1,800
sqft
|
built
1998
6195 Grand Cypress Cir, Lake Worth, FL 33463
$-1,442
Cash flow
-14.0%
Cash-on-Cash Return
2.9%
Cap rate
0.6%
Rent to Value Ratio
Active
$864,950
5
bds
|
3
ba
|
2,720
sqft
|
built
2023
18519 Claybrook St, Jupiter, FL 33458
$-1,596
Cash flow
-9.6%
Cash-on-Cash Return
3.9%
Cap rate
0.6%
Rent to Value Ratio
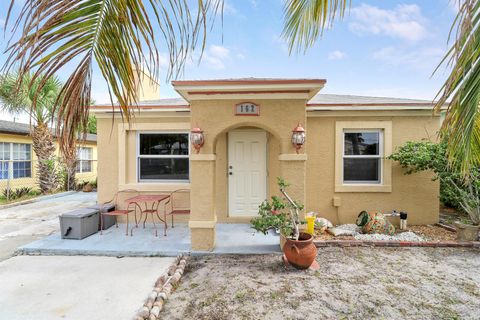
Active
$384,999
3
bds
|
2
ba
|
1,210
sqft
|
built
1956
162 W 24th St, Riviera Beach, FL 33404
$-286
Cash flow
-3.9%
Cash-on-Cash Return
5.3%
Cap rate
0.6%
Rent to Value Ratio
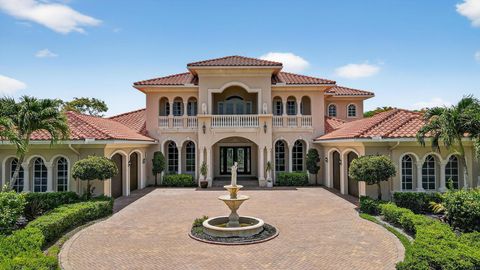
Active
$3,795,000
6
bds
|
8
ba
|
7,805
sqft
|
built
2010
6854 W Calumet Cir, Lake Worth, FL 33467
$-15,730
Cash flow
-21.6%
Cash-on-Cash Return
1.2%
Cap rate
0.3%
Rent to Value Ratio
Active
$635,000
3
bds
|
2
ba
|
1,716
sqft
|
built
1971
7735 Edgewater Dr, Lake Clarke Shores, FL 33406
$-1,256
Cash flow
-10.3%
Cash-on-Cash Return
3.8%
Cap rate
0.6%
Rent to Value Ratio