Will County Investment Properties for Sale
Browse homes for sale and investment properties in Will County. Refine your search by price, property type, or more.
Best cash flowing properties in Will County
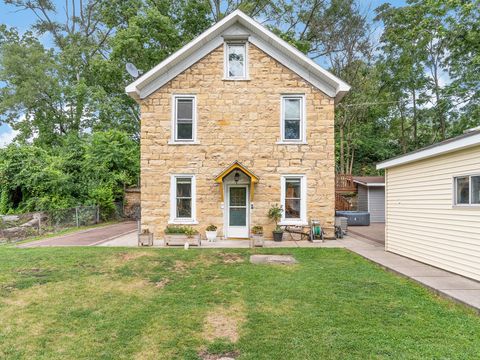
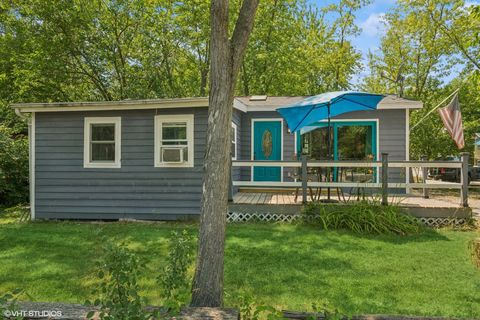
Active
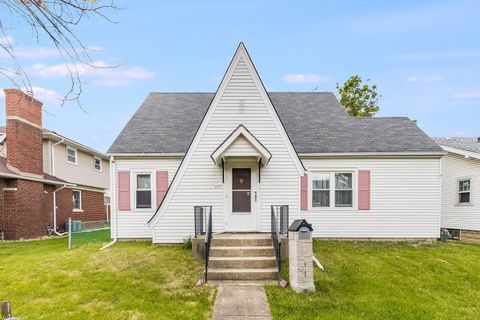
$215,000
3
bds
|
2
ba
|
1,323
sqft
|
built
1944
657 1st St, Crete, IL 60417
$546
Cash flow
13.2%
Cash-on-Cash Return
8.7%
Cap rate
1.2%
Rent to Value Ratio
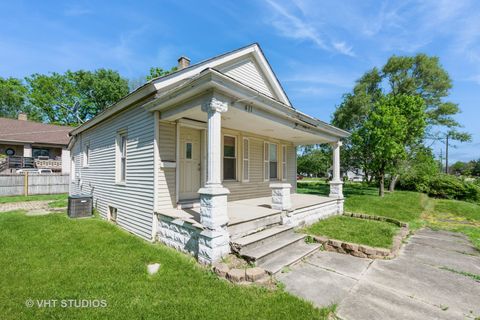
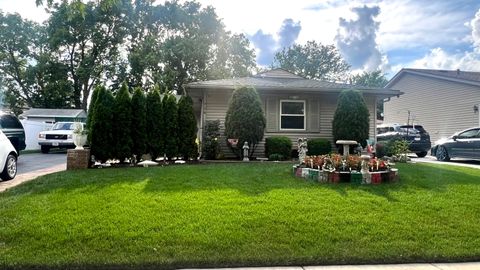
Active
$174,500
2
bds
|
1
ba
|
792
sqft
|
built
1913
411 Pleasant St, Joliet, IL 60436
$348
Cash flow
10.4%
Cash-on-Cash Return
8.1%
Cap rate
1.1%
Rent to Value Ratio
580 out of 665 properties for sale in Will County
Limited Results Shown
Create a free account, or log in to reveal all property listings and enjoy the complete experience.
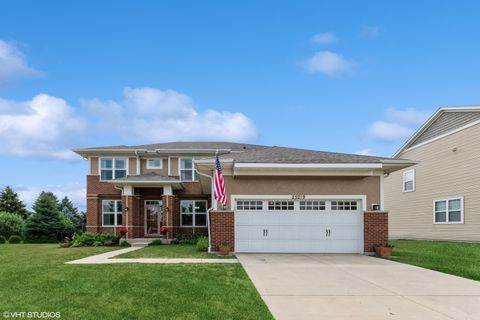
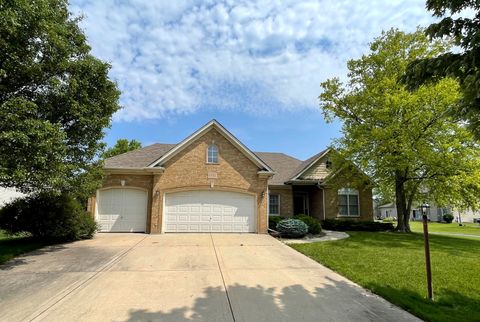
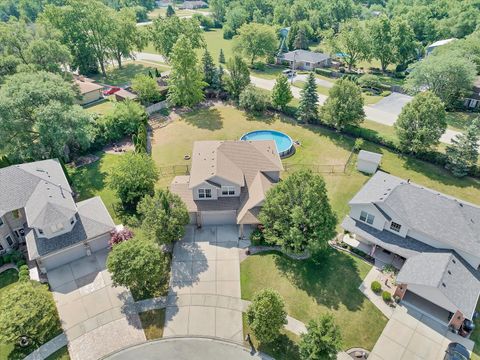
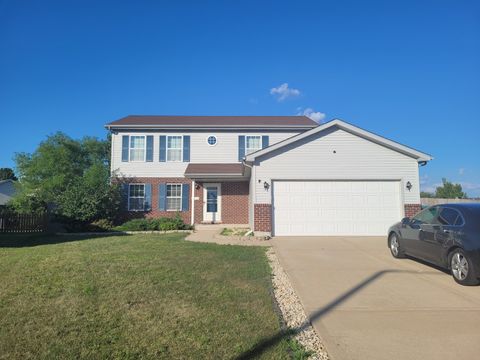
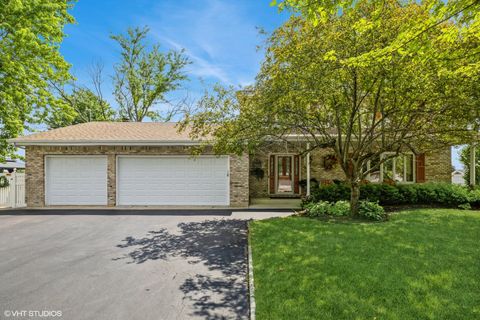
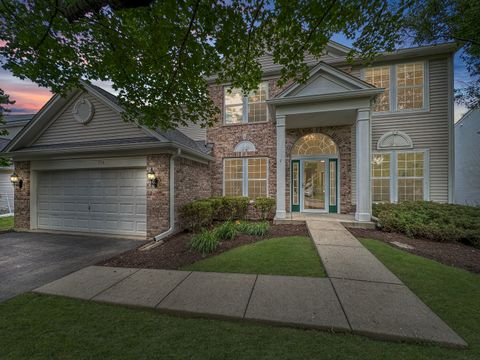
Active
$539,900
4
bds
|
3
ba
|
3,220
sqft
|
built
2012
25219 Bay Tree Cir, Shorewood, IL 60404
$-993
Cash flow
-9.6%
Cash-on-Cash Return
3.5%
Cap rate
0.7%
Rent to Value Ratio
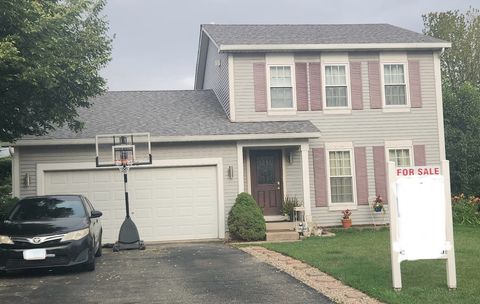
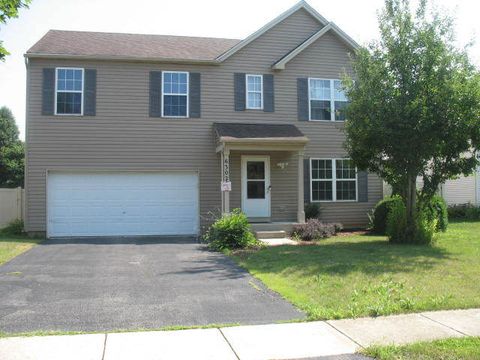
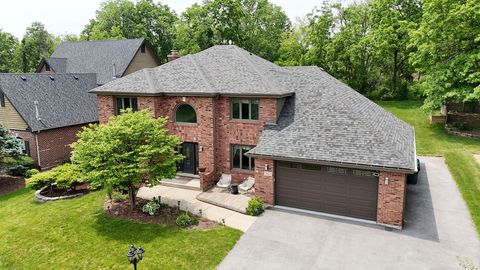
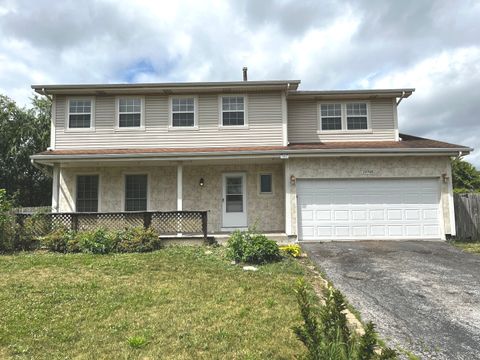
Active
$335,000
3
bds
|
3
ba
|
1,666
sqft
|
built
2003
1695 Evan Ct, Romeoville, IL 60446
$-363
Cash flow
-5.7%
Cash-on-Cash Return
4.4%
Cap rate
0.8%
Rent to Value Ratio
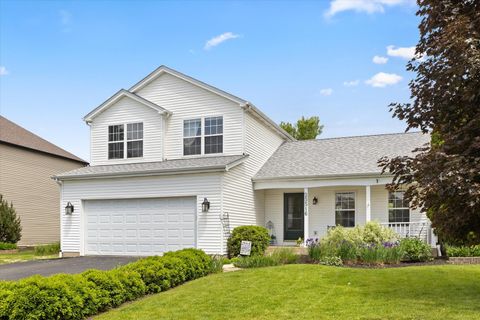
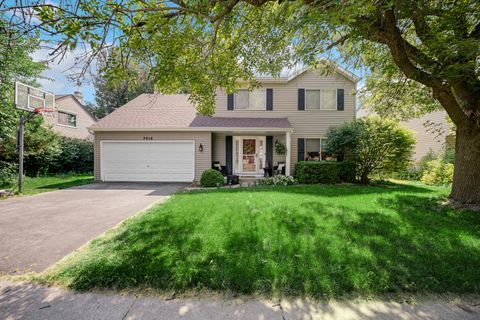
Active
$575,000
3
bds
|
3
ba
|
2,210
sqft
|
built
2005
25022 Steeple Chase Dr, Plainfield, IL 60585
$-1,481
Cash flow
-13.4%
Cash-on-Cash Return
2.6%
Cap rate
0.6%
Rent to Value Ratio
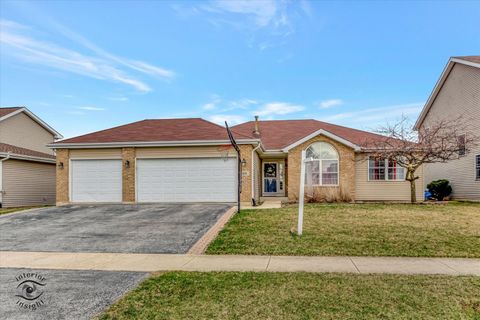
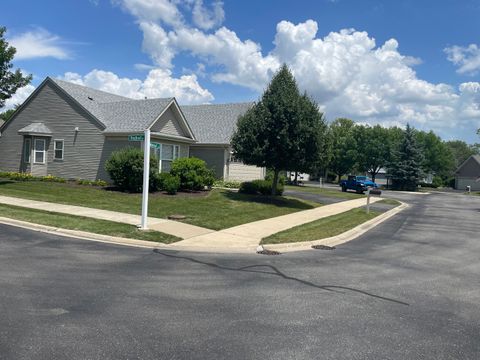
Active
$450,000
4
bds
|
2
ba
|
2,340
sqft
|
built
1989
10752 First Ct, Mokena, IL 60448
$-689
Cash flow
-8.0%
Cash-on-Cash Return
3.8%
Cap rate
0.7%
Rent to Value Ratio
Active
$360,000
3
bds
|
2
ba
|
1,758
sqft
|
built
2003
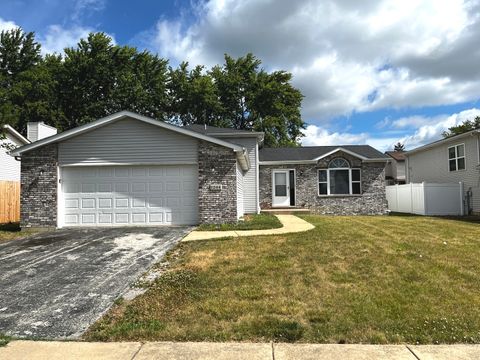
6302 Meadow Ridge Dr, Plainfield, IL 60586
$-367
Cash flow
-5.3%
Cash-on-Cash Return
4.5%
Cap rate
0.8%
Rent to Value Ratio
Active
$299,500
3
bds
|
2
ba
|
2,200
sqft
|
built
2004
325 Hunters Dr, Beecher, IL 60401
$-529
Cash flow
-9.2%
Cash-on-Cash Return
3.6%
Cap rate
0.7%
Rent to Value Ratio
Active
$545,900
4
bds
|
4
ba
|
3,300
sqft
|
built
2002
519 Kingston Dr, New Lenox, IL 60451
$-1,488
Cash flow
-14.2%
Cash-on-Cash Return
2.4%
Cap rate
0.5%
Rent to Value Ratio

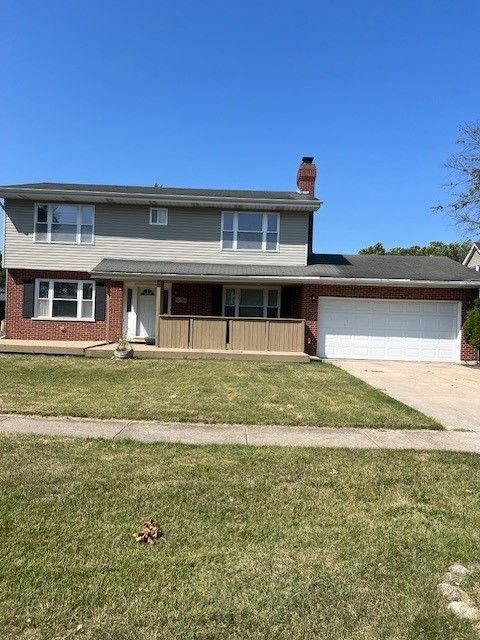
Active
$347,999
4
bds
|
2
ba
|
1,911
sqft
|
built
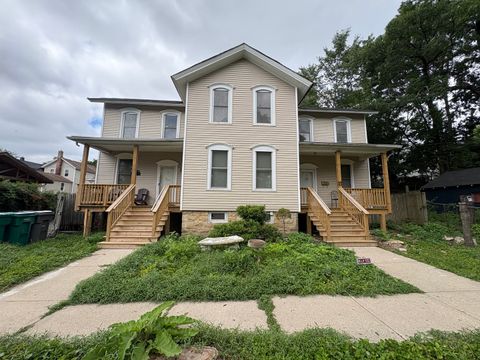
1919
104 Seeser St, Joliet, IL 60436
$-360
Cash flow
-5.4%
Cash-on-Cash Return
4.4%
Cap rate
0.7%
Rent to Value Ratio
Active
$359,000
5
bds
|
2
ba
|
3,395
sqft
|
built
1910
662 Glenwood Ave, Joliet, IL 60435
$-939
Cash flow
-13.6%
Cash-on-Cash Return
2.5%
Cap rate
0.5%
Rent to Value Ratio
Active
$234,900
4
bds
|
2
ba
|
0
sqft
|
built
1908
511 Irving St, Joliet, IL 60432
$109
Cash flow
2.4%
Cash-on-Cash Return
6.2%
Cap rate
0.9%
Rent to Value Ratio
Active
$309,900
3
bds
|
2
ba
|
1,632
sqft
|
built
1942
409 N Reed St, Joliet, IL 60435
$-290
Cash flow
-4.9%
Cash-on-Cash Return
4.6%
Cap rate
0.8%
Rent to Value Ratio
Active
$214,000
4
bds
|
2
ba
|
1,800
sqft
|
built
1900
618 Bush St, Joliet, IL 60433
$77
Cash flow
1.9%
Cash-on-Cash Return
6.1%
Cap rate
0.9%
Rent to Value Ratio
Active
$560,000
4
bds
|
3
ba
|
3,085
sqft
|
built
2004
8057 W Duane Dr, Frankfort, IL 60423
$-1,157
Cash flow
-10.8%
Cash-on-Cash Return
3.2%
Cap rate
0.7%
Rent to Value Ratio
Active
$675,000
5
bds
|
4
ba
|
3,009
sqft
|
built
1993
15022 S Woodcrest Ave, Lockport, IL 60491
$-326
Cash flow
-2.5%
Cash-on-Cash Return
5.1%
Cap rate
0.8%
Rent to Value Ratio
Active
$438,999
3
bds
|
3
ba
|
1,701
sqft
|
built
1998
25516 W Gateway Cir, Plainfield, IL 60585
$-573
Cash flow
-6.8%
Cash-on-Cash Return
4.1%
Cap rate
0.7%
Rent to Value Ratio
Active
$419,900
4
bds
|
2
ba
|
1,902
sqft
|
built
1989
166 N Canyon Dr, Bolingbrook, IL 60490
$-556
Cash flow
-6.9%
Cash-on-Cash Return
4.1%
Cap rate
0.7%
Rent to Value Ratio
Active
$489,900
3
bds
|
2
ba
|
2,465
sqft
|
built
2005
312 Honors Dr, Shorewood, IL 60404
$-1,247
Cash flow
-13.3%
Cash-on-Cash Return
2.6%
Cap rate
0.7%
Rent to Value Ratio
Active
$939,000
4
bds
|
5
ba
|
3,682
sqft
|
built
2000
3316 Tall Grass Dr, Naperville, IL 60564
$-2,486
Cash flow
-13.8%
Cash-on-Cash Return
2.5%
Cap rate
0.5%
Rent to Value Ratio
Active
$259,900
2
bds
|
3
ba
|
1,000
sqft
|
built
1976
613 E 3rd St, Lockport, IL 60441
$-404
Cash flow
-8.1%
Cash-on-Cash Return
3.8%
Cap rate
0.8%
Rent to Value Ratio
Active
$385,000
4
bds
|
3
ba
|
1,973
sqft
|
built
2014
1112 Kim Ct, Joliet, IL 60431
$-668
Cash flow
-9.1%
Cash-on-Cash Return
3.6%
Cap rate
0.7%
Rent to Value Ratio
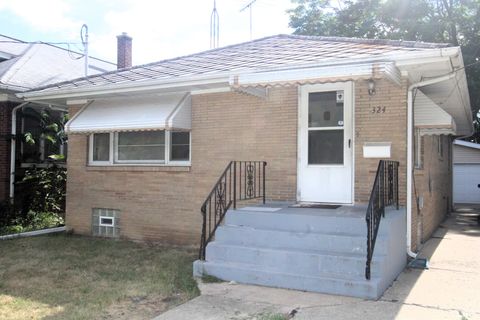
Active
$175,000
2
bds
|
1
ba
|
960
sqft
|
built
1953
324 Illinois St, Joliet, IL 60436
$100
Cash flow
3.0%
Cash-on-Cash Return
6.4%
Cap rate
1.0%
Rent to Value Ratio
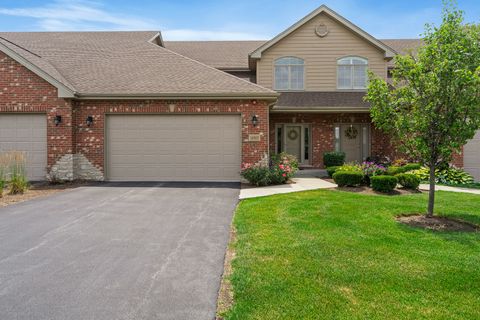
Active
$449,900
3
bds
|
3
ba
|
1,950
sqft
|
built
2018
14903 S Preserve Dr, Lockport, IL 60441
$-792
Cash flow
-9.2%
Cash-on-Cash Return
3.6%
Cap rate
0.8%
Rent to Value Ratio
Active
$344,900
3
bds
|
3
ba
|
1,690
sqft
|
built
2007
24622 George Washington Dr, Plainfield, IL 60544
$-516
Cash flow
-7.8%
Cash-on-Cash Return
3.9%
Cap rate
0.8%
Rent to Value Ratio
Active
$387,900
5
bds
|
3
ba
|
0
sqft
|
built
1996
26253 S Ruby St, Monee, IL 60449
$-446
Cash flow
-6.0%
Cash-on-Cash Return
4.3%
Cap rate
0.8%
Rent to Value Ratio
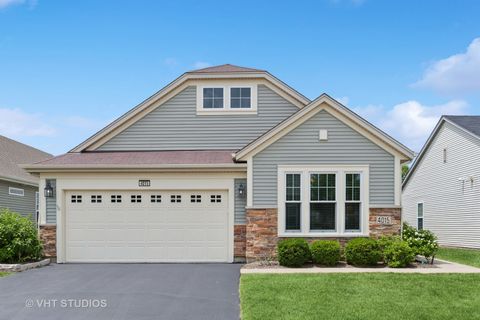
Active
$635,000
2
bds
|
2
ba
|
2,140
sqft
|
built
2014
4015 Chesapeake Ln, Naperville, IL 60564
$-1,676
Cash flow
-13.8%
Cash-on-Cash Return
2.5%
Cap rate
0.6%
Rent to Value Ratio
Active
$310,000
2
bds
|
2
ba
|
1,470
sqft
|
built
1995
2718 Lake Side Cir, Joliet, IL 60431
$-379
Cash flow
-6.4%
Cash-on-Cash Return
4.2%
Cap rate
0.8%
Rent to Value Ratio
Active
$675,000
4
bds
|
3
ba
|
3,150
sqft
|
built
1985
1329 Neskola Ct, Naperville, IL 60564
$-840
Cash flow
-6.5%
Cash-on-Cash Return
4.2%
Cap rate
0.7%
Rent to Value Ratio
Active
$482,000
4
bds
|
4
ba
|
3,918
sqft
|
built
1992
920 Barnside Rd, New Lenox, IL 60451
$-1,158
Cash flow
-12.5%
Cash-on-Cash Return
2.8%
Cap rate
0.6%
Rent to Value Ratio
Active
$385,000
4
bds
|
3
ba
|
1,572
sqft
|
built
1988
19708 S Skye Dr, Frankfort, IL 60423
$-419
Cash flow
-5.7%
Cash-on-Cash Return
4.4%
Cap rate
0.8%
Rent to Value Ratio
Active
$650,000
4
bds
|
3
ba
|
2,377
sqft
|
built
1984
2616 Gateshead Dr, Naperville, IL 60564
$-1,435
Cash flow
-11.5%
Cash-on-Cash Return
3.0%
Cap rate
0.5%
Rent to Value Ratio
Active
$355,000
2
bds
|
2
ba
|
1,431
sqft
|
built
1998
21024 W Walnut Ln, Plainfield, IL 60544
$-481
Cash flow
-7.1%
Cash-on-Cash Return
4.1%
Cap rate
0.6%
Rent to Value Ratio
Active
$291,000
3
bds
|
3
ba
|
3,179
sqft
|
built
1999
1244 Harvest Ln, University Park, IL 60484
$-619
Cash flow
-11.1%
Cash-on-Cash Return
3.1%
Cap rate
0.8%
Rent to Value Ratio
Active
$350,000
3
bds
|
3
ba
|
0
sqft
|
built
1890
17 S Cagwin Ave, Joliet, IL 60436
$-424
Cash flow
-6.3%
Cash-on-Cash Return
4.2%
Cap rate
0.7%
Rent to Value Ratio
Active
$399,900
3
bds
|
2
ba
|
1,850
sqft
|
built
2005
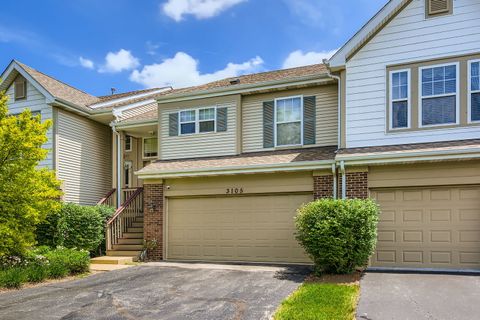
3105 Saganashkee Ln, Naperville, IL 60564
$-887
Cash flow
-11.6%
Cash-on-Cash Return
3.0%
Cap rate
0.7%
Rent to Value Ratio
Active
$157,000
3
bds
|
2
ba
|
0
sqft
|
built
1977
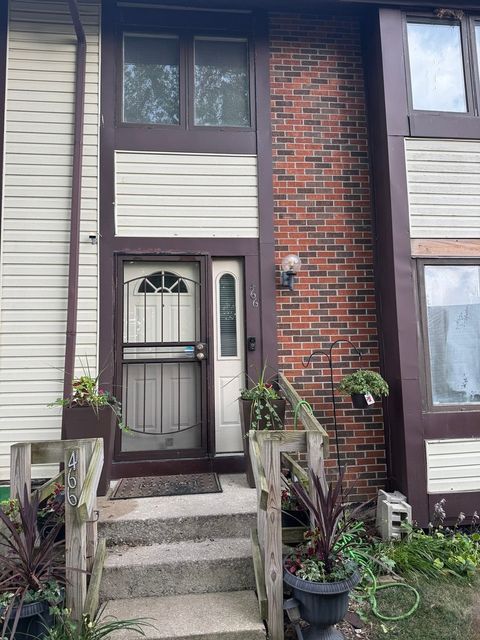
466 Pebble Beach Ct, University Park, IL 60484
$140
Cash flow
4.7%
Cash-on-Cash Return
6.7%
Cap rate
1.1%
Rent to Value Ratio
Active
$179,500
1
bds
|
1
ba
|
600
sqft
|
built
1988
30 Aspen Ln, Wilmington, IL 60481
$-168
Cash flow
-4.9%
Cash-on-Cash Return
4.6%
Cap rate
0.8%
Rent to Value Ratio
Active
$310,000
4
bds
|
1
ba
|
1,606
sqft
|
built
1975
716 Ashton Ave, Romeoville, IL 60446
$-261
Cash flow
-4.4%
Cash-on-Cash Return
4.7%
Cap rate
0.8%
Rent to Value Ratio
Active
$549,900
4
bds
|
3
ba
|
2,470
sqft
|
built
2003
136 Lilac St, Bolingbrook, IL 60490
$-1,325
Cash flow
-12.6%
Cash-on-Cash Return
2.8%
Cap rate
0.7%
Rent to Value Ratio