Norfolk County Investment Properties for Sale
Browse homes for sale and investment properties in Norfolk County. Refine your search by price, property type, or more.
Best cash flowing properties in Norfolk County
Active
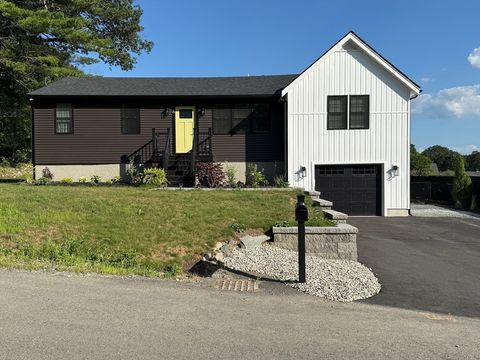
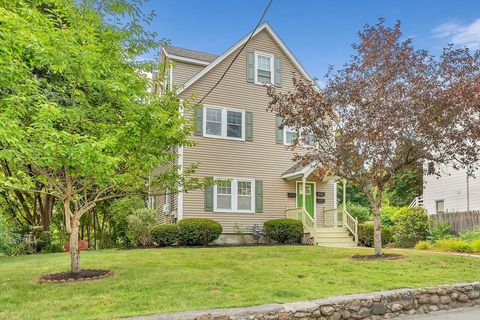
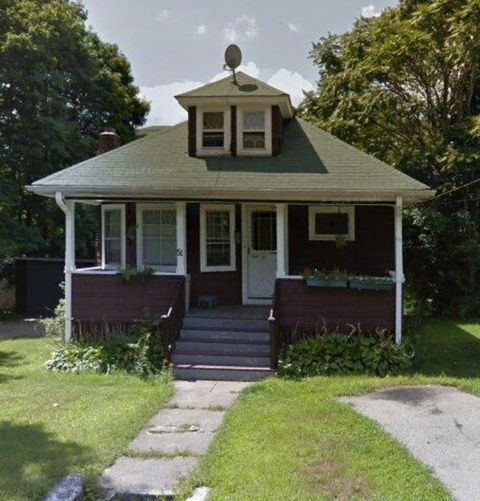
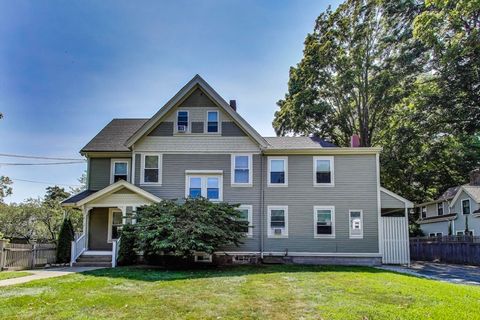
$669,000
3
bds
|
3
ba
|
2,200
sqft
|
built
1953
6 Morse Ave, Plainville, MA 02762
$-338
Cash flow
-2.6%
Cash-on-Cash Return
5.1%
Cap rate
0.7%
Rent to Value Ratio
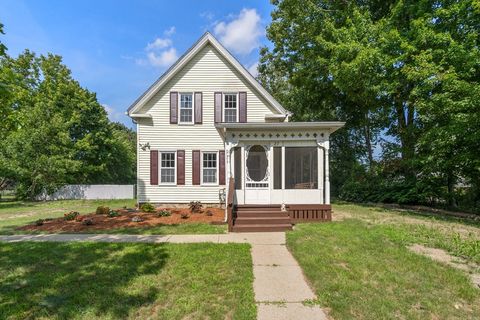
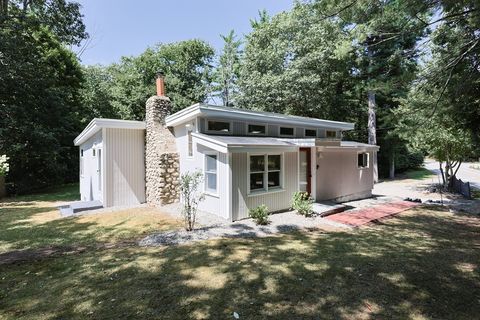
Active
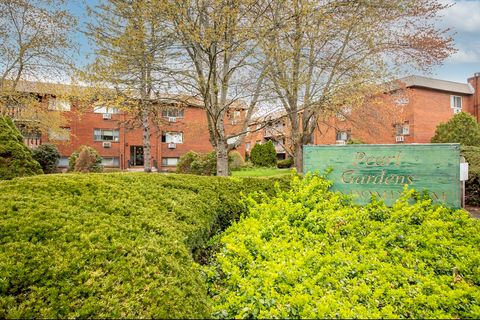
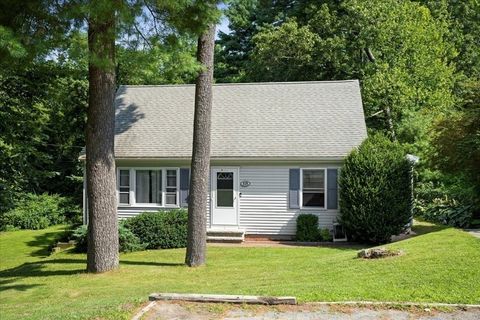
$315,000
2
bds
|
1
ba
|
985
sqft
|
built
1970
26 Faxon St, Stoughton, MA 02072
$-368
Cash flow
-6.1%
Cash-on-Cash Return
4.3%
Cap rate
0.8%
Rent to Value Ratio
356 out of 550 properties for sale in Norfolk County
Limited Results Shown
Create a free account, or log in to reveal all property listings and enjoy the complete experience.
Active
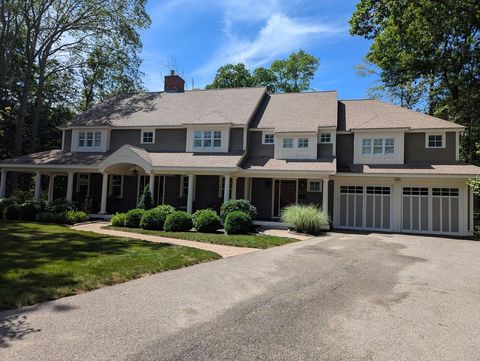
$2,575,800
4
bds
|
5
ba
|
4,559
sqft
|
built
1968
137 Fairoaks Ln, Cohasset, MA 02025
$-8,205
Cash flow
-16.6%
Cash-on-Cash Return
1.9%
Cap rate
0.3%
Rent to Value Ratio
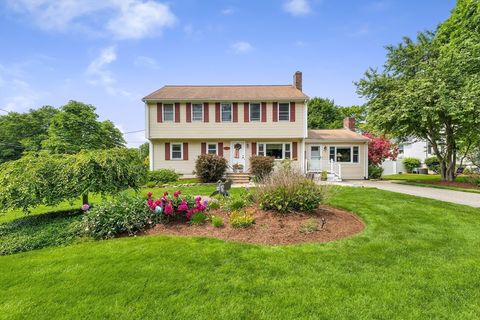
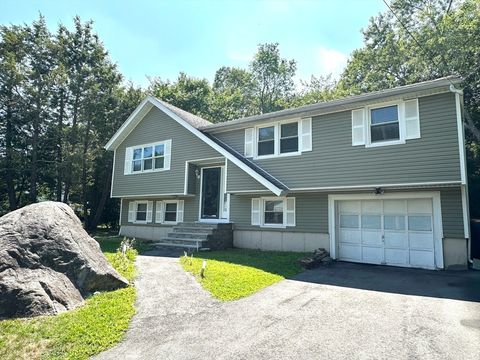
Active
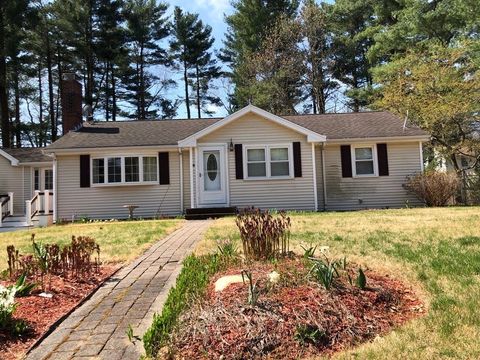
$645,000
3
bds
|
2
ba
|
1,278
sqft
|
built
1950
169 Pond St, Holbrook, MA 02343
$-1,122
Cash flow
-9.1%
Cash-on-Cash Return
3.6%
Cap rate
0.6%
Rent to Value Ratio
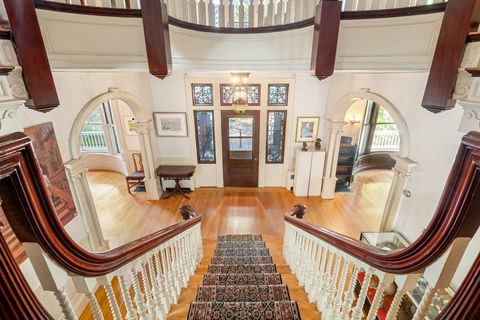
Active
$875,000
5
bds
|
3
ba
|
2,640
sqft
|
built
1900
37 Winter St, Franklin, MA 02038
$-2,449
Cash flow
-14.6%
Cash-on-Cash Return
2.3%
Cap rate
0.4%
Rent to Value Ratio

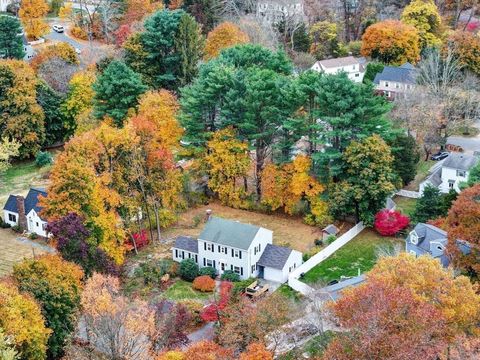
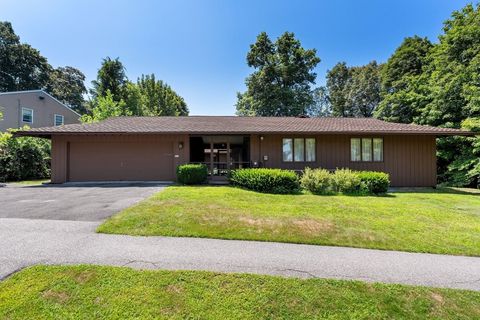
Active
$675,000
3
bds
|
2
ba
|
2,043
sqft
|
built
1979
66 Lakeshore Dr, Norfolk, MA 02056
$-1,268
Cash flow
-9.8%
Cash-on-Cash Return
3.4%
Cap rate
0.6%
Rent to Value Ratio
Active
$625,000
3
bds
|
1
ba
|
1,061
sqft
|
built
1975
570 Franklin St, Wrentham, MA 02093
$-948
Cash flow
-7.9%
Cash-on-Cash Return
3.9%
Cap rate
0.6%
Rent to Value Ratio
Active
$799,900
5
bds
|
3
ba
|
2,622
sqft
|
built
1957
37 Maple St, Medway, MA 02053
$-1,410
Cash flow
-9.2%
Cash-on-Cash Return
3.6%
Cap rate
0.6%
Rent to Value Ratio
Active
$1,090,000
3
bds
|
3
ba
|
1,461
sqft
|
built
1941
60 Warwick Dr, Westwood, MA 02090
$-2,836
Cash flow
-13.6%
Cash-on-Cash Return
2.6%
Cap rate
0.4%
Rent to Value Ratio
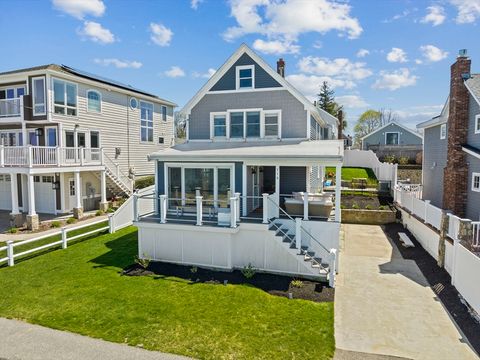
Active
$474,900
2
bds
|
2
ba
|
1,115
sqft
|
built
1986
73 Broad Reach, Weymouth, MA 02191
$-1,239
Cash flow
-13.6%
Cash-on-Cash Return
2.5%
Cap rate
0.7%
Rent to Value Ratio
Active
$449,000
1
bds
|
1
ba
|
557
sqft
|
built
1920
20 Claflin Rd, Brookline, MA 02445
$-501
Cash flow
-5.8%
Cash-on-Cash Return
4.3%
Cap rate
0.6%
Rent to Value Ratio
Active
$800,000
6
bds
|
3
ba
|
1,920
sqft
|
built
1964
7 Oakwood Ave, Randolph, MA 02368
$-1,807
Cash flow
-11.8%
Cash-on-Cash Return
3.0%
Cap rate
0.4%
Rent to Value Ratio
Active
$699,900
3
bds
|
3
ba
|
1,604
sqft
|
built
2016
2 Mitchell Ln, Weymouth, MA 02190
$-1,883
Cash flow
-14.0%
Cash-on-Cash Return
2.5%
Cap rate
0.5%
Rent to Value Ratio
Active
$599,900
1
bds
|
2
ba
|
935
sqft
|
built
1965
60 Longwood Ave, Brookline, MA 02446
$-2,040
Cash flow
-17.7%
Cash-on-Cash Return
1.6%
Cap rate
0.6%
Rent to Value Ratio
Active
$749,900
2
bds
|
1
ba
|
997
sqft
|
built
1984
1731 Beacon St, Brookline, MA 02445
$-1,791
Cash flow
-12.5%
Cash-on-Cash Return
2.8%
Cap rate
0.4%
Rent to Value Ratio
Active
$2,890,000
6
bds
|
6
ba
|
6,735
sqft
|
built
2025
201 Valley Rd, Needham, MA 02492
$-11,319
Cash flow
-20.4%
Cash-on-Cash Return
1.0%
Cap rate
0.2%
Rent to Value Ratio

Active
$280,000
1
bds
|
1
ba
|
680
sqft
|
built
1970
65 Greentree Ln, South Weymouth, MA 02190
$-524
Cash flow
-9.8%
Cash-on-Cash Return
3.4%
Cap rate
0.7%
Rent to Value Ratio
Active
$509,000
2
bds
|
2
ba
|
888
sqft
|
built
1954
35 Rindone St, Holbrook, MA 02343
$-939
Cash flow
-9.6%
Cash-on-Cash Return
3.5%
Cap rate
0.6%
Rent to Value Ratio
Active
$549,000
3
bds
|
1
ba
|
1,104
sqft
|
built
1922
51 Beals St, Weymouth, MA 02191
$-777
Cash flow
-7.4%
Cash-on-Cash Return
4.0%
Cap rate
0.6%
Rent to Value Ratio
Active
$609,900
3
bds
|
2
ba
|
1,701
sqft
|
built
1900
27 Page St, Avon, MA 02322
$-1,305
Cash flow
-11.2%
Cash-on-Cash Return
3.1%
Cap rate
0.5%
Rent to Value Ratio
Active
$1,395,000
4
bds
|
3
ba
|
3,372
sqft
|
built
1971
312 Adams St, Quincy, MA 02169
$-3,481
Cash flow
-13.0%
Cash-on-Cash Return
2.7%
Cap rate
0.4%
Rent to Value Ratio
Active
$999,999
5
bds
|
3
ba
|
3,021
sqft
|
built
1989
41 Filbert St, Quincy, MA 02169
$-2,666
Cash flow
-13.9%
Cash-on-Cash Return
2.5%
Cap rate
0.4%
Rent to Value Ratio
Active
$1,199,000
3
bds
|
3
ba
|
1,790
sqft
|
built
1900
119 Manet Ave, Quincy, MA 02169
$-3,248
Cash flow
-14.1%
Cash-on-Cash Return
2.4%
Cap rate
0.4%
Rent to Value Ratio

Active
$999,900
5
bds
|
3
ba
|
2,464
sqft
|
built
1920
84 Blue Hills Pkwy, Milton, MA 02186
$-1,996
Cash flow
-10.4%
Cash-on-Cash Return
3.3%
Cap rate
0.5%
Rent to Value Ratio
Active
$1,850,000
6
bds
|
5
ba
|
3,351
sqft
|
built
1885
2 Elm St, Wellesley, MA 02481
$-5,169
Cash flow
-14.6%
Cash-on-Cash Return
2.3%
Cap rate
0.4%
Rent to Value Ratio
Active
$639,000
2
bds
|
2
ba
|
1,472
sqft
|
built
1959
183 Mountain St, Sharon, MA 02067
$-1,367
Cash flow
-11.2%
Cash-on-Cash Return
3.1%
Cap rate
0.5%
Rent to Value Ratio
Active
$669,900
4
bds
|
2
ba
|
1,902
sqft
|
built
1969
14 Anderson Dr, Randolph, MA 02368
$-1,261
Cash flow
-9.8%
Cash-on-Cash Return
3.4%
Cap rate
0.5%
Rent to Value Ratio
Active
$2,995,000
8
bds
|
6
ba
|
5,803
sqft
|
built
1900
9 Downing Rd, Brookline, MA 02445
$-10,642
Cash flow
-18.5%
Cash-on-Cash Return
1.4%
Cap rate
0.3%
Rent to Value Ratio
Active
$3,198,000
5
bds
|
4
ba
|
3,648
sqft
|
built
1925
140 Dudley St, Brookline, MA 02445
$-11,847
Cash flow
-19.3%
Cash-on-Cash Return
1.2%
Cap rate
0.3%
Rent to Value Ratio
Active
$1,450,000
4
bds
|
2
ba
|
3,402
sqft
|
built
2003
146 Eleanor Dr, Braintree, MA 02184
$-3,784
Cash flow
-13.6%
Cash-on-Cash Return
2.5%
Cap rate
0.4%
Rent to Value Ratio
Active
$617,500
3
bds
|
2
ba
|
1,828
sqft
|
built
1991
336 Maple St, Franklin, MA 02038
$-978
Cash flow
-8.3%
Cash-on-Cash Return
3.8%
Cap rate
0.6%
Rent to Value Ratio
Active
$524,900
4
bds
|
2
ba
|
1,536
sqft
|
built
1900
60 Pine St, Franklin, MA 02038
$-553
Cash flow
-5.5%
Cash-on-Cash Return
4.4%
Cap rate
0.7%
Rent to Value Ratio

Active
$869,900
4
bds
|
3
ba
|
1,845
sqft
|
built
1938
96 Brook Rd, Milton, MA 02186
$-1,875
Cash flow
-11.2%
Cash-on-Cash Return
3.1%
Cap rate
0.5%
Rent to Value Ratio
Active
$2,999,000
6
bds
|
6
ba
|
6,482
sqft
|
built
2025
59 Henderson St, Needham, MA 02492
$-11,851
Cash flow
-20.6%
Cash-on-Cash Return
0.9%
Cap rate
0.2%
Rent to Value Ratio
Active
$1,279,900
4
bds
|
4
ba
|
5,600
sqft
|
built
2001
9 Tulip Way, Medway, MA 02053
$-2,867
Cash flow
-11.7%
Cash-on-Cash Return
3.0%
Cap rate
0.5%
Rent to Value Ratio
Active
$2,499,000
4
bds
|
4
ba
|
4,621
sqft
|
built
2016
1332 Great Plain Ave, Needham, MA 02492
$-7,959
Cash flow
-16.6%
Cash-on-Cash Return
1.9%
Cap rate
0.3%
Rent to Value Ratio
Active
$1,699,000
2
bds
|
3
ba
|
2,363
sqft
|
built
1988
1001 Marina Dr, Quincy, MA 02171
$-5,893
Cash flow
-18.1%
Cash-on-Cash Return
1.5%
Cap rate
0.5%
Rent to Value Ratio
Active
$799,999
3
bds
|
2
ba
|
1,878
sqft
|
built
1880
68 High St, Randolph, MA 02368
$-1,928
Cash flow
-12.6%
Cash-on-Cash Return
2.8%
Cap rate
0.4%
Rent to Value Ratio
Active
$675,000
3
bds
|
3
ba
|
2,496
sqft
|
built
1923
28 Wilmarth Rd, Randolph, MA 02368
$-981
Cash flow
-7.6%
Cash-on-Cash Return
3.9%
Cap rate
0.6%
Rent to Value Ratio
Active
$2,395,000
5
bds
|
6
ba
|
7,211
sqft
|
built
2009
146 Pine St, Dover, MA 02030
$-8,049
Cash flow
-17.5%
Cash-on-Cash Return
1.6%
Cap rate
0.3%
Rent to Value Ratio