Suffolk County Investment Properties for Sale
Browse homes for sale and investment properties in Suffolk County. Refine your search by price, property type, or more.
Best cash flowing properties in Suffolk County
Active
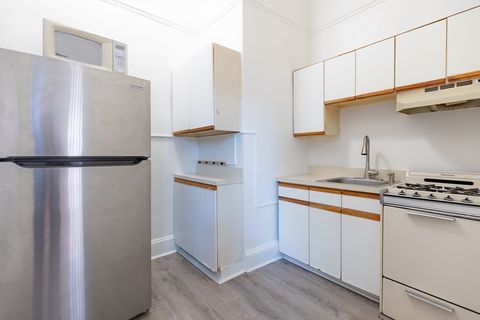
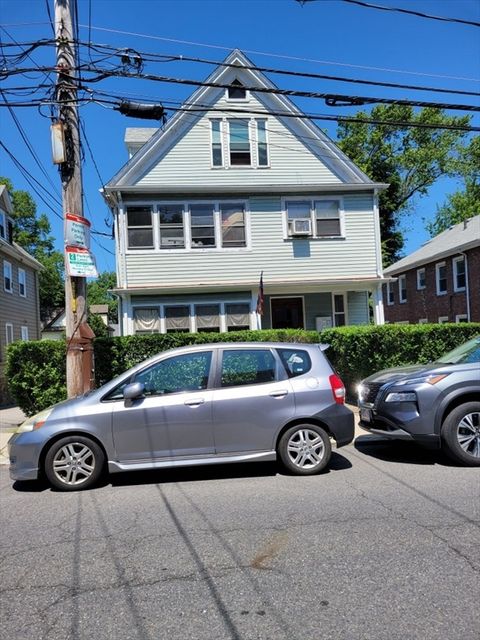
$149,000
1
bds
|
1
ba
|
751
sqft
|
built
2025
10 Franklin Ave, Revere, MA 02151
$336
Cash flow
11.8%
Cash-on-Cash Return
8.4%
Cap rate
1.5%
Rent to Value Ratio
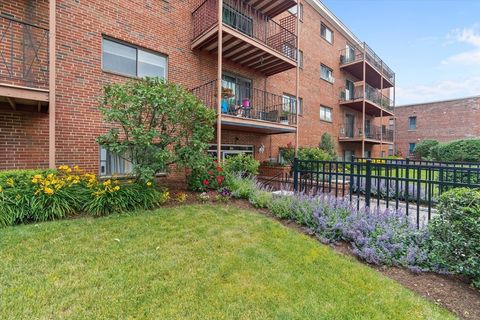
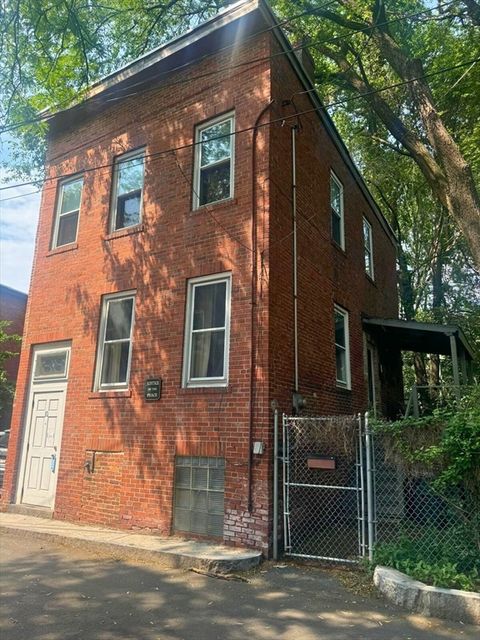
Active
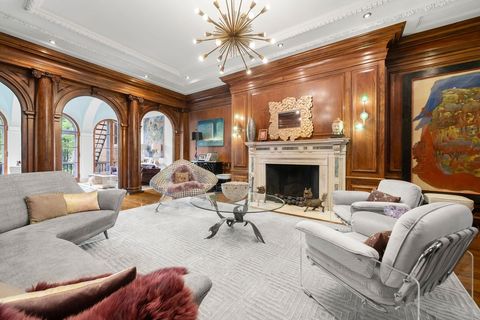
$429,000
1
bds
|
1
ba
|
372
sqft
|
built
1900
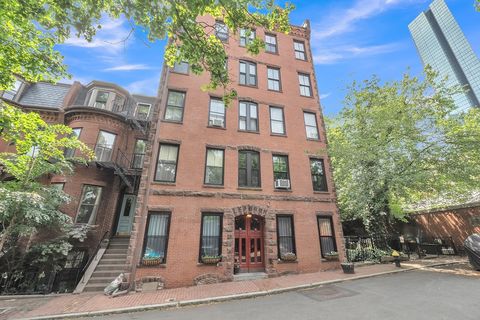
57 Mount Vernon St, Boston, MA 02135
$-839
Cash flow
-10.2%
Cash-on-Cash Return
3.3%
Cap rate
0.5%
Rent to Value Ratio
674 out of 1,170 properties for sale in Suffolk County
Limited Results Shown
Create a free account, or log in to reveal all property listings and enjoy the complete experience.
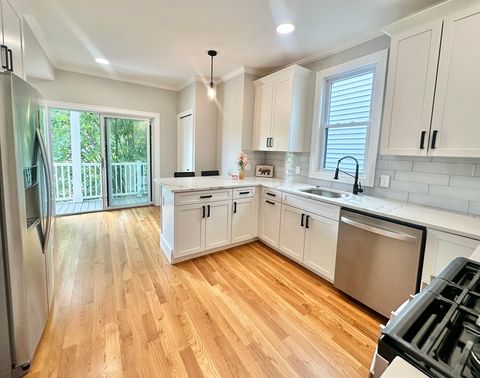
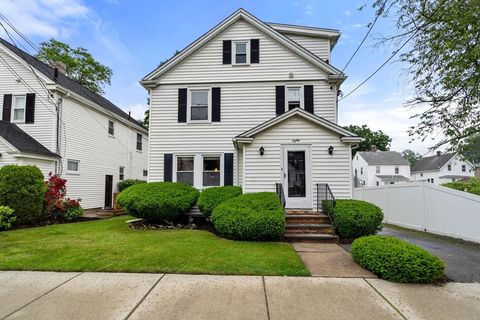
Active
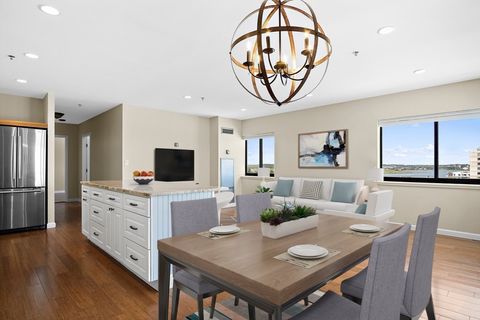
$549,000
2
bds
|
1
ba
|
970
sqft
|
built
1925
11 Goodway Rd, Boston, MA 02130
$-905
Cash flow
-8.6%
Cash-on-Cash Return
3.7%
Cap rate
0.6%
Rent to Value Ratio
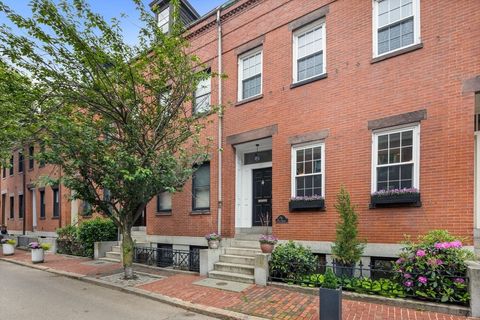
Active
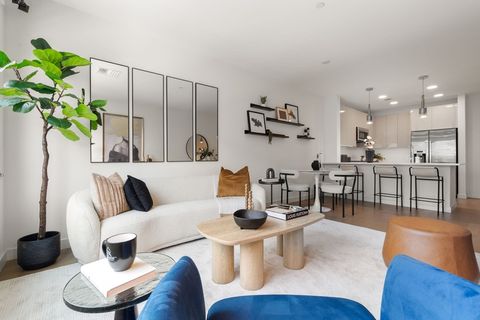
$1,649,000
3
bds
|
3
ba
|
1,653
sqft
|
built
2018
14 W Broadway, Boston, MA 02127
$-4,479
Cash flow
-14.2%
Cash-on-Cash Return
2.4%
Cap rate
0.5%
Rent to Value Ratio
Active
$409,000
1
bds
|
1
ba
|
320
sqft
|
built
1910
8 Garrison St, Boston, MA 02116
$-1,215
Cash flow
-15.5%
Cash-on-Cash Return
2.1%
Cap rate
0.5%
Rent to Value Ratio
Active
$720,000
2
bds
|
2
ba
|
849
sqft
|
built
1905
299 Maverick St, Boston, MA 02128
$-1,556
Cash flow
-11.3%
Cash-on-Cash Return
3.1%
Cap rate
0.5%
Rent to Value Ratio
Active
$550,000
2
bds
|
1
ba
|
800
sqft
|
built
1962
26 Waverly St, Boston, MA 02135
$-1,566
Cash flow
-14.9%
Cash-on-Cash Return
2.3%
Cap rate
0.5%
Rent to Value Ratio
Active
$3,295,000
3
bds
|
3
ba
|
2,453
sqft
|
built
1890
9 Bond St, Boston, MA 02118
$-11,704
Cash flow
-18.5%
Cash-on-Cash Return
1.4%
Cap rate
0.3%
Rent to Value Ratio
Active
$1,199,000
4
bds
|
3
ba
|
2,277
sqft
|
built
1995
168 Maple St, Boston, MA 02132
$-3,140
Cash flow
-13.7%
Cash-on-Cash Return
2.5%
Cap rate
0.4%
Rent to Value Ratio
Active
$779,000
2
bds
|
2
ba
|
1,085
sqft
|
built
2002
300 Allston St, Boston, MA 02135
$-1,992
Cash flow
-13.3%
Cash-on-Cash Return
2.6%
Cap rate
0.5%
Rent to Value Ratio
Active
$749,000
2
bds
|
1
ba
|
742
sqft
|
built
2010
691 Massachusetts Ave, Boston, MA 02118
$-2,027
Cash flow
-14.1%
Cash-on-Cash Return
2.4%
Cap rate
0.5%
Rent to Value Ratio
Active
$1,949,000
2
bds
|
2
ba
|
1,339
sqft
|
built
1890
318 Commonwealth Ave, Boston, MA 02115
$-6,722
Cash flow
-18.0%
Cash-on-Cash Return
1.5%
Cap rate
0.4%
Rent to Value Ratio
Active
$4,200,000
2
bds
|
3
ba
|
2,600
sqft
|
built
1880
258-260 Beacon St, Boston, MA 02116
$-18,348
Cash flow
-22.8%
Cash-on-Cash Return
0.4%
Cap rate
0.2%
Rent to Value Ratio
Active
$534,900
2
bds
|
2
ba
|
1,007
sqft
|
built
1986
474 Revere Beach Blvd, Revere, MA 02151
$-1,896
Cash flow
-18.5%
Cash-on-Cash Return
1.4%
Cap rate
0.5%
Rent to Value Ratio
Active
$1,950,000
8
bds
|
3
ba
|
3,159
sqft
|
built
1915
230 Corey Rd, Boston, MA 02135
$-6,367
Cash flow
-17.0%
Cash-on-Cash Return
1.8%
Cap rate
0.3%
Rent to Value Ratio
Active
$725,000
1
bds
|
1
ba
|
766
sqft
|
built
2020
45 Lewis St, Boston, MA 02128
$-1,808
Cash flow
-13.0%
Cash-on-Cash Return
2.7%
Cap rate
0.5%
Rent to Value Ratio
Active
$950,000
2
bds
|
2
ba
|
909
sqft
|
built
1890
17 Cazenove St, Boston, MA 02116
$-2,538
Cash flow
-13.9%
Cash-on-Cash Return
2.5%
Cap rate
0.5%
Rent to Value Ratio
Active
$519,900
2
bds
|
1
ba
|
872
sqft
|
built
1920
106 13th St, Boston, MA 02129
$-1,158
Cash flow
-11.6%
Cash-on-Cash Return
3.0%
Cap rate
0.8%
Rent to Value Ratio
Active
$1,350,000
5
bds
|
3
ba
|
3,493
sqft
|
built
1950
21 Glenley Ter, Boston, MA 02135
$-2,530
Cash flow
-9.8%
Cash-on-Cash Return
3.4%
Cap rate
0.5%
Rent to Value Ratio
Active
$629,900
1
bds
|
1
ba
|
837
sqft
|
built
2011
691 Massachusetts Ave, Boston, MA 02118
$-2,101
Cash flow
-17.4%
Cash-on-Cash Return
1.7%
Cap rate
0.5%
Rent to Value Ratio
Active
$1,170,000
5
bds
|
2
ba
|
2,151
sqft
|
built
1930
328-330 Revere St, Winthrop, MA 02152
$-3,940
Cash flow
-17.6%
Cash-on-Cash Return
1.6%
Cap rate
0.3%
Rent to Value Ratio
Active
$499,900
2
bds
|
1
ba
|
1,220
sqft
|
built
1900
110 Bellingham St, Chelsea, MA 02150
$-882
Cash flow
-9.2%
Cash-on-Cash Return
3.6%
Cap rate
0.6%
Rent to Value Ratio
Active
$1,395,000
2
bds
|
3
ba
|
1,402
sqft
|
built
2000
1 Avery St, Boston, MA 02111
$-5,727
Cash flow
-21.4%
Cash-on-Cash Return
0.8%
Cap rate
0.5%
Rent to Value Ratio
Active
$895,000
1
bds
|
1
ba
|
630
sqft
|
built
1880
119 Marlborough St, Boston, MA 02116
$-2,795
Cash flow
-16.3%
Cash-on-Cash Return
1.9%
Cap rate
0.4%
Rent to Value Ratio
Active
$755,000
3
bds
|
2
ba
|
1,840
sqft
|
built
1925
80 Joyce Kilmer Rd, Boston, MA 02132
$-1,191
Cash flow
-8.2%
Cash-on-Cash Return
3.8%
Cap rate
0.5%
Rent to Value Ratio
Active
$995,000
3
bds
|
2
ba
|
1,200
sqft
|
built
1857
10 Eldridge Pl, Chelsea, MA 02150
$-2,819
Cash flow
-14.8%
Cash-on-Cash Return
2.3%
Cap rate
0.3%
Rent to Value Ratio
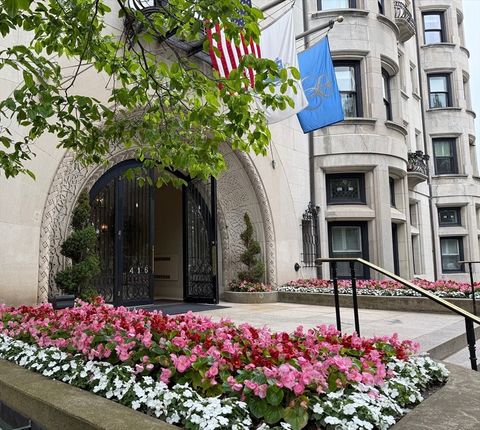
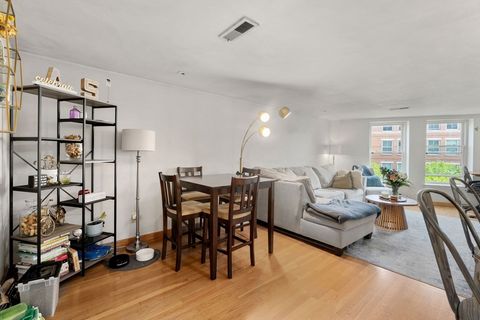
Active
$3,395,000
3
bds
|
2
ba
|
2,394
sqft
|
built
1897
416 Commonwealth Ave, Boston, MA 02215
$-14,320
Cash flow
-22.0%
Cash-on-Cash Return
0.6%
Cap rate
0.3%
Rent to Value Ratio
Active
$750,000
2
bds
|
1
ba
|
970
sqft
|
built
1920
386 Commercial St, Boston, MA 02109
$-1,972
Cash flow
-13.7%
Cash-on-Cash Return
2.5%
Cap rate
0.5%
Rent to Value Ratio
Active
$799,000
3
bds
|
2
ba
|
1,418
sqft
|
built
1920
32 Hale Ave, Winthrop, MA 02152
$-2,138
Cash flow
-14.0%
Cash-on-Cash Return
2.5%
Cap rate
0.4%
Rent to Value Ratio
Active
$1,165,000
8
bds
|
4
ba
|
3,198
sqft
|
built
1905
36-38 Coleman St, Boston, MA 02125
$-3,534
Cash flow
-15.8%
Cash-on-Cash Return
2.0%
Cap rate
0.3%
Rent to Value Ratio

Active
$2,475,000
2
bds
|
2
ba
|
1,266
sqft
|
built
1910
316 N Beacon St, Boston, MA 02135
$-9,455
Cash flow
-19.9%
Cash-on-Cash Return
1.1%
Cap rate
0.3%
Rent to Value Ratio
Active
$650,000
2
bds
|
1
ba
|
1,262
sqft
|
built
1945
88 Grand View Ave, Winthrop, MA 02152
$-1,529
Cash flow
-12.3%
Cash-on-Cash Return
2.9%
Cap rate
0.4%
Rent to Value Ratio
Active
$1,650,000
12
bds
|
6
ba
|
3,712
sqft
|
built
1900
4 Warren Ave, Chelsea, MA 02150
$-6,633
Cash flow
-21.0%
Cash-on-Cash Return
0.9%
Cap rate
0.2%
Rent to Value Ratio

Active
$1,350,000
1
bds
|
1
ba
|
761
sqft
|
built
2018
188 Brookline Ave, Boston, MA 02215
$-4,993
Cash flow
-19.3%
Cash-on-Cash Return
1.2%
Cap rate
0.4%
Rent to Value Ratio

Active
$649,000
3
bds
|
2
ba
|
821
sqft
|
built
2020
221 Paris St, Boston, MA 02128
$-1,671
Cash flow
-13.4%
Cash-on-Cash Return
2.6%
Cap rate
0.5%
Rent to Value Ratio

Active
$649,900
3
bds
|
1
ba
|
1,000
sqft
|
built
1957
34 Sammett Ave, Boston, MA 02131
$-1,646
Cash flow
-13.2%
Cash-on-Cash Return
2.6%
Cap rate
0.4%
Rent to Value Ratio

Active
$950,000
2
bds
|
2
ba
|
1,010
sqft
|
built
1890
69 Saint Botolph St, Boston, MA 02116
$-2,934
Cash flow
-16.1%
Cash-on-Cash Return
2.0%
Cap rate
0.4%
Rent to Value Ratio
Active
$1,799,000
2
bds
|
3
ba
|
1,455
sqft
|
built
1890
38 Concord Sq, Boston, MA 02118
$-5,099
Cash flow
-14.8%
Cash-on-Cash Return
2.3%
Cap rate
0.4%
Rent to Value Ratio
Active
$1,250,000
3
bds
|
2
ba
|
1,365
sqft
|
built
2017
1650 Columbia Rd, Boston, MA 02127
$-2,995
Cash flow
-12.5%
Cash-on-Cash Return
2.8%
Cap rate
0.5%
Rent to Value Ratio
Active
$699,000
4
bds
|
2
ba
|
1,580
sqft
|
built
1910
69 Metropolitan Ave, Boston, MA 02131
$-1,418
Cash flow
-10.6%
Cash-on-Cash Return
3.2%
Cap rate
0.5%
Rent to Value Ratio