Suffolk County Investment Properties for Sale
Browse homes for sale and investment properties in Suffolk County. Refine your search by price, property type, or more.
Best cash flowing properties in Suffolk County
Active
$606,853
2
bds
|
1
ba
|
1,020
sqft
|
built
2008
150 Dorchester Ave, Boston, MA 02127
$-362
Cash flow
-3.1%
Cash-on-Cash Return
5.0%
Cap rate
0.6%
Rent to Value Ratio
Active
$450,000
1
bds
|
1
ba
|
628
sqft
|
built
1910
55 Mozart St, Boston, MA 02130
$-410
Cash flow
-4.8%
Cash-on-Cash Return
4.6%
Cap rate
0.6%
Rent to Value Ratio
664 out of 1,160 properties for sale in Suffolk County
Limited Results Shown
Create a free account, or log in to reveal all property listings and enjoy the complete experience.
Active
$870,000
4
bds
|
4
ba
|
2,350
sqft
|
built
1900
136 Pauline St, Winthrop, MA 02152
$-1,579
Cash flow
-9.5%
Cash-on-Cash Return
3.5%
Cap rate
0.5%
Rent to Value Ratio
Active
$1,295,000
2
bds
|
1
ba
|
925
sqft
|
built
1925
180 Commonwealth Ave, Boston, MA 02116
$-4,255
Cash flow
-17.1%
Cash-on-Cash Return
1.7%
Cap rate
0.4%
Rent to Value Ratio
Active
$479,900
2
bds
|
1
ba
|
595
sqft
|
built
2017
15 Swift Ter, Boston, MA 02128
$-766
Cash flow
-8.3%
Cash-on-Cash Return
3.8%
Cap rate
0.5%
Rent to Value Ratio
Active
$1,595,000
5
bds
|
2
ba
|
1,590
sqft
|
built
1840
379 Shawmut Ave, Boston, MA 02118
$-3,693
Cash flow
-12.1%
Cash-on-Cash Return
2.9%
Cap rate
0.5%
Rent to Value Ratio
Active
$1,295,000
6
bds
|
3
ba
|
4,673
sqft
|
built
1890
118 White St, Boston, MA 02128
$-4,685
Cash flow
-18.9%
Cash-on-Cash Return
1.3%
Cap rate
0.3%
Rent to Value Ratio
Active
$798,000
2
bds
|
1
ba
|
683
sqft
|
built
1900
345 Commonwealth Ave, Boston, MA 02115
$-2,132
Cash flow
-13.9%
Cash-on-Cash Return
2.5%
Cap rate
0.4%
Rent to Value Ratio
Active
$2,395,000
2
bds
|
3
ba
|
1,650
sqft
|
built
1900
71 Rutland St, Boston, MA 02118
$-8,175
Cash flow
-17.8%
Cash-on-Cash Return
1.6%
Cap rate
0.3%
Rent to Value Ratio
Active
$309,900
2
bds
|
1
ba
|
604
sqft
|
built
1900
77 Pearl St, Chelsea, MA 02150
$-490
Cash flow
-8.2%
Cash-on-Cash Return
3.8%
Cap rate
0.7%
Rent to Value Ratio
Active
$1,250,000
1
bds
|
1
ba
|
873
sqft
|
built
2016
1 Franklin St, Boston, MA 02110
$-4,512
Cash flow
-18.8%
Cash-on-Cash Return
1.3%
Cap rate
0.4%
Rent to Value Ratio
Active
$714,900
4
bds
|
3
ba
|
1,704
sqft
|
built
1920
19 Northdale Rd, Boston, MA 02132
$-1,459
Cash flow
-10.6%
Cash-on-Cash Return
3.2%
Cap rate
0.5%
Rent to Value Ratio
Active
$850,000
2
bds
|
3
ba
|
1,143
sqft
|
built
2017
67 Sawyer Ave, Boston, MA 02125
$-1,918
Cash flow
-11.8%
Cash-on-Cash Return
3.0%
Cap rate
0.5%
Rent to Value Ratio
Active
$699,000
1
bds
|
1
ba
|
719
sqft
|
built
1830
314A Bunker Hill St, Boston, MA 02129
$-1,348
Cash flow
-10.1%
Cash-on-Cash Return
3.4%
Cap rate
0.5%
Rent to Value Ratio
Active
$860,000
2
bds
|
2
ba
|
940
sqft
|
built
2008
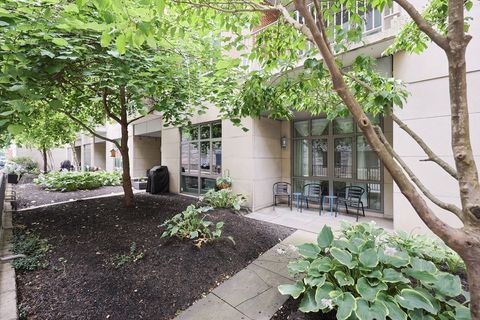
178 W 4th St, Boston, MA 02127
$-2,580
Cash flow
-15.7%
Cash-on-Cash Return
2.1%
Cap rate
0.5%
Rent to Value Ratio
Active
$2,499,000
6
bds
|
4
ba
|
4,800
sqft
|
built
1920
12 Zamora St, Boston, MA 02130
$-7,935
Cash flow
-16.6%
Cash-on-Cash Return
1.9%
Cap rate
0.3%
Rent to Value Ratio
Active
$759,000
1
bds
|
1
ba
|
747
sqft
|
built
2019
65 Lewis St, Boston, MA 02128
$-2,158
Cash flow
-14.8%
Cash-on-Cash Return
2.3%
Cap rate
0.5%
Rent to Value Ratio
Active
$1,900,000
4
bds
|
4
ba
|
1,842
sqft
|
built
1890
377 Shawmut Ave, Boston, MA 02118
$-4,932
Cash flow
-13.5%
Cash-on-Cash Return
2.6%
Cap rate
0.4%
Rent to Value Ratio
Active
$479,000
2
bds
|
1
ba
|
747
sqft
|
built
1900
23 Chestnut St, Chelsea, MA 02150
$-1,051
Cash flow
-11.4%
Cash-on-Cash Return
3.0%
Cap rate
0.6%
Rent to Value Ratio
Active
$1,395,000
2
bds
|
2
ba
|
1,410
sqft
|
built
2006
80 Broad St, Boston, MA 02110
$-4,439
Cash flow
-16.6%
Cash-on-Cash Return
1.9%
Cap rate
0.5%
Rent to Value Ratio
Active
$419,900
1
bds
|
1
ba
|
560
sqft
|
built
1910
1486 Commonwealth Ave, Boston, MA 02135
$-848
Cash flow
-10.5%
Cash-on-Cash Return
3.3%
Cap rate
0.6%
Rent to Value Ratio
Active
$2,795,000
9
bds
|
4
ba
|
4,320
sqft
|
built
1900
144 Salem St, Boston, MA 02113
$-9,421
Cash flow
-17.6%
Cash-on-Cash Return
1.6%
Cap rate
0.3%
Rent to Value Ratio
Active
$850,000
2
bds
|
1
ba
|
940
sqft
|
built
1900
1 Worcester Sq, Boston, MA 02118
$-2,006
Cash flow
-12.3%
Cash-on-Cash Return
2.8%
Cap rate
0.5%
Rent to Value Ratio
Active
$639,000
1
bds
|
1
ba
|
440
sqft
|
built
1880
7 Hereford St, Boston, MA 02115
$-1,744
Cash flow
-14.2%
Cash-on-Cash Return
2.4%
Cap rate
0.5%
Rent to Value Ratio
Active
$1,100,000
5
bds
|
2
ba
|
1,547
sqft
|
built
1875
4 Essex St, Boston, MA 02111
$-2,439
Cash flow
-11.6%
Cash-on-Cash Return
3.0%
Cap rate
0.5%
Rent to Value Ratio
Active
$730,000
4
bds
|
2
ba
|
2,391
sqft
|
built
1940
47 Flint St, Revere, MA 02151
$-501
Cash flow
-3.6%
Cash-on-Cash Return
4.9%
Cap rate
0.7%
Rent to Value Ratio
Active
$2,499,000
8
bds
|
4
ba
|
3,782
sqft
|
built
1900
647 E 3rd St, Boston, MA 02127
$-9,995
Cash flow
-20.9%
Cash-on-Cash Return
0.9%
Cap rate
0.2%
Rent to Value Ratio
Active
$999,999
4
bds
|
2
ba
|
1,551
sqft
|
built
1900
24 Moseley St, Boston, MA 02125
$-2,112
Cash flow
-11.0%
Cash-on-Cash Return
3.1%
Cap rate
0.5%
Rent to Value Ratio
Active
$999,000
3
bds
|
2
ba
|
1,341
sqft
|
built
2019
3531 Washington St, Boston, MA 02130
$-2,177
Cash flow
-11.4%
Cash-on-Cash Return
3.1%
Cap rate
0.6%
Rent to Value Ratio
Active
$3,100,000
3
bds
|
4
ba
|
2,118
sqft
|
built
1930
137 Marlborough St, Boston, MA 02116
$-12,975
Cash flow
-21.8%
Cash-on-Cash Return
0.7%
Cap rate
0.3%
Rent to Value Ratio
Active
$1,999,000
3
bds
|
4
ba
|
2,140
sqft
|
built
2016
945 E Broadway, Boston, MA 02127
$-4,991
Cash flow
-13.0%
Cash-on-Cash Return
2.7%
Cap rate
0.5%
Rent to Value Ratio
Active
$995,000
5
bds
|
3
ba
|
2,937
sqft
|
built
1900
215 Lexington St, Boston, MA 02128
$-3,621
Cash flow
-19.0%
Cash-on-Cash Return
1.3%
Cap rate
0.3%
Rent to Value Ratio
Active
$925,000
4
bds
|
3
ba
|
2,623
sqft
|
built
1982
241 Perkins St, Boston, MA 02130
$-5,535
Cash flow
-31.2%
Cash-on-Cash Return
-1.5%
Cap rate
0.5%
Rent to Value Ratio
Active
$345,000
1
bds
|
1
ba
|
624
sqft
|
built
1965
596 American Legion Hwy, Boston, MA 02131
$-705
Cash flow
-10.7%
Cash-on-Cash Return
3.2%
Cap rate
0.6%
Rent to Value Ratio
Active
$599,000
0
bds
|
1
ba
|
407
sqft
|
built
2014
43 Westland Ave, Boston, MA 02115
$-1,981
Cash flow
-17.3%
Cash-on-Cash Return
1.7%
Cap rate
0.5%
Rent to Value Ratio
Active
$5,775,000
2
bds
|
3
ba
|
2,129
sqft
|
built
2015
22 Liberty Pl, Boston, MA 02127
$-28,626
Cash flow
-25.9%
Cash-on-Cash Return
-0.3%
Cap rate
0.2%
Rent to Value Ratio
Active
$1,450,000
1
bds
|
1
ba
|
815
sqft
|
built
2018
188 Brookline Ave, Boston, MA 02215
$-4,794
Cash flow
-17.2%
Cash-on-Cash Return
1.7%
Cap rate
0.4%
Rent to Value Ratio
Active
$639,000
0
bds
|
1
ba
|
424
sqft
|
built
1905
195 Beacon St, Boston, MA 02116
$-1,805
Cash flow
-14.7%
Cash-on-Cash Return
2.3%
Cap rate
0.5%
Rent to Value Ratio
Active
$949,000
2
bds
|
2
ba
|
1,137
sqft
|
built
1900
70 Lincoln St, Boston, MA 02111
$-2,775
Cash flow
-15.3%
Cash-on-Cash Return
2.2%
Cap rate
0.5%
Rent to Value Ratio
Active
$8,495,000
2
bds
|
3
ba
|
2,945
sqft
|
built
2015
1 Dalton St, Boston, MA 02115
$-52,169
Cash flow
-32.0%
Cash-on-Cash Return
-1.7%
Cap rate
0.1%
Rent to Value Ratio