Suffolk County Investment Properties for Sale
Browse homes for sale and investment properties in Suffolk County. Refine your search by price, property type, or more.
Best cash flowing properties in Suffolk County
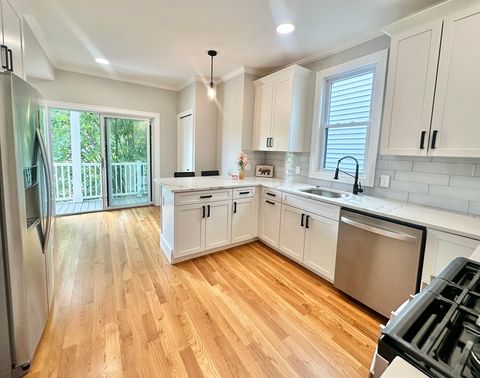
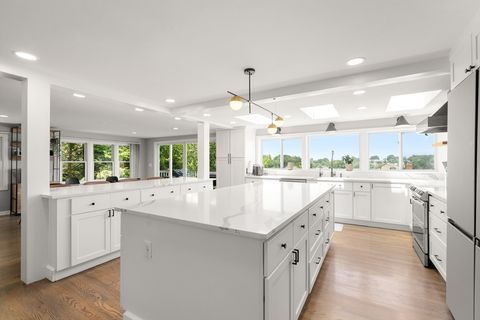
Active
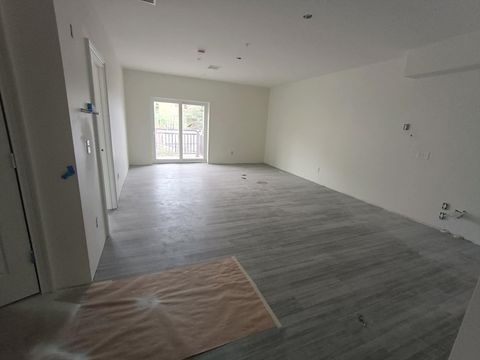
$149,000
1
bds
|
1
ba
|
751
sqft
|
built
2025
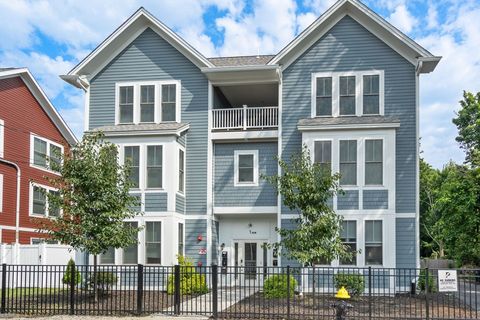
10 Franklin Ave, Revere, MA 02151
$336
Cash flow
11.8%
Cash-on-Cash Return
8.4%
Cap rate
1.5%
Rent to Value Ratio
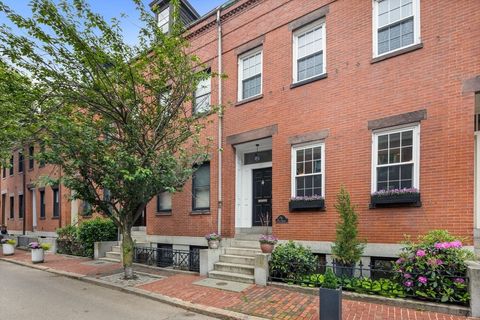
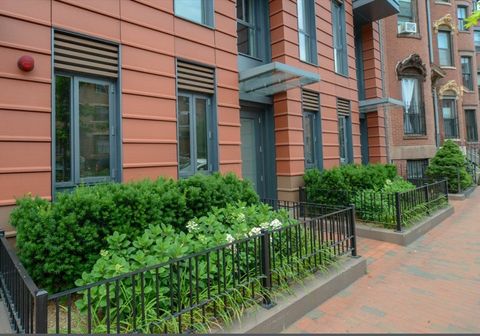
Active
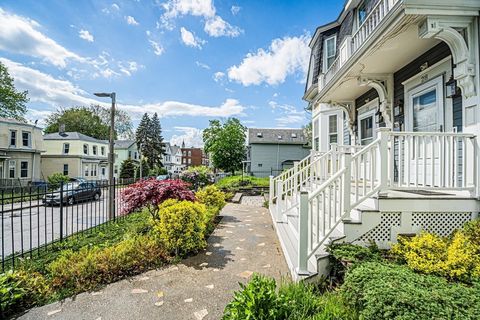
$779,000
3
bds
|
3
ba
|
1,940
sqft
|
built
1890
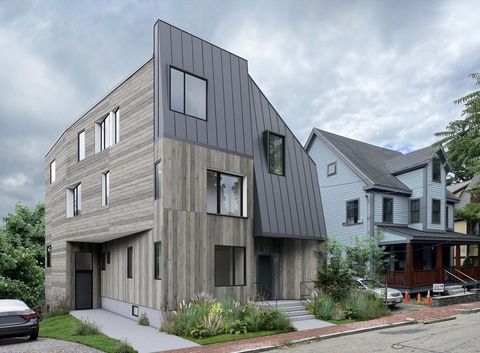
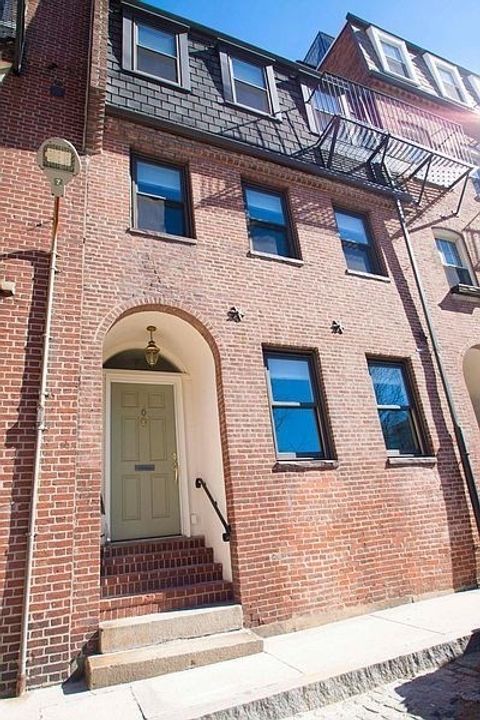
28 Woodbine St, Boston, MA 02119
$-574
Cash flow
-3.8%
Cash-on-Cash Return
4.8%
Cap rate
0.7%
Rent to Value Ratio
612 out of 1,045 properties for sale in Suffolk County
Limited Results Shown
Create a free account, or log in to reveal all property listings and enjoy the complete experience.
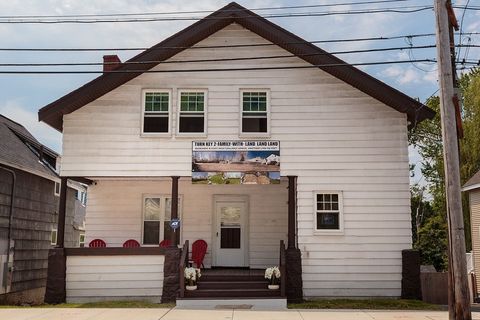
Active
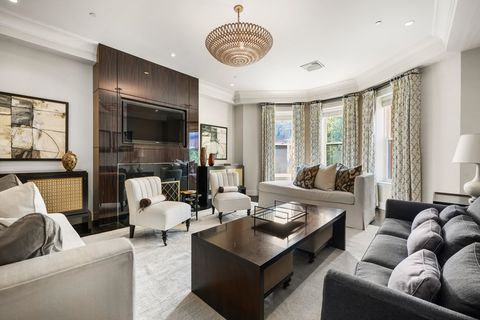
$4,850,000
3
bds
|
3
ba
|
2,120
sqft
|
built
1900
15 Marlborough St, Boston, MA 02116
$-21,984
Cash flow
-23.6%
Cash-on-Cash Return
0.2%
Cap rate
0.2%
Rent to Value Ratio
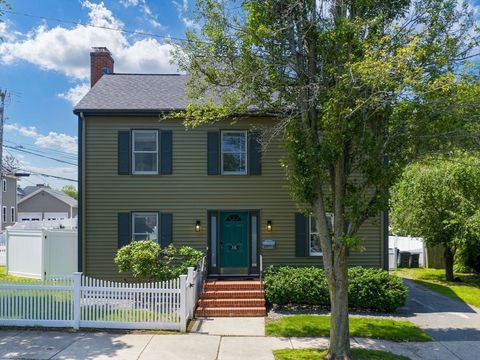
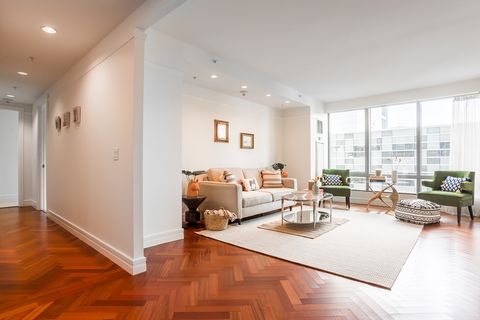
Active
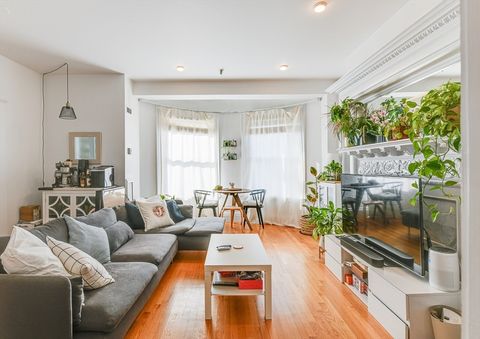
$750,000
3
bds
|
1
ba
|
1,086
sqft
|
built
1910
492 Massachusetts Ave, Boston, MA 02118
$-2,203
Cash flow
-15.3%
Cash-on-Cash Return
2.2%
Cap rate
0.6%
Rent to Value Ratio
Active
$789,000
3
bds
|
3
ba
|
1,694
sqft
|
built
2020
1 Elm St, Boston, MA 02122
$-2,180
Cash flow
-14.4%
Cash-on-Cash Return
2.4%
Cap rate
0.5%
Rent to Value Ratio
Active
$3,295,000
2
bds
|
2
ba
|
1,832
sqft
|
built
1899
21 Branch St, Boston, MA 02108
$-12,185
Cash flow
-19.3%
Cash-on-Cash Return
1.2%
Cap rate
0.3%
Rent to Value Ratio
Active
$725,000
2
bds
|
3
ba
|
1,249
sqft
|
built
2015
246 Boston St, Boston, MA 02125
$-1,954
Cash flow
-14.1%
Cash-on-Cash Return
2.4%
Cap rate
0.5%
Rent to Value Ratio
Active
$960,000
6
bds
|
1
ba
|
2,280
sqft
|
built
1850
63 Beech Glen St, Boston, MA 02119
$-2,406
Cash flow
-13.1%
Cash-on-Cash Return
2.7%
Cap rate
0.4%
Rent to Value Ratio
Active
$1,195,000
1
bds
|
2
ba
|
921
sqft
|
built
2017
121 Portland St, Boston, MA 02114
$-4,636
Cash flow
-20.2%
Cash-on-Cash Return
1.0%
Cap rate
0.3%
Rent to Value Ratio
Active
$1,270,000
1
bds
|
2
ba
|
1,035
sqft
|
built
2009
110 Stuart St, Boston, MA 02116
$-4,255
Cash flow
-17.5%
Cash-on-Cash Return
1.7%
Cap rate
0.4%
Rent to Value Ratio
Active
$9,350,000
3
bds
|
3
ba
|
2,915
sqft
|
built
2008
776 Boylston St, Boston, MA 02199
$-51,168
Cash flow
-28.6%
Cash-on-Cash Return
-0.9%
Cap rate
0.1%
Rent to Value Ratio
Active
$349,000
1
bds
|
1
ba
|
465
sqft
|
built
1930
97 Chester St, Boston, MA 02134
$-684
Cash flow
-10.2%
Cash-on-Cash Return
3.3%
Cap rate
0.7%
Rent to Value Ratio
Active
$1,550,000
4
bds
|
2
ba
|
1,620
sqft
|
built
1890
6 Stillman Pl, Boston, MA 02113
$-3,614
Cash flow
-12.2%
Cash-on-Cash Return
2.9%
Cap rate
0.5%
Rent to Value Ratio
Active
$850,000
3
bds
|
2
ba
|
1,929
sqft
|
built
1963
66 Danny Rd, Boston, MA 02136
$-1,945
Cash flow
-11.9%
Cash-on-Cash Return
2.9%
Cap rate
0.5%
Rent to Value Ratio
Active
$525,000
2
bds
|
2
ba
|
1,023
sqft
|
built
1987
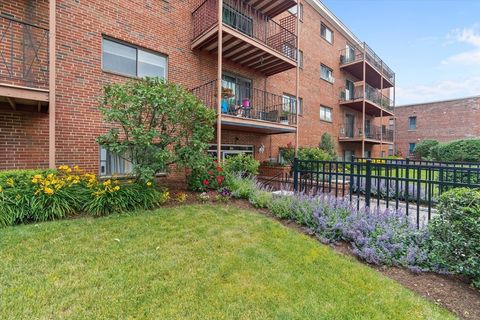
160 Commandants Way, Chelsea, MA 02150
$-1,291
Cash flow
-12.8%
Cash-on-Cash Return
2.7%
Cap rate
0.6%
Rent to Value Ratio
Active
$1,395,000
2
bds
|
2
ba
|
1,300
sqft
|
built
2013
580 Washington St, Boston, MA 02111
$-4,710
Cash flow
-17.6%
Cash-on-Cash Return
1.6%
Cap rate
0.5%
Rent to Value Ratio
Active
$3,930,000
14
bds
|
6
ba
|
0
sqft
|
built
1865
664 Washington St, Boston, MA 02111
$-16,703
Cash flow
-22.2%
Cash-on-Cash Return
0.6%
Cap rate
0.1%
Rent to Value Ratio
Active
$549,000
2
bds
|
1
ba
|
970
sqft
|
built
1925
11 Goodway Rd, Boston, MA 02130
$-905
Cash flow
-8.6%
Cash-on-Cash Return
3.7%
Cap rate
0.6%
Rent to Value Ratio
Active
$1,649,000
3
bds
|
3
ba
|
1,653
sqft
|
built
2018
14 W Broadway, Boston, MA 02127
$-4,479
Cash flow
-14.2%
Cash-on-Cash Return
2.4%
Cap rate
0.5%
Rent to Value Ratio
Active
$409,000
1
bds
|
1
ba
|
320
sqft
|
built
1910
8 Garrison St, Boston, MA 02116
$-1,215
Cash flow
-15.5%
Cash-on-Cash Return
2.1%
Cap rate
0.5%
Rent to Value Ratio
Active
$720,000
2
bds
|
2
ba
|
849
sqft
|
built
1905
299 Maverick St, Boston, MA 02128
$-1,556
Cash flow
-11.3%
Cash-on-Cash Return
3.1%
Cap rate
0.5%
Rent to Value Ratio
Active
$550,000
2
bds
|
1
ba
|
800
sqft
|
built
1962
26 Waverly St, Boston, MA 02135
$-1,566
Cash flow
-14.9%
Cash-on-Cash Return
2.3%
Cap rate
0.5%
Rent to Value Ratio
Active
$3,295,000
3
bds
|
3
ba
|
2,453
sqft
|
built
1890
9 Bond St, Boston, MA 02118
$-11,704
Cash flow
-18.5%
Cash-on-Cash Return
1.4%
Cap rate
0.3%
Rent to Value Ratio
Active
$1,199,000
4
bds
|
3
ba
|
2,277
sqft
|
built
1995
168 Maple St, Boston, MA 02132
$-3,140
Cash flow
-13.7%
Cash-on-Cash Return
2.5%
Cap rate
0.4%
Rent to Value Ratio
Active
$779,000
2
bds
|
2
ba
|
1,085
sqft
|
built
2002
300 Allston St, Boston, MA 02135
$-1,992
Cash flow
-13.3%
Cash-on-Cash Return
2.6%
Cap rate
0.5%
Rent to Value Ratio
Active
$749,000
2
bds
|
1
ba
|
742
sqft
|
built
2010
691 Massachusetts Ave, Boston, MA 02118
$-2,027
Cash flow
-14.1%
Cash-on-Cash Return
2.4%
Cap rate
0.5%
Rent to Value Ratio
Active
$1,949,000
2
bds
|
2
ba
|
1,339
sqft
|
built
1890
318 Commonwealth Ave, Boston, MA 02115
$-6,722
Cash flow
-18.0%
Cash-on-Cash Return
1.5%
Cap rate
0.4%
Rent to Value Ratio
Active
$4,200,000
2
bds
|
3
ba
|
2,600
sqft
|
built
1880
258-260 Beacon St, Boston, MA 02116
$-18,348
Cash flow
-22.8%
Cash-on-Cash Return
0.4%
Cap rate
0.2%
Rent to Value Ratio
Active
$534,900
2
bds
|
2
ba
|
1,007
sqft
|
built
1986
474 Revere Beach Blvd, Revere, MA 02151
$-1,896
Cash flow
-18.5%
Cash-on-Cash Return
1.4%
Cap rate
0.5%
Rent to Value Ratio
Active
$725,000
1
bds
|
1
ba
|
766
sqft
|
built
2020
45 Lewis St, Boston, MA 02128
$-1,808
Cash flow
-13.0%
Cash-on-Cash Return
2.7%
Cap rate
0.5%
Rent to Value Ratio
Active
$950,000
2
bds
|
2
ba
|
909
sqft
|
built
1890
17 Cazenove St, Boston, MA 02116
$-2,538
Cash flow
-13.9%
Cash-on-Cash Return
2.5%
Cap rate
0.5%
Rent to Value Ratio
Active
$519,900
2
bds
|
1
ba
|
872
sqft
|
built
1920
106 13th St, Boston, MA 02129
$-1,158
Cash flow
-11.6%
Cash-on-Cash Return
3.0%
Cap rate
0.8%
Rent to Value Ratio
Active
$1,350,000
5
bds
|
3
ba
|
3,493
sqft
|
built
1950
21 Glenley Ter, Boston, MA 02135
$-2,530
Cash flow
-9.8%
Cash-on-Cash Return
3.4%
Cap rate
0.5%
Rent to Value Ratio
Active
$629,900
1
bds
|
1
ba
|
837
sqft
|
built
2011
691 Massachusetts Ave, Boston, MA 02118
$-2,101
Cash flow
-17.4%
Cash-on-Cash Return
1.7%
Cap rate
0.5%
Rent to Value Ratio
Active
$1,170,000
5
bds
|
2
ba
|
2,151
sqft
|
built
1930
328-330 Revere St, Winthrop, MA 02152
$-3,940
Cash flow
-17.6%
Cash-on-Cash Return
1.6%
Cap rate
0.3%
Rent to Value Ratio
Active
$1,395,000
2
bds
|
3
ba
|
1,402
sqft
|
built
2000
1 Avery St, Boston, MA 02111
$-5,727
Cash flow
-21.4%
Cash-on-Cash Return
0.8%
Cap rate
0.5%
Rent to Value Ratio
Active
$499,900
2
bds
|
1
ba
|
1,220
sqft
|
built
1900
110 Bellingham St, Chelsea, MA 02150
$-882
Cash flow
-9.2%
Cash-on-Cash Return
3.6%
Cap rate
0.6%
Rent to Value Ratio
Active
$895,000
1
bds
|
1
ba
|
630
sqft
|
built
1880
119 Marlborough St, Boston, MA 02116
$-2,795
Cash flow
-16.3%
Cash-on-Cash Return
1.9%
Cap rate
0.4%
Rent to Value Ratio
Active
$755,000
3
bds
|
2
ba
|
1,840
sqft
|
built
1925
80 Joyce Kilmer Rd, Boston, MA 02132
$-1,191
Cash flow
-8.2%
Cash-on-Cash Return
3.8%
Cap rate
0.5%
Rent to Value Ratio
Active
$995,000
3
bds
|
2
ba
|
1,200
sqft
|
built
1857
10 Eldridge Pl, Chelsea, MA 02150
$-2,819
Cash flow
-14.8%
Cash-on-Cash Return
2.3%
Cap rate
0.3%
Rent to Value Ratio