Harris County Investment Properties for Sale
Browse homes for sale and investment properties in Harris County. Refine your search by price, property type, or more.
Best cash flowing properties in Harris County
Active
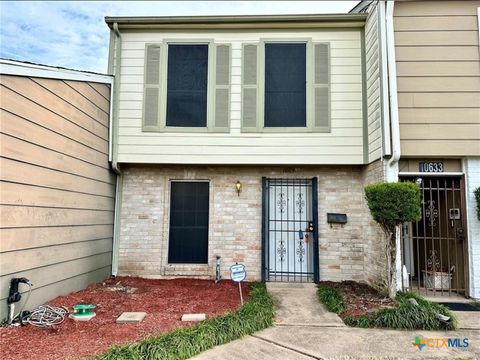
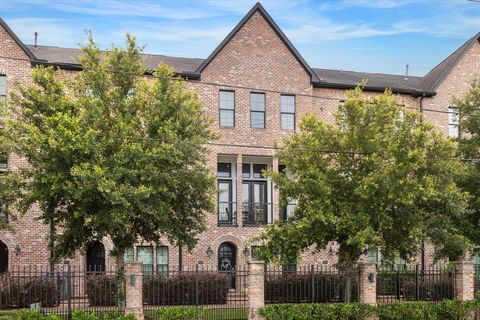
$190,000
2
bds
|
3
ba
|
1,728
sqft
|
built
1973
10631 Sandpiper Dr, Houston, TX 77096
$388
Cash flow
10.7%
Cash-on-Cash Return
8.7%
Cap rate
1.1%
Rent to Value Ratio
Active
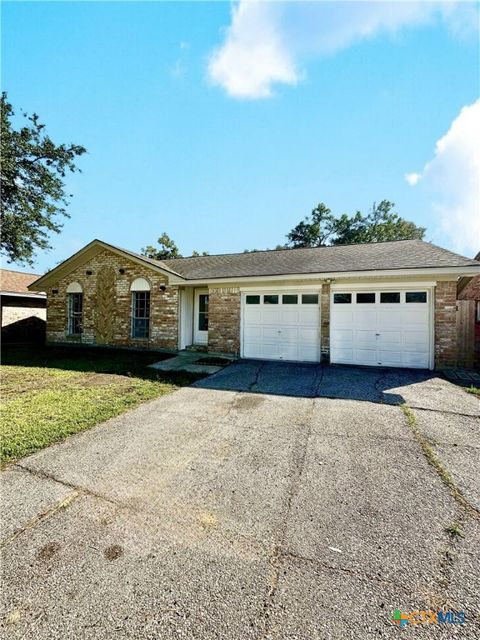
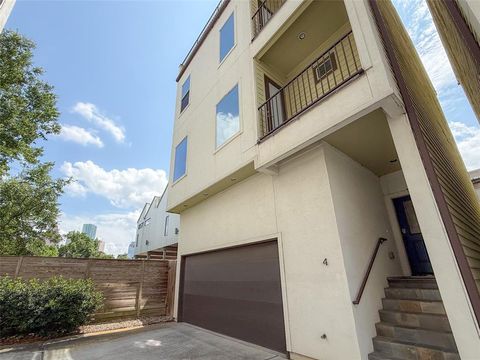
$179,000
3
bds
|
2
ba
|
1,110
sqft
|
built
1972
5407 Shirley St, Baytown, TX 77521
$307
Cash flow
8.9%
Cash-on-Cash Return
8.3%
Cap rate
1.0%
Rent to Value Ratio
10,000 out of 15,653 properties for sale in Harris County
Limited Results Shown
Create a free account, or log in to reveal all property listings and enjoy the complete experience.
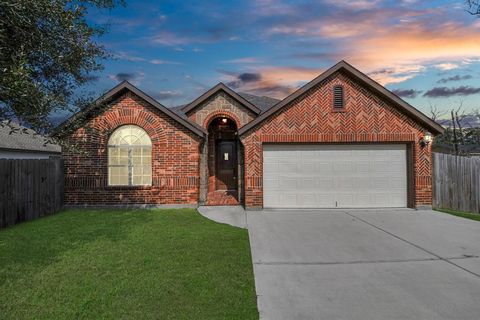
Active
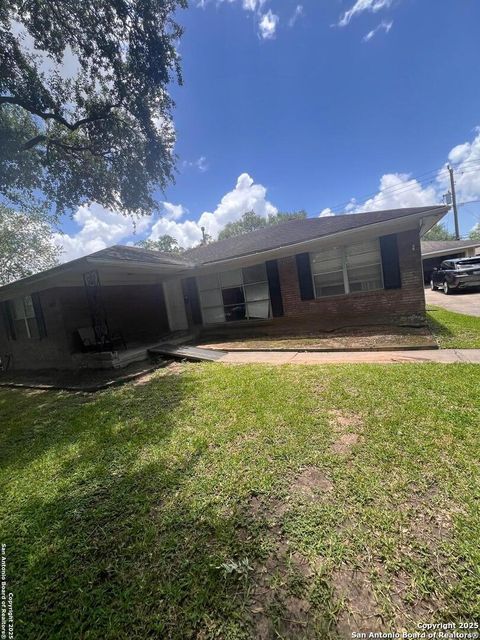
$299,999
3
bds
|
2
ba
|
1,678
sqft
|
built
1955
4849 Briarbend Dr, Houston, TX 77035
$-586
Cash flow
-10.2%
Cash-on-Cash Return
3.9%
Cap rate
0.7%
Rent to Value Ratio
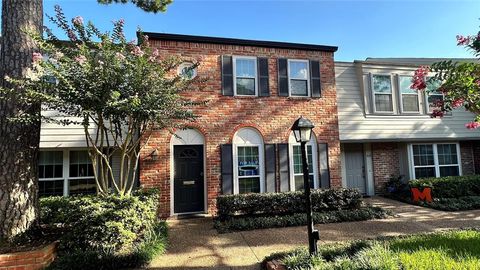
Active
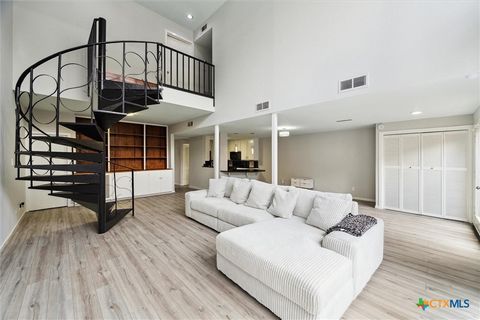
$165,000
2
bds
|
3
ba
|
1,664
sqft
|
built
1963
3300 Yorktown St, Houston, TX 77056
$-1,195
Cash flow
-37.8%
Cash-on-Cash Return
-2.4%
Cap rate
1.2%
Rent to Value Ratio

Active
$250,000
3
bds
|
2
ba
|
1,312
sqft
|
built
1983
22631 John Rolfe Ln, Katy, TX 77449
$-63
Cash flow
-1.3%
Cash-on-Cash Return
6.0%
Cap rate
0.7%
Rent to Value Ratio
Active
$190,000
2
bds
|
3
ba
|
1,728
sqft
|
built
1973
10631 Sandpiper Dr, Houston, TX 77096
$388
Cash flow
10.7%
Cash-on-Cash Return
8.7%
Cap rate
1.1%
Rent to Value Ratio

Active
$220,000
3
bds
|
2
ba
|
1,265
sqft
|
built
2018
13247 Montane Manor Ln, Houston, TX 77044
$-168
Cash flow
-4.0%
Cash-on-Cash Return
5.4%
Cap rate
0.8%
Rent to Value Ratio

Active
$419,999
3
bds
|
3
ba
|
2,253
sqft
|
built
2002
603 Dinorah Ct, Houston, TX 77094
$-1,216
Cash flow
-15.1%
Cash-on-Cash Return
2.8%
Cap rate
0.5%
Rent to Value Ratio
Active
$510,000
4
bds
|
3
ba
|
3,111
sqft
|
built
2021
21138 Yellow Bay Dr, Cypress, TX 77433
$-372
Cash flow
-3.8%
Cash-on-Cash Return
5.4%
Cap rate
0.7%
Rent to Value Ratio

Active
$320,000
4
bds
|
4
ba
|
3,598
sqft
|
built
1991
19102 Weeping Oak Ct, Spring, TX 77388
$-199
Cash flow
-3.2%
Cash-on-Cash Return
5.5%
Cap rate
1.0%
Rent to Value Ratio
Active
$143,500
3
bds
|
2
ba
|
1,849
sqft
|
built
1959
354 Cottontail Dr, Crosby, TX 77532
$294
Cash flow
10.7%
Cash-on-Cash Return
8.7%
Cap rate
1.3%
Rent to Value Ratio

Active
$549,000
6
bds
|
5
ba
|
3,271
sqft
|
built
2020
7606 Cottonwood Falls Dr, Spring, TX 77379
$-1,483
Cash flow
-14.1%
Cash-on-Cash Return
3.0%
Cap rate
0.6%
Rent to Value Ratio
Active
$695,000
3
bds
|
4
ba
|
2,618
sqft
|
built
2002
4524 Rose St, Houston, TX 77007
$-1,983
Cash flow
-14.9%
Cash-on-Cash Return
2.8%
Cap rate
0.5%
Rent to Value Ratio
Active
$265,000
3
bds
|
3
ba
|
1,924
sqft
|
built
2022
23319 Greenway Creek Ln, Spring, TX 77373
$-541
Cash flow
-10.7%
Cash-on-Cash Return
3.8%
Cap rate
0.8%
Rent to Value Ratio
Active
$159,500
2
bds
|
2
ba
|
1,282
sqft
|
built
1982
14911 Wunderlich Dr, Houston, TX 77069
$-361
Cash flow
-11.8%
Cash-on-Cash Return
3.6%
Cap rate
1.0%
Rent to Value Ratio

Active
$299,000
4
bds
|
2
ba
|
2,353
sqft
|
built
2006
21703 Colter Stone Dr, Spring, TX 77388
$-750
Cash flow
-13.1%
Cash-on-Cash Return
3.3%
Cap rate
0.7%
Rent to Value Ratio
Active
$725,000
4
bds
|
4
ba
|
3,587
sqft
|
built
2017
17306 Sages Ravine Dr, Humble, TX 77346
$-1,503
Cash flow
-10.8%
Cash-on-Cash Return
3.8%
Cap rate
0.8%
Rent to Value Ratio
Active
$179,000
3
bds
|
2
ba
|
1,110
sqft
|
built
1972
5407 Shirley St, Baytown, TX 77521
$307
Cash flow
8.9%
Cash-on-Cash Return
8.3%
Cap rate
1.0%
Rent to Value Ratio

Active
$367,000
3
bds
|
2
ba
|
2,132
sqft
|
built
2023
7703 Coral Key Dr, Cypress, TX 77433
$-210
Cash flow
-3.0%
Cash-on-Cash Return
5.6%
Cap rate
0.7%
Rent to Value Ratio
Active
$219,000
3
bds
|
2
ba
|
1,254
sqft
|
built
1950
3631 Yellowstone Blvd, Houston, TX 77021
$-326
Cash flow
-7.8%
Cash-on-Cash Return
4.5%
Cap rate
0.7%
Rent to Value Ratio
Active
$950,000
4
bds
|
0
ba
|
2,740
sqft
|
built
2016
432 Marshall St, Houston, TX 77006
$-2,625
Cash flow
-14.4%
Cash-on-Cash Return
2.9%
Cap rate
0.5%
Rent to Value Ratio
Active
$399,900
3
bds
|
0
ba
|
2,061
sqft
|
built
2018
9520 London Bridge Sta, Houston, TX 77045
$-365
Cash flow
-4.8%
Cash-on-Cash Return
5.2%
Cap rate
0.7%
Rent to Value Ratio

Active
$355,000
4
bds
|
0
ba
|
2,465
sqft
|
built
2017
24710 Royal Pike Dr, Katy, TX 77493
$-962
Cash flow
-14.1%
Cash-on-Cash Return
3.0%
Cap rate
0.7%
Rent to Value Ratio
Active
$500,000
3
bds
|
0
ba
|
2,490
sqft
|
built
2016
1005 Bingham St, Houston, TX 77007
$-1,013
Cash flow
-10.6%
Cash-on-Cash Return
3.8%
Cap rate
0.7%
Rent to Value Ratio
Active
$285,000
3
bds
|
0
ba
|
1,730
sqft
|
built
2016
6051 Woodview Dr, Humble, TX 77396
$-575
Cash flow
-10.5%
Cash-on-Cash Return
3.8%
Cap rate
0.8%
Rent to Value Ratio

Active
$415,000
4
bds
|
0
ba
|
2,262
sqft
|
built
1962
219 Drift Wood Dr, Seabrook, TX 77586
$-1,007
Cash flow
-12.7%
Cash-on-Cash Return
3.4%
Cap rate
0.6%
Rent to Value Ratio
Active
$344,000
3
bds
|
0
ba
|
1,640
sqft
|
built
1967
407 Bendwood Dr, Houston, TX 77024
$-1,166
Cash flow
-17.7%
Cash-on-Cash Return
2.2%
Cap rate
0.7%
Rent to Value Ratio
Active
$499,900
3
bds
|
0
ba
|
2,324
sqft
|
built
2015
1404 W 26th St, Houston, TX 77008
$-1,297
Cash flow
-13.5%
Cash-on-Cash Return
3.2%
Cap rate
0.6%
Rent to Value Ratio

Active
$315,000
3
bds
|
0
ba
|
1,737
sqft
|
built
2016
5326 Rue Dela Croix Dr, Katy, TX 77493
$-900
Cash flow
-14.9%
Cash-on-Cash Return
2.8%
Cap rate
0.7%
Rent to Value Ratio
Active
$535,000
4
bds
|
0
ba
|
3,163
sqft
|
built
2020
17107 Nulakeast Ct, Houston, TX 77044
$-1,337
Cash flow
-13.0%
Cash-on-Cash Return
3.3%
Cap rate
0.7%
Rent to Value Ratio

Active
$290,000
3
bds
|
0
ba
|
1,777
sqft
|
built
2016
17907 Acorn Field Trl, Humble, TX 77346
$-597
Cash flow
-10.7%
Cash-on-Cash Return
3.8%
Cap rate
0.8%
Rent to Value Ratio

Active
$256,500
4
bds
|
0
ba
|
1,810
sqft
|
built
2016
22706 Threefold Ridge Dr, Hockley, TX 77447
$-535
Cash flow
-10.9%
Cash-on-Cash Return
3.8%
Cap rate
0.8%
Rent to Value Ratio

Active
$449,786
3
bds
|
0
ba
|
2,393
sqft
|
built
2016
2424 Hadley St, Houston, TX 77003
$-909
Cash flow
-10.5%
Cash-on-Cash Return
3.8%
Cap rate
0.7%
Rent to Value Ratio

Active
$399,999
3
bds
|
0
ba
|
1,919
sqft
|
built
2014
2364 Commerce St, Houston, TX 77003
$-781
Cash flow
-10.2%
Cash-on-Cash Return
3.9%
Cap rate
0.7%
Rent to Value Ratio

Active
$1,189,000
4
bds
|
0
ba
|
3,972
sqft
|
built
2014
15026 Blossom Bay Dr, Houston, TX 77059
$-3,008
Cash flow
-13.2%
Cash-on-Cash Return
3.2%
Cap rate
0.5%
Rent to Value Ratio

Active
$190,000
3
bds
|
0
ba
|
1,500
sqft
|
built
1977
12525 Wellington Park Dr, Houston, TX 77072
$-315
Cash flow
-8.6%
Cash-on-Cash Return
4.3%
Cap rate
0.9%
Rent to Value Ratio

Active
$745,000
4
bds
|
0
ba
|
4,922
sqft
|
built
1979
201 Vanderpool Ln, Houston, TX 77024
$-3,327
Cash flow
-23.3%
Cash-on-Cash Return
0.9%
Cap rate
0.4%
Rent to Value Ratio
Active
$164,899
3
bds
|
0
ba
|
1,880
sqft
|
built
2021
5802 Twisted Pine Ct, Houston, TX 77039
$-147
Cash flow
-4.7%
Cash-on-Cash Return
5.2%
Cap rate
1.2%
Rent to Value Ratio

Active
$317,995
2
bds
|
0
ba
|
1,520
sqft
|
built
1967
425 Bendwood Dr, Houston, TX 77024
$-1,119
Cash flow
-18.4%
Cash-on-Cash Return
2.0%
Cap rate
0.7%
Rent to Value Ratio

Active
$110,000
2
bds
|
0
ba
|
1,340
sqft
|
built
1979
12331 W Village Dr, Houston, TX 77039
$130
Cash flow
6.2%
Cash-on-Cash Return
7.7%
Cap rate
1.3%
Rent to Value Ratio

Active
$346,500
4
bds
|
0
ba
|
1,957
sqft
|
built
1997
9143 Bearcove Cir, Houston, TX 77064
$-895
Cash flow
-13.5%
Cash-on-Cash Return
3.2%
Cap rate
0.6%
Rent to Value Ratio

Active
$225,000
2
bds
|
0
ba
|
916
sqft
|
built
1930
3305 Pease St, Houston, TX 77003
$-415
Cash flow
-9.6%
Cash-on-Cash Return
4.1%
Cap rate
0.8%
Rent to Value Ratio