Harris County Investment Properties for Sale
Browse homes for sale and investment properties in Harris County. Refine your search by price, property type, or more.
Best cash flowing properties in Harris County

Active
$45,000
1
bds
|
0
ba
|
700
sqft
|
built
1970
8200 Broadway St, Houston, TX 77061
$426
Cash flow
11.0%
Cash-on-Cash Return
11.4%
Cap rate
2.2%
Rent to Value Ratio
Active
$84,999
2
bds
|
0
ba
|
938
sqft
|
built
1975
8282 Park Place Blvd, Houston, TX 77017
$402
Cash flow
24.7%
Cash-on-Cash Return
11.9%
Cap rate
1.6%
Rent to Value Ratio
10,000 out of 15,733 properties for sale in Harris County
Limited Results Shown
Create a free account, or log in to reveal all property listings and enjoy the complete experience.
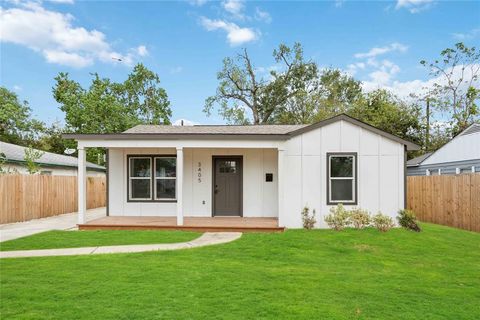
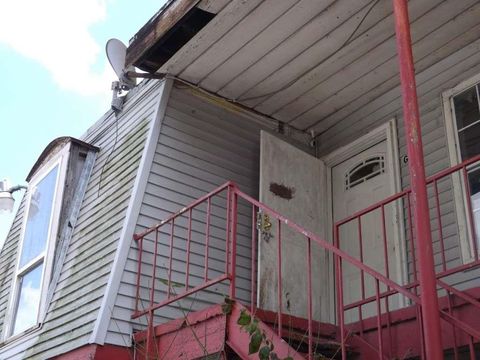
Active
$239,000
3
bds
|
0
ba
|
1,210
sqft
|
built
1945
3405 Mount Pleasant St, Houston, TX 77021
$132
Cash flow
2.9%
Cash-on-Cash Return
6.9%
Cap rate
0.8%
Rent to Value Ratio
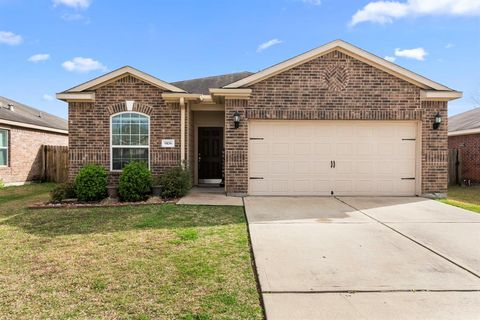
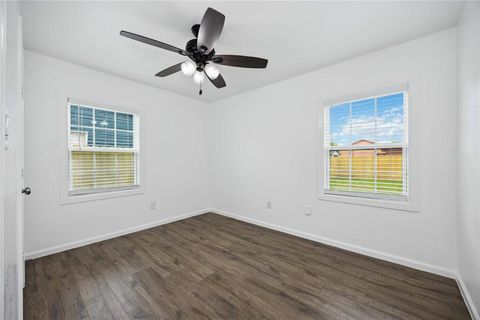
Active
$240,000
3
bds
|
0
ba
|
1,694
sqft
|
built
2015
9106 Stagewood Dr, Humble, TX 77338
$-475
Cash flow
-10.3%
Cash-on-Cash Return
3.9%
Cap rate
0.8%
Rent to Value Ratio
Active
$235,000
4
bds
|
0
ba
|
1,175
sqft
|
built
1960
508 Kalmer St, Pasadena, TX 77502
$-446
Cash flow
-9.9%
Cash-on-Cash Return
4.0%
Cap rate
0.7%
Rent to Value Ratio
Active
$115,000
1
bds
|
0
ba
|
768
sqft
|
built
1963
2744 Briarhurst Dr, Houston, TX 77057
$-272
Cash flow
-12.3%
Cash-on-Cash Return
3.4%
Cap rate
1.1%
Rent to Value Ratio

Active
$121,000
1
bds
|
0
ba
|
698
sqft
|
built
1977
845 Augusta Dr, Houston, TX 77057
$-377
Cash flow
-16.3%
Cash-on-Cash Return
2.5%
Cap rate
1.0%
Rent to Value Ratio
Active
$84,999
2
bds
|
0
ba
|
938
sqft
|
built
1975
8282 Park Place Blvd, Houston, TX 77017
$402
Cash flow
24.7%
Cash-on-Cash Return
11.9%
Cap rate
1.6%
Rent to Value Ratio

Active
$88,000
2
bds
|
0
ba
|
1,092
sqft
|
built
1979
8429 Hearth Dr, Houston, TX 77054
$-163
Cash flow
-9.7%
Cash-on-Cash Return
4.0%
Cap rate
1.5%
Rent to Value Ratio
Active
$330,000
3
bds
|
0
ba
|
2,473
sqft
|
built
2015
12067 Yosemite Glen Trl, Houston, TX 77038
$-970
Cash flow
-15.3%
Cash-on-Cash Return
2.7%
Cap rate
0.7%
Rent to Value Ratio

Active
$1,350,000
4
bds
|
0
ba
|
3,661
sqft
|
built
2019
7502 Little Caprese Ln, Houston, TX 77055
$-3,772
Cash flow
-14.6%
Cash-on-Cash Return
2.9%
Cap rate
0.7%
Rent to Value Ratio
Active
$129,900
2
bds
|
0
ba
|
1,098
sqft
|
built
1981
14555 Wunderlich Dr, Houston, TX 77069
$-331
Cash flow
-13.3%
Cash-on-Cash Return
3.2%
Cap rate
1.1%
Rent to Value Ratio

Active
$94,500
1
bds
|
0
ba
|
760
sqft
|
built
1978
3535 Nasa Pkwy, Seabrook, TX 77586
$-113
Cash flow
-6.2%
Cash-on-Cash Return
4.8%
Cap rate
1.6%
Rent to Value Ratio
Active
$45,000
1
bds
|
0
ba
|
700
sqft
|
built
1970
8200 Broadway St, Houston, TX 77061
$426
Cash flow
11.0%
Cash-on-Cash Return
11.4%
Cap rate
2.2%
Rent to Value Ratio
Active
$289,000
3
bds
|
0
ba
|
1,945
sqft
|
built
2017
9830 Jacy Creek Dr, Tomball, TX 77375
$-652
Cash flow
-11.8%
Cash-on-Cash Return
3.6%
Cap rate
0.8%
Rent to Value Ratio

Active
$360,000
4
bds
|
0
ba
|
2,328
sqft
|
built
2017
21718 Rose Maris Ln, Tomball, TX 77377
$-976
Cash flow
-14.1%
Cash-on-Cash Return
3.0%
Cap rate
0.8%
Rent to Value Ratio
Active
$294,000
4
bds
|
0
ba
|
2,028
sqft
|
built
2005
18307 Shadow Grove Ln, Crosby, TX 77532
$-765
Cash flow
-13.6%
Cash-on-Cash Return
3.1%
Cap rate
0.7%
Rent to Value Ratio
Active
$498,500
3
bds
|
0
ba
|
2,120
sqft
|
built
2018
2620 Rusk St, Houston, TX 77003
$-1,599
Cash flow
-16.7%
Cash-on-Cash Return
2.4%
Cap rate
0.6%
Rent to Value Ratio
Active
$487,000
3
bds
|
0
ba
|
2,514
sqft
|
built
1973
10 S Briar Hollow Ln, Houston, TX 77027
$-1,306
Cash flow
-14.0%
Cash-on-Cash Return
3.0%
Cap rate
0.7%
Rent to Value Ratio
Active
$121,000
2
bds
|
0
ba
|
925
sqft
|
built
1979
2110 Wilcrest Dr, Houston, TX 77042
$-336
Cash flow
-14.5%
Cash-on-Cash Return
2.9%
Cap rate
1.1%
Rent to Value Ratio
Active
$105,000
1
bds
|
0
ba
|
760
sqft
|
built
1980
10555 Turtlewood Ct, Houston, TX 77072
$-277
Cash flow
-13.8%
Cash-on-Cash Return
3.1%
Cap rate
1.0%
Rent to Value Ratio
Active
$115,000
2
bds
|
0
ba
|
1,000
sqft
|
built
1983
2830 S Bartell Dr, Houston, TX 77054
$-272
Cash flow
-12.3%
Cash-on-Cash Return
3.4%
Cap rate
1.1%
Rent to Value Ratio
Active
$80,000
2
bds
|
0
ba
|
1,164
sqft
|
built
1982
10211 Sugar Branch Dr, Houston, TX 77036
$-182
Cash flow
-11.9%
Cash-on-Cash Return
3.5%
Cap rate
1.5%
Rent to Value Ratio
Active
$239,000
2
bds
|
0
ba
|
1,955
sqft
|
built
1983
3350 Mc Cue Rd, Houston, TX 77056
$-1,651
Cash flow
-36.0%
Cash-on-Cash Return
-2.0%
Cap rate
1.4%
Rent to Value Ratio
Active
$152,500
2
bds
|
0
ba
|
909
sqft
|
built
1977
5711 Sugar Hill Dr, Houston, TX 77057
$-573
Cash flow
-19.6%
Cash-on-Cash Return
1.8%
Cap rate
0.9%
Rent to Value Ratio

Active
$450,000
4
bds
|
0
ba
|
2,716
sqft
|
built
2016
18738 Fox Kestrel Trl, Cypress, TX 77429
$-1,476
Cash flow
-17.1%
Cash-on-Cash Return
2.3%
Cap rate
0.6%
Rent to Value Ratio
Active
$505,000
2
bds
|
0
ba
|
3,468
sqft
|
built
1984
9018 Grannis St, Houston, TX 77075
$-2,653
Cash flow
-27.4%
Cash-on-Cash Return
0.0%
Cap rate
0.3%
Rent to Value Ratio
Active
$564,900
3
bds
|
0
ba
|
2,010
sqft
|
built
2016
2101 Menard Ave, Seabrook, TX 77586
$-1,668
Cash flow
-15.4%
Cash-on-Cash Return
2.7%
Cap rate
0.5%
Rent to Value Ratio

Active
$399,900
4
bds
|
0
ba
|
2,612
sqft
|
built
2005
8931 Pine Shores Dr, Humble, TX 77346
$-794
Cash flow
-10.4%
Cash-on-Cash Return
3.9%
Cap rate
0.7%
Rent to Value Ratio
Active
$340,000
3
bds
|
0
ba
|
1,710
sqft
|
built
2018
2027 Tarfite Pl, Houston, TX 77077
$-1,063
Cash flow
-16.3%
Cash-on-Cash Return
2.5%
Cap rate
0.7%
Rent to Value Ratio
Active
$474,900
4
bds
|
0
ba
|
3,419
sqft
|
built
1992
8222 Redchurch Dr, Spring, TX 77379
$-369
Cash flow
-4.1%
Cash-on-Cash Return
5.3%
Cap rate
0.7%
Rent to Value Ratio
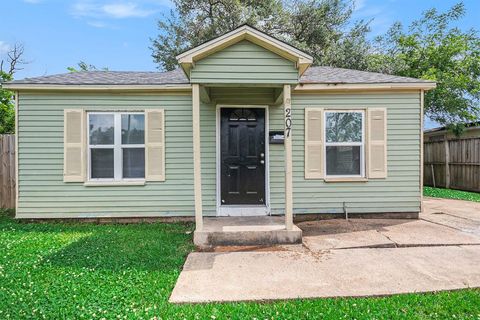
Active
$149,950
3
bds
|
0
ba
|
1,089
sqft
|
built
1944
207 Calvin St, Pasadena, TX 77506
$72
Cash flow
2.5%
Cash-on-Cash Return
6.8%
Cap rate
1.1%
Rent to Value Ratio
Active
$292,499
5
bds
|
0
ba
|
1,709
sqft
|
built
1966
11111 Sagecrest Ln, Houston, TX 77089
$-1,058
Cash flow
-18.9%
Cash-on-Cash Return
1.9%
Cap rate
0.5%
Rent to Value Ratio
Active
$1,300,000
3
bds
|
0
ba
|
2,439
sqft
|
built
1979
18930 Kz Rd, Cypress, TX 77433
$-3,958
Cash flow
-15.9%
Cash-on-Cash Return
2.6%
Cap rate
0.3%
Rent to Value Ratio
Active
$575,000
4
bds
|
0
ba
|
2,727
sqft
|
built
1974
11506 Long Pine Dr, Houston, TX 77077
$-1,882
Cash flow
-17.1%
Cash-on-Cash Return
2.3%
Cap rate
0.5%
Rent to Value Ratio

Active
$404,900
4
bds
|
0
ba
|
2,804
sqft
|
built
2006
16906 Shoal Park Dr, Cypress, TX 77429
$-1,168
Cash flow
-15.1%
Cash-on-Cash Return
2.8%
Cap rate
0.6%
Rent to Value Ratio

Active
$329,000
4
bds
|
0
ba
|
2,523
sqft
|
built
2020
5215 Sunway Dr, Katy, TX 77493
$-776
Cash flow
-12.3%
Cash-on-Cash Return
3.4%
Cap rate
0.8%
Rent to Value Ratio
Active
$139,500
3
bds
|
0
ba
|
1,104
sqft
|
built
1972
7886 Hamlet St, Houston, TX 77078
$376
Cash flow
14.1%
Cash-on-Cash Return
9.5%
Cap rate
1.1%
Rent to Value Ratio
Active
$200,000
3
bds
|
0
ba
|
1,474
sqft
|
built
1972
4435 Mc Cleester Dr, Spring, TX 77373
$-324
Cash flow
-8.5%
Cash-on-Cash Return
4.3%
Cap rate
0.9%
Rent to Value Ratio
Active
$267,500
4
bds
|
0
ba
|
1,613
sqft
|
built
2021
24719 Colony Meadow Trl, Huffman, TX 77336
$-681
Cash flow
-13.3%
Cash-on-Cash Return
3.2%
Cap rate
0.7%
Rent to Value Ratio

Active
$425,000
3
bds
|
0
ba
|
1,893
sqft
|
built
1980
12031 1/2 N L St, La Porte, TX 77571
$-1,293
Cash flow
-15.9%
Cash-on-Cash Return
2.6%
Cap rate
0.5%
Rent to Value Ratio
Active
$150,000
2
bds
|
0
ba
|
1,440
sqft
|
built
1975
11871 Algonquin Dr, Houston, TX 77089
$-237
Cash flow
-8.2%
Cash-on-Cash Return
4.4%
Cap rate
1.1%
Rent to Value Ratio