Harris County Investment Properties for Sale
Browse homes for sale and investment properties in Harris County. Refine your search by price, property type, or more.
Best cash flowing properties in Harris County

Active
$129,000
3
bds
|
0
ba
|
1,094
sqft
|
built
1945
4526 Kingsbury St, Houston, TX 77021
$64
Cash flow
2.6%
Cash-on-Cash Return
6.9%
Cap rate
1.1%
Rent to Value Ratio
Active
$184,500
3
bds
|
0
ba
|
1,069
sqft
|
built
1954
5007 Northridge Dr, Houston, TX 77033
$-16
Cash flow
-0.5%
Cash-on-Cash Return
6.2%
Cap rate
0.9%
Rent to Value Ratio
10,000 out of 15,653 properties for sale in Harris County
Limited Results Shown
Create a free account, or log in to reveal all property listings and enjoy the complete experience.
Active
$464,900
4
bds
|
0
ba
|
2,356
sqft
|
built
2021
20914 Kadefield Dr, Cypress, TX 77433
$-1,537
Cash flow
-17.2%
Cash-on-Cash Return
2.3%
Cap rate
0.7%
Rent to Value Ratio

Active
$550,000
4
bds
|
0
ba
|
3,405
sqft
|
built
2021
15842 Formaston Forest Dr, Humble, TX 77346
$-1,787
Cash flow
-17.0%
Cash-on-Cash Return
2.4%
Cap rate
0.7%
Rent to Value Ratio
Active
$184,500
3
bds
|
0
ba
|
1,069
sqft
|
built
1954
5007 Northridge Dr, Houston, TX 77033
$-16
Cash flow
-0.5%
Cash-on-Cash Return
6.2%
Cap rate
0.9%
Rent to Value Ratio
Active
$395,000
3
bds
|
0
ba
|
2,138
sqft
|
built
2021
21219 Mangrove Ln, Cypress, TX 77433
$-238
Cash flow
-3.1%
Cash-on-Cash Return
5.5%
Cap rate
0.7%
Rent to Value Ratio
Active
$299,900
4
bds
|
0
ba
|
2,468
sqft
|
built
2021
24702 Sierra Laurel Ln, Huffman, TX 77336
$-679
Cash flow
-11.8%
Cash-on-Cash Return
3.5%
Cap rate
0.8%
Rent to Value Ratio
Active
$430,000
4
bds
|
0
ba
|
3,040
sqft
|
built
2021
20002 Roan Ardennes Ln, Tomball, TX 77377
$-1,117
Cash flow
-13.6%
Cash-on-Cash Return
3.1%
Cap rate
0.8%
Rent to Value Ratio
Active
$376,700
4
bds
|
0
ba
|
2,182
sqft
|
built
2012
8934 Finnery Dr, Tomball, TX 77375
$-1,208
Cash flow
-16.7%
Cash-on-Cash Return
2.4%
Cap rate
0.6%
Rent to Value Ratio

Active
$479,999
5
bds
|
0
ba
|
3,040
sqft
|
built
2022
6122 Rice Island Ct, Katy, TX 77493
$-1,639
Cash flow
-17.8%
Cash-on-Cash Return
2.2%
Cap rate
0.7%
Rent to Value Ratio
Active
$179,999
4
bds
|
0
ba
|
1,403
sqft
|
built
1955
5322 Westover St, Houston, TX 77033
$-34
Cash flow
-1.0%
Cash-on-Cash Return
6.0%
Cap rate
0.9%
Rent to Value Ratio
Active
$129,000
3
bds
|
0
ba
|
1,094
sqft
|
built
1945
4526 Kingsbury St, Houston, TX 77021
$64
Cash flow
2.6%
Cash-on-Cash Return
6.9%
Cap rate
1.1%
Rent to Value Ratio

Active
$264,700
3
bds
|
0
ba
|
1,801
sqft
|
built
1965
11723 N Willowdale Cir, Houston, TX 77071
$-547
Cash flow
-10.8%
Cash-on-Cash Return
3.8%
Cap rate
0.7%
Rent to Value Ratio
Active
$415,000
4
bds
|
0
ba
|
3,160
sqft
|
built
2015
23515 Bracino Lake Dr, Katy, TX 77493
$-1,339
Cash flow
-16.8%
Cash-on-Cash Return
2.4%
Cap rate
0.7%
Rent to Value Ratio
Active
$925,000
3
bds
|
0
ba
|
3,168
sqft
|
built
1949
220 Caplin St, Houston, TX 77022
$-2,665
Cash flow
-15.0%
Cash-on-Cash Return
2.8%
Cap rate
0.5%
Rent to Value Ratio
Active
$315,000
4
bds
|
0
ba
|
2,064
sqft
|
built
2020
427 Alaska Cedar Dr, Crosby, TX 77532
$-826
Cash flow
-13.7%
Cash-on-Cash Return
3.1%
Cap rate
0.7%
Rent to Value Ratio

Active
$659,900
5
bds
|
0
ba
|
3,566
sqft
|
built
2021
18018 Texas Wildflower Dr, Cypress, TX 77433
$-2,215
Cash flow
-17.5%
Cash-on-Cash Return
2.2%
Cap rate
0.6%
Rent to Value Ratio
Active
$330,000
2
bds
|
0
ba
|
1,629
sqft
|
built
2021
6402 Pomegranate Blossom Dr, Katy, TX 77493
$-1,269
Cash flow
-20.1%
Cash-on-Cash Return
1.7%
Cap rate
0.7%
Rent to Value Ratio
Active
$379,000
4
bds
|
0
ba
|
2,048
sqft
|
built
2018
2323 Foley Rd, Crosby, TX 77532
$-984
Cash flow
-13.5%
Cash-on-Cash Return
3.2%
Cap rate
0.7%
Rent to Value Ratio
Active
$300,000
5
bds
|
0
ba
|
3,232
sqft
|
built
1960
5733 Schutz St, Houston, TX 77032
$-101
Cash flow
-1.8%
Cash-on-Cash Return
5.9%
Cap rate
1.0%
Rent to Value Ratio
Active
$464,999
4
bds
|
0
ba
|
3,392
sqft
|
built
2018
14907 Somerset Horizon Ln, Houston, TX 77044
$-1,338
Cash flow
-15.0%
Cash-on-Cash Return
2.8%
Cap rate
0.8%
Rent to Value Ratio

Active
$357,500
3
bds
|
0
ba
|
2,099
sqft
|
built
2019
24310 Twin Cove Ct, Katy, TX 77493
$-1,183
Cash flow
-17.3%
Cash-on-Cash Return
2.3%
Cap rate
0.7%
Rent to Value Ratio
Active
$369,000
3
bds
|
0
ba
|
1,638
sqft
|
built
1960
5471 Kuldell Dr, Houston, TX 77096
$-966
Cash flow
-13.7%
Cash-on-Cash Return
3.1%
Cap rate
0.6%
Rent to Value Ratio

Active
$635,000
4
bds
|
0
ba
|
3,600
sqft
|
built
2018
7407 Tudor Heights Ln, Spring, TX 77379
$-1,800
Cash flow
-14.8%
Cash-on-Cash Return
2.9%
Cap rate
0.6%
Rent to Value Ratio

Active
$674,000
4
bds
|
0
ba
|
3,619
sqft
|
built
2019
18311 Windspring Falls Ln, Cypress, TX 77433
$-2,440
Cash flow
-18.9%
Cash-on-Cash Return
1.9%
Cap rate
0.6%
Rent to Value Ratio

Active
$295,000
3
bds
|
0
ba
|
2,020
sqft
|
built
2000
19915 Mason Creek Dr, Katy, TX 77449
$-689
Cash flow
-12.2%
Cash-on-Cash Return
3.5%
Cap rate
0.7%
Rent to Value Ratio
Active
$2,900,000
3
bds
|
0
ba
|
9,640
sqft
|
built
1955
2703 Mason St, Houston, TX 77006
$-16,304
Cash flow
-29.3%
Cash-on-Cash Return
-0.5%
Cap rate
0.1%
Rent to Value Ratio
Active
$390,000
4
bds
|
0
ba
|
2,200
sqft
|
built
2020
12314 Macbrice Ln, Humble, TX 77346
$-1,165
Cash flow
-15.6%
Cash-on-Cash Return
2.7%
Cap rate
0.7%
Rent to Value Ratio
Active
$356,000
4
bds
|
0
ba
|
3,076
sqft
|
built
2019
12311 Summerbrook Dr, Houston, TX 77066
$-928
Cash flow
-13.6%
Cash-on-Cash Return
3.1%
Cap rate
0.7%
Rent to Value Ratio

Active
$339,900
4
bds
|
0
ba
|
2,400
sqft
|
built
2020
15314 Stulan Burn Dr, Humble, TX 77346
$-893
Cash flow
-13.7%
Cash-on-Cash Return
3.1%
Cap rate
0.8%
Rent to Value Ratio

Active
$310,000
3
bds
|
0
ba
|
1,869
sqft
|
built
2020
22510 Red Sparrow Dr, Hockley, TX 77447
$-931
Cash flow
-15.7%
Cash-on-Cash Return
2.7%
Cap rate
0.6%
Rent to Value Ratio

Active
$329,000
5
bds
|
0
ba
|
2,648
sqft
|
built
2019
22619 Cloverland Field Dr, Hockley, TX 77447
$-756
Cash flow
-12.0%
Cash-on-Cash Return
3.5%
Cap rate
0.8%
Rent to Value Ratio
Active
$260,000
3
bds
|
0
ba
|
2,986
sqft
|
built
1981
11280 Braes Forest Dr, Houston, TX 77071
$-37
Cash flow
-0.7%
Cash-on-Cash Return
6.1%
Cap rate
1.1%
Rent to Value Ratio

Active
$549,000
3
bds
|
0
ba
|
2,184
sqft
|
built
1978
6000 Sugar Hill Dr, Houston, TX 77057
$-2,079
Cash flow
-19.8%
Cash-on-Cash Return
1.7%
Cap rate
0.5%
Rent to Value Ratio

Active
$182,000
3
bds
|
0
ba
|
1,200
sqft
|
built
1968
2101 Fountain View Dr, Houston, TX 77057
$-586
Cash flow
-16.8%
Cash-on-Cash Return
2.4%
Cap rate
1.0%
Rent to Value Ratio
Active
$99,500
1
bds
|
0
ba
|
676
sqft
|
built
1978
10051 Westpark Dr, Houston, TX 77042
$-248
Cash flow
-13.0%
Cash-on-Cash Return
3.3%
Cap rate
1.0%
Rent to Value Ratio
Active
$395,000
4
bds
|
0
ba
|
2,494
sqft
|
built
2018
18506 Gardens End Ln, Houston, TX 77084
$-1,046
Cash flow
-13.8%
Cash-on-Cash Return
3.1%
Cap rate
0.7%
Rent to Value Ratio
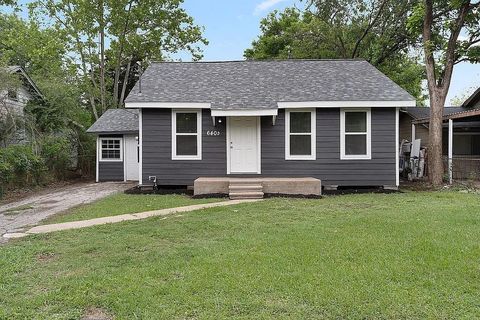
Active
$185,000
2
bds
|
0
ba
|
960
sqft
|
built
1950
6403 Gainesville St, Houston, TX 77020
$-259
Cash flow
-7.3%
Cash-on-Cash Return
4.6%
Cap rate
0.9%
Rent to Value Ratio
Active
$336,000
4
bds
|
0
ba
|
2,513
sqft
|
built
2018
16659 Bluefin St, Crosby, TX 77532
$-740
Cash flow
-11.5%
Cash-on-Cash Return
3.6%
Cap rate
0.7%
Rent to Value Ratio

Active
$100,000
2
bds
|
0
ba
|
923
sqft
|
built
1977
9009 Richmond Ave, Houston, TX 77063
$-205
Cash flow
-10.7%
Cash-on-Cash Return
3.8%
Cap rate
1.3%
Rent to Value Ratio
Active
$390,000
4
bds
|
0
ba
|
3,251
sqft
|
built
1999
155 Perfidia Dr, Houston, TX 77015
$-937
Cash flow
-12.5%
Cash-on-Cash Return
3.4%
Cap rate
0.7%
Rent to Value Ratio

Active
$1,600,000
5
bds
|
0
ba
|
5,676
sqft
|
built
2018
18011 Blue Ridge Shores Dr, Cypress, TX 77433
$-6,050
Cash flow
-19.7%
Cash-on-Cash Return
1.7%
Cap rate
0.4%
Rent to Value Ratio