Harris County Investment Properties for Sale
Browse homes for sale and investment properties in Harris County. Refine your search by price, property type, or more.
Best cash flowing properties in Harris County
Active
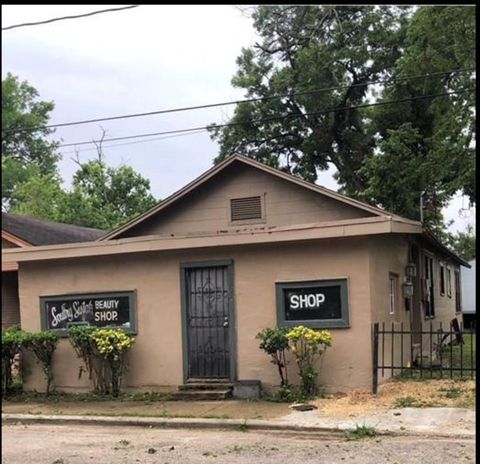
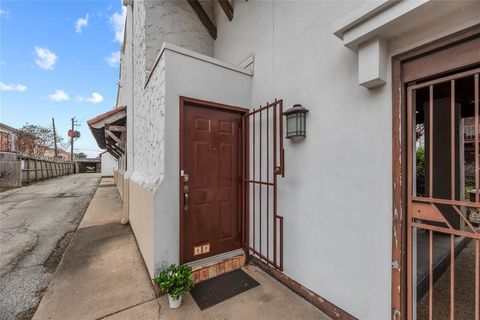
$125,000
2
bds
|
0
ba
|
1,332
sqft
|
built
1930
2826 Drew St, Houston, TX 77004
$192
Cash flow
8.0%
Cash-on-Cash Return
8.1%
Cap rate
1.4%
Rent to Value Ratio
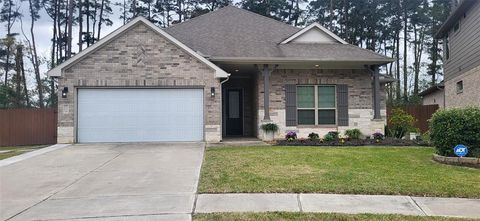
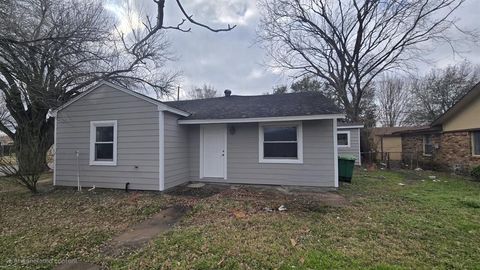
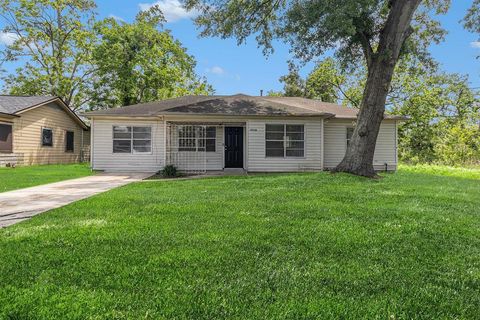
Active
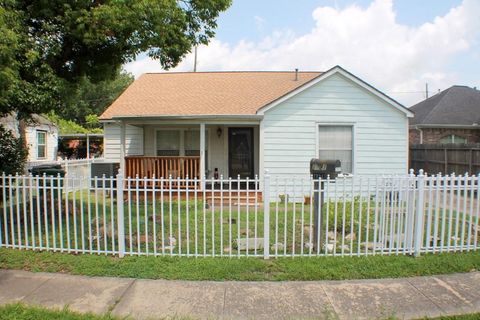
$284,900
3
bds
|
0
ba
|
1,300
sqft
|
built
1955
241 Norview Dr, Houston, TX 77022
$31
Cash flow
0.6%
Cash-on-Cash Return
6.4%
Cap rate
0.8%
Rent to Value Ratio
10,000 out of 15,655 properties for sale in Harris County
Limited Results Shown
Create a free account, or log in to reveal all property listings and enjoy the complete experience.
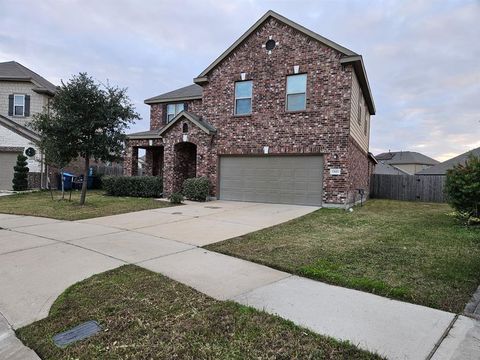
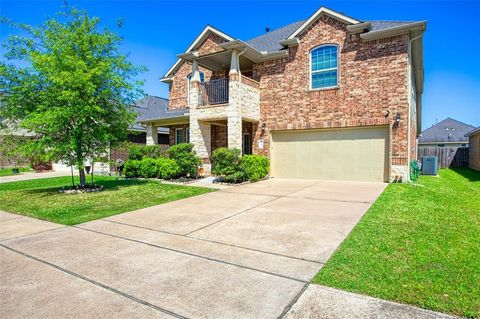
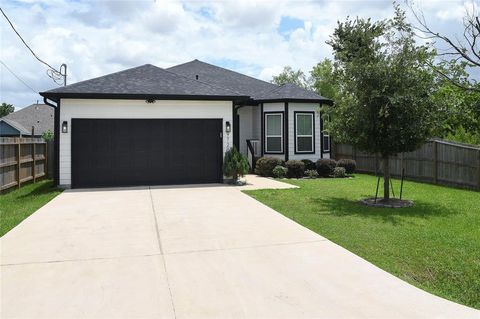
Active
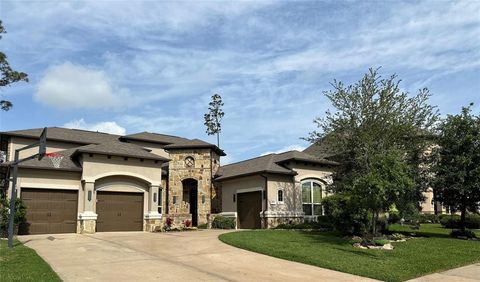
$379,900
4
bds
|
0
ba
|
2,558
sqft
|
built
2020
8506 Rialto Canal Loop, Houston, TX 77044
$-986
Cash flow
-13.5%
Cash-on-Cash Return
3.1%
Cap rate
0.8%
Rent to Value Ratio

Active
$329,000
2
bds
|
0
ba
|
1,424
sqft
|
built
2017
4136 Willowbend Blvd, Houston, TX 77025
$-791
Cash flow
-12.5%
Cash-on-Cash Return
3.4%
Cap rate
0.8%
Rent to Value Ratio
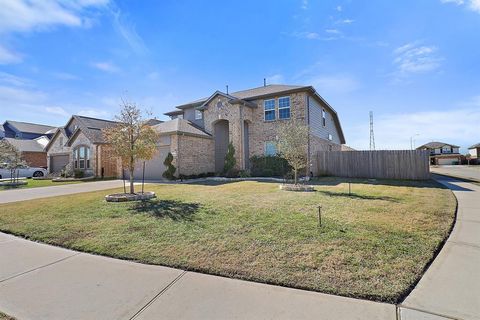
Active
$385,000
4
bds
|
0
ba
|
3,311
sqft
|
built
2016
15615 Carberry Hills Ct, Houston, TX 77044
$-1,010
Cash flow
-13.7%
Cash-on-Cash Return
3.1%
Cap rate
0.8%
Rent to Value Ratio
Active
$115,000
1
bds
|
0
ba
|
768
sqft
|
built
1963
2744 Briarhurst Dr, Houston, TX 77057
$-272
Cash flow
-12.3%
Cash-on-Cash Return
3.4%
Cap rate
1.1%
Rent to Value Ratio
Active
$269,000
3
bds
|
0
ba
|
1,403
sqft
|
built
1981
17311 Lowick St, Spring, TX 77379
$-598
Cash flow
-11.6%
Cash-on-Cash Return
3.6%
Cap rate
0.7%
Rent to Value Ratio

Active
$200,000
3
bds
|
0
ba
|
1,008
sqft
|
built
1958
6347 Thornwall St, Houston, TX 77092
$-339
Cash flow
-8.8%
Cash-on-Cash Return
4.2%
Cap rate
0.8%
Rent to Value Ratio
Active
$229,800
3
bds
|
0
ba
|
1,485
sqft
|
built
1952
5879 Belcrest St, Houston, TX 77033
$-78
Cash flow
-1.8%
Cash-on-Cash Return
5.9%
Cap rate
0.9%
Rent to Value Ratio
Active
$238,000
3
bds
|
0
ba
|
1,560
sqft
|
built
1941
7721 Brumblay St, Houston, TX 77012
$-316
Cash flow
-6.9%
Cash-on-Cash Return
4.7%
Cap rate
0.8%
Rent to Value Ratio
Active
$199,000
2
bds
|
0
ba
|
884
sqft
|
built
1965
1205 Autrey St, Houston, TX 77006
$-612
Cash flow
-16.0%
Cash-on-Cash Return
2.6%
Cap rate
0.8%
Rent to Value Ratio
Active
$420,000
5
bds
|
0
ba
|
2,842
sqft
|
built
2014
1242 S Maple Dr, Katy, TX 77493
$-1,086
Cash flow
-13.5%
Cash-on-Cash Return
3.2%
Cap rate
0.7%
Rent to Value Ratio

Active
$799,999
5
bds
|
0
ba
|
5,132
sqft
|
built
2014
2607 Tree Swallow Bluff Path, Spring, TX 77389
$-3,451
Cash flow
-22.5%
Cash-on-Cash Return
1.1%
Cap rate
0.6%
Rent to Value Ratio

Active
$220,000
3
bds
|
0
ba
|
1,397
sqft
|
built
1978
22910 Summer Green Ln, Spring, TX 77373
$-362
Cash flow
-8.6%
Cash-on-Cash Return
4.3%
Cap rate
0.8%
Rent to Value Ratio
Active
$260,000
3
bds
|
0
ba
|
1,852
sqft
|
built
1983
2618 Gilliom Dr, Houston, TX 77084
$-463
Cash flow
-9.3%
Cash-on-Cash Return
4.1%
Cap rate
0.8%
Rent to Value Ratio

Active
$630,000
4
bds
|
0
ba
|
2,770
sqft
|
built
2009
214 Pinto Point Dr, Spring, TX 77389
$-1,597
Cash flow
-13.2%
Cash-on-Cash Return
3.2%
Cap rate
0.6%
Rent to Value Ratio
Active
$675,000
4
bds
|
0
ba
|
3,998
sqft
|
built
2015
18010 Langkawi Ln, Houston, TX 77044
$-1,985
Cash flow
-15.3%
Cash-on-Cash Return
2.7%
Cap rate
0.7%
Rent to Value Ratio
Active
$690,000
4
bds
|
0
ba
|
3,960
sqft
|
built
2015
18931 Winding Atwood Ln, Tomball, TX 77377
$-1,958
Cash flow
-14.8%
Cash-on-Cash Return
2.9%
Cap rate
0.7%
Rent to Value Ratio
Active
$284,900
3
bds
|
0
ba
|
1,300
sqft
|
built
1955
241 Norview Dr, Houston, TX 77022
$31
Cash flow
0.6%
Cash-on-Cash Return
6.4%
Cap rate
0.8%
Rent to Value Ratio
Active
$238,500
4
bds
|
0
ba
|
1,656
sqft
|
built
1955
8654 Tilgham St, Houston, TX 77029
$-108
Cash flow
-2.4%
Cash-on-Cash Return
5.7%
Cap rate
0.8%
Rent to Value Ratio
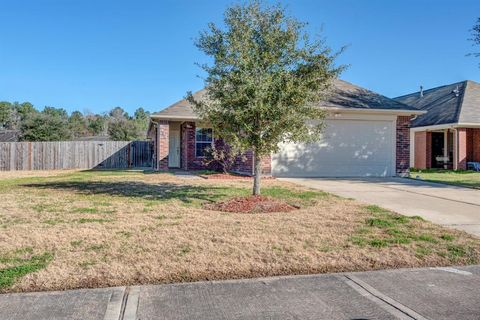
Active
$309,000
3
bds
|
0
ba
|
1,868
sqft
|
built
2016
1326 Tee Time Ct, Crosby, TX 77532
$-721
Cash flow
-12.2%
Cash-on-Cash Return
3.5%
Cap rate
0.7%
Rent to Value Ratio
Active
$255,000
3
bds
|
0
ba
|
1,460
sqft
|
built
2017
3103 Same Way, Humble, TX 77339
$-583
Cash flow
-11.9%
Cash-on-Cash Return
3.5%
Cap rate
0.7%
Rent to Value Ratio
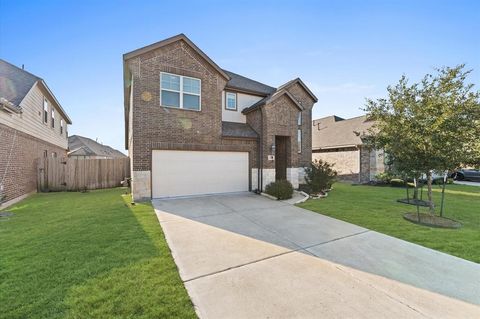
Active
$325,000
4
bds
|
0
ba
|
1,995
sqft
|
built
2015
8138 Heartbrook Field Ln, Cypress, TX 77433
$-942
Cash flow
-15.1%
Cash-on-Cash Return
2.8%
Cap rate
0.7%
Rent to Value Ratio

Active
$374,900
3
bds
|
0
ba
|
2,353
sqft
|
built
2016
22610 Cutter Mill Dr, Spring, TX 77389
$-1,102
Cash flow
-15.3%
Cash-on-Cash Return
2.7%
Cap rate
0.7%
Rent to Value Ratio
Active
$798,888
3
bds
|
0
ba
|
2,637
sqft
|
built
2019
861 Dunleigh Meadows Ln, Houston, TX 77055
$-2,650
Cash flow
-17.3%
Cash-on-Cash Return
2.3%
Cap rate
0.6%
Rent to Value Ratio
Active
$209,999
3
bds
|
0
ba
|
1,184
sqft
|
built
1960
603 Maple Way, Houston, TX 77015
$-33
Cash flow
-0.8%
Cash-on-Cash Return
6.1%
Cap rate
0.9%
Rent to Value Ratio
Active
$264,900
4
bds
|
0
ba
|
1,994
sqft
|
built
1984
5326 Pine Cliff Dr, Houston, TX 77084
$-355
Cash flow
-7.0%
Cash-on-Cash Return
4.7%
Cap rate
0.8%
Rent to Value Ratio
Active
$168,000
3
bds
|
0
ba
|
1,044
sqft
|
built
1930
4924 Curtin St, Houston, TX 77023
$-372
Cash flow
-11.6%
Cash-on-Cash Return
3.6%
Cap rate
0.8%
Rent to Value Ratio
Active
$975,000
5
bds
|
0
ba
|
4,745
sqft
|
built
1983
4907 Pine Garden Dr, Kingwood, TX 77345
$-1,538
Cash flow
-8.2%
Cash-on-Cash Return
4.4%
Cap rate
0.7%
Rent to Value Ratio
Active
$409,900
4
bds
|
0
ba
|
2,360
sqft
|
built
1989
15411 Robin Grove Ct, Cypress, TX 77433
$-594
Cash flow
-7.6%
Cash-on-Cash Return
4.5%
Cap rate
0.8%
Rent to Value Ratio
Active
$295,000
4
bds
|
0
ba
|
2,064
sqft
|
built
2021
14502 Myrtle Hill Dr, Houston, TX 77069
$-806
Cash flow
-14.3%
Cash-on-Cash Return
3.0%
Cap rate
0.7%
Rent to Value Ratio

Active
$714,990
5
bds
|
0
ba
|
3,854
sqft
|
built
2021
21118 Chelton Beach Dr, Cypress, TX 77433
$-1,665
Cash flow
-12.1%
Cash-on-Cash Return
3.5%
Cap rate
0.6%
Rent to Value Ratio
Active
$289,000
3
bds
|
0
ba
|
1,697
sqft
|
built
2020
9720 Garcroft St, Houston, TX 77029
$-863
Cash flow
-15.6%
Cash-on-Cash Return
2.7%
Cap rate
0.6%
Rent to Value Ratio
Active
$165,000
3
bds
|
0
ba
|
1,281
sqft
|
built
1961
10338 Castleton St, Houston, TX 77016
$-150
Cash flow
-4.7%
Cash-on-Cash Return
5.2%
Cap rate
0.8%
Rent to Value Ratio
Active
$335,000
4
bds
|
0
ba
|
2,412
sqft
|
built
2018
4502 Crescent Lake Cir, Baytown, TX 77521
$-775
Cash flow
-12.1%
Cash-on-Cash Return
3.5%
Cap rate
0.7%
Rent to Value Ratio

Active
$259,000
4
bds
|
0
ba
|
1,614
sqft
|
built
2021
1830 William Scott St, Baytown, TX 77523
$-347
Cash flow
-7.0%
Cash-on-Cash Return
4.7%
Cap rate
0.9%
Rent to Value Ratio
Active
$390,000
4
bds
|
0
ba
|
3,028
sqft
|
built
2020
31423 Elkcreek Bend Dr, Hockley, TX 77447
$-1,049
Cash flow
-14.0%
Cash-on-Cash Return
3.0%
Cap rate
0.7%
Rent to Value Ratio

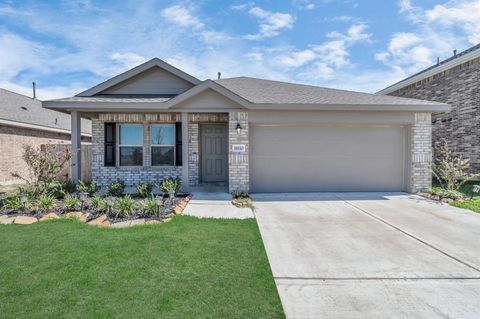
Active
$278,900
3
bds
|
0
ba
|
1,677
sqft
|
built
2022
22606 Rosy Heights Trl, Tomball, TX 77377
$14
Cash flow
0.3%
Cash-on-Cash Return
6.3%
Cap rate
0.8%
Rent to Value Ratio
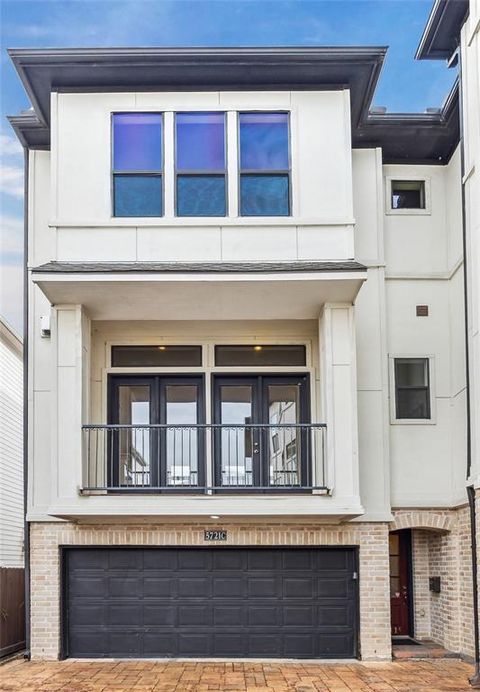
Active
$495,000
3
bds
|
0
ba
|
2,964
sqft
|
built
2009
5721 Kiam St, Houston, TX 77007
$-1,343
Cash flow
-14.2%
Cash-on-Cash Return
3.0%
Cap rate
0.6%
Rent to Value Ratio
Active
$279,000
3
bds
|
0
ba
|
1,535
sqft
|
built
2022
18110 Mendocino Ridge Ln, Hockley, TX 77447
$-802
Cash flow
-15.0%
Cash-on-Cash Return
2.8%
Cap rate
0.7%
Rent to Value Ratio
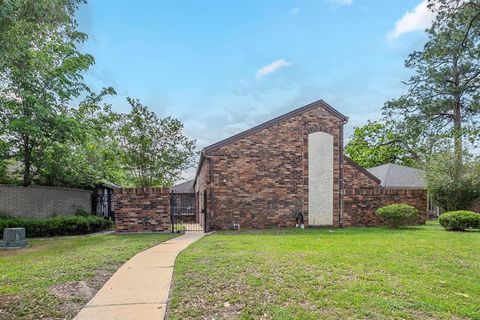
Active
$254,000
2
bds
|
0
ba
|
1,936
sqft
|
built
1977
5893 Southern Hills Dr, Houston, TX 77069
$-458
Cash flow
-9.4%
Cash-on-Cash Return
4.1%
Cap rate
0.8%
Rent to Value Ratio
Active
$125,000
2
bds
|
0
ba
|
1,332
sqft
|
built
1930
2826 Drew St, Houston, TX 77004
$192
Cash flow
8.0%
Cash-on-Cash Return
8.1%
Cap rate
1.4%
Rent to Value Ratio