Harris County Investment Properties for Sale
Browse homes for sale and investment properties in Harris County. Refine your search by price, property type, or more.
Best cash flowing properties in Harris County

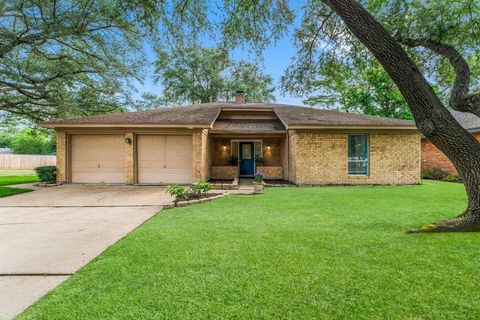
Active
$189,950
4
bds
|
0
ba
|
1,588
sqft
|
built
1980
12719 Panay Dr, Houston, TX 77048
$0
Cash flow
0.0%
Cash-on-Cash Return
6.3%
Cap rate
0.9%
Rent to Value Ratio
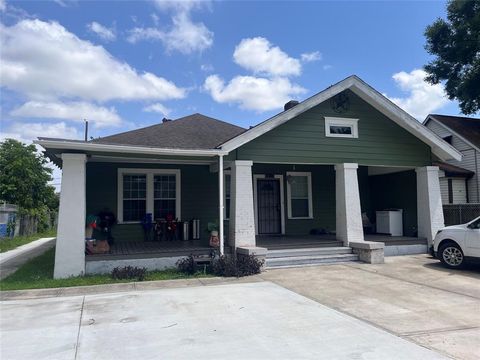
Active
$839,999
3
bds
|
0
ba
|
2,575
sqft
|
built
2015
1136 Aurora St, Houston, TX 77009
$-38
Cash flow
-0.2%
Cash-on-Cash Return
6.2%
Cap rate
0.8%
Rent to Value Ratio
10,000 out of 15,733 properties for sale in Harris County
Limited Results Shown
Create a free account, or log in to reveal all property listings and enjoy the complete experience.
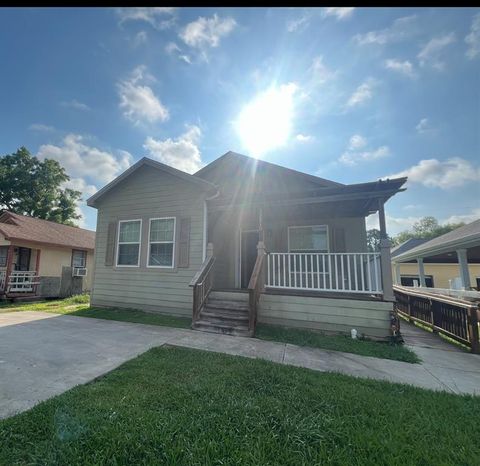
Active
$249,900
4
bds
|
0
ba
|
1,812
sqft
|
built
2011
16239 Silver Wing Ln, Hockley, TX 77447
$-643
Cash flow
-13.4%
Cash-on-Cash Return
3.2%
Cap rate
0.7%
Rent to Value Ratio
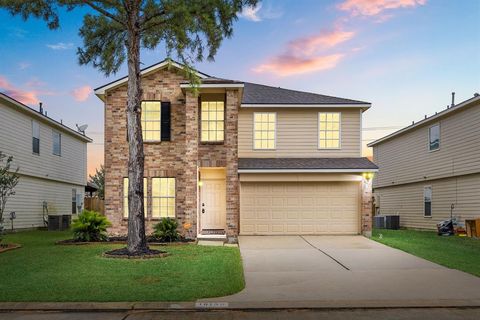
Active
$307,000
5
bds
|
0
ba
|
2,212
sqft
|
built
2007
9838 W Jennifer Way Dr, Houston, TX 77075
$-648
Cash flow
-11.0%
Cash-on-Cash Return
3.7%
Cap rate
0.7%
Rent to Value Ratio

Active
$439,900
5
bds
|
0
ba
|
3,582
sqft
|
built
1998
16939 Sandestine Dr, Houston, TX 77095
$-707
Cash flow
-8.4%
Cash-on-Cash Return
4.3%
Cap rate
0.8%
Rent to Value Ratio
Active
$839,999
3
bds
|
0
ba
|
2,575
sqft
|
built
2015
1136 Aurora St, Houston, TX 77009
$-38
Cash flow
-0.2%
Cash-on-Cash Return
6.2%
Cap rate
0.8%
Rent to Value Ratio
Active
$690,000
4
bds
|
0
ba
|
4,119
sqft
|
built
2015
8215 Frontenac Dr, Houston, TX 77071
$-2,773
Cash flow
-21.0%
Cash-on-Cash Return
1.4%
Cap rate
0.4%
Rent to Value Ratio
Active
$394,400
4
bds
|
0
ba
|
2,912
sqft
|
built
2016
18539 Windy Knoll Way, Houston, TX 77084
$-905
Cash flow
-12.0%
Cash-on-Cash Return
3.5%
Cap rate
0.7%
Rent to Value Ratio
Active
$280,000
3
bds
|
0
ba
|
1,982
sqft
|
built
2018
2415 Fallen Pine Ln, Houston, TX 77088
$-706
Cash flow
-13.2%
Cash-on-Cash Return
3.2%
Cap rate
0.7%
Rent to Value Ratio
Active
$330,000
3
bds
|
0
ba
|
1,972
sqft
|
built
2017
10551 Logger Pine Trl, Houston, TX 77088
$-962
Cash flow
-15.2%
Cash-on-Cash Return
2.8%
Cap rate
0.6%
Rent to Value Ratio
Active
$189,950
4
bds
|
0
ba
|
1,588
sqft
|
built
1980
12719 Panay Dr, Houston, TX 77048
$0
Cash flow
0.0%
Cash-on-Cash Return
6.3%
Cap rate
0.9%
Rent to Value Ratio

Active
$299,000
3
bds
|
0
ba
|
2,032
sqft
|
built
2015
9154 Sunlight Oak Ln, Houston, TX 77070
$-909
Cash flow
-15.9%
Cash-on-Cash Return
2.6%
Cap rate
0.8%
Rent to Value Ratio
Active
$380,000
4
bds
|
0
ba
|
2,767
sqft
|
built
2015
18226 Golden Falls Ln, Spring, TX 77379
$-115
Cash flow
-1.6%
Cash-on-Cash Return
5.9%
Cap rate
0.7%
Rent to Value Ratio
Active
$299,000
3
bds
|
0
ba
|
1,600
sqft
|
built
2015
10739 Chestnut Path Way, Tomball, TX 77375
$-829
Cash flow
-14.5%
Cash-on-Cash Return
2.9%
Cap rate
0.6%
Rent to Value Ratio
Active
$749,000
2
bds
|
0
ba
|
1,281
sqft
|
built
1920
401 Arlington St, Houston, TX 77007
$-3,629
Cash flow
-25.3%
Cash-on-Cash Return
0.5%
Cap rate
0.2%
Rent to Value Ratio
Active
$220,000
3
bds
|
0
ba
|
1,350
sqft
|
built
1950
14614 Force St, Houston, TX 77015
$-242
Cash flow
-5.7%
Cash-on-Cash Return
4.9%
Cap rate
0.7%
Rent to Value Ratio

Active
$205,900
4
bds
|
0
ba
|
1,328
sqft
|
built
1951
5033 Doolittle Blvd, Houston, TX 77033
$-174
Cash flow
-4.4%
Cash-on-Cash Return
5.3%
Cap rate
0.9%
Rent to Value Ratio

Active
$23,500,000
4
bds
|
0
ba
|
15,791
sqft
|
built
2011
3 Briarwood Ct, Houston, TX 77019
$-150,009
Cash flow
-33.3%
Cash-on-Cash Return
-1.4%
Cap rate
0.0%
Rent to Value Ratio

Active
$220,000
2
bds
|
0
ba
|
1,057
sqft
|
built
1995
1330 Old Spanish Trl, Houston, TX 77054
$-797
Cash flow
-18.9%
Cash-on-Cash Return
1.9%
Cap rate
0.8%
Rent to Value Ratio
Active
$1,199,000
3
bds
|
0
ba
|
2,979
sqft
|
built
1929
2108 Branard St, Houston, TX 77098
$-3,504
Cash flow
-15.2%
Cash-on-Cash Return
2.8%
Cap rate
0.5%
Rent to Value Ratio
Active
$1,400,000
4
bds
|
0
ba
|
3,336
sqft
|
built
1936
1216 S Shepherd Dr, Houston, TX 77019
$-5,451
Cash flow
-20.3%
Cash-on-Cash Return
1.6%
Cap rate
0.4%
Rent to Value Ratio

Active
$349,500
4
bds
|
0
ba
|
1,860
sqft
|
built
1985
22426 Cove Hollow Dr, Katy, TX 77450
$-780
Cash flow
-11.6%
Cash-on-Cash Return
3.6%
Cap rate
0.7%
Rent to Value Ratio

Active
$360,000
3
bds
|
0
ba
|
2,262
sqft
|
built
2005
1417 Live Oak St, Houston, TX 77003
$-737
Cash flow
-10.7%
Cash-on-Cash Return
3.8%
Cap rate
0.8%
Rent to Value Ratio
Active
$110,000
3
bds
|
0
ba
|
1,182
sqft
|
built
1976
8100 Creekbend Dr, Houston, TX 77071
$-150
Cash flow
-7.1%
Cash-on-Cash Return
4.6%
Cap rate
1.2%
Rent to Value Ratio
Active
$575,000
3
bds
|
0
ba
|
2,180
sqft
|
built
1983
456 S Burnett Dr, Baytown, TX 77520
$-2,067
Cash flow
-18.8%
Cash-on-Cash Return
2.0%
Cap rate
0.4%
Rent to Value Ratio
Active
$204,900
1
bds
|
0
ba
|
819
sqft
|
built
2008
2203 Dorrington St, Houston, TX 77030
$-829
Cash flow
-21.1%
Cash-on-Cash Return
1.4%
Cap rate
0.8%
Rent to Value Ratio

Active
$3,995,000
5
bds
|
0
ba
|
5,808
sqft
|
built
2006
11550 N Lou Al Dr, Houston, TX 77024
$-21,366
Cash flow
-27.9%
Cash-on-Cash Return
-0.2%
Cap rate
0.1%
Rent to Value Ratio
Active
$269,990
4
bds
|
0
ba
|
2,141
sqft
|
built
1978
6103 Sunnygate Dr, Spring, TX 77373
$-550
Cash flow
-10.6%
Cash-on-Cash Return
3.8%
Cap rate
0.7%
Rent to Value Ratio
Active
$240,000
2
bds
|
0
ba
|
1,548
sqft
|
built
1932
8015 Joplin St, Houston, TX 77017
$-295
Cash flow
-6.4%
Cash-on-Cash Return
4.8%
Cap rate
0.8%
Rent to Value Ratio

Active
$229,000
2
bds
|
0
ba
|
1,492
sqft
|
built
2009
8715 Meadowcroft Dr, Houston, TX 77063
$-448
Cash flow
-10.2%
Cash-on-Cash Return
3.9%
Cap rate
1.0%
Rent to Value Ratio
Active
$140,000
3
bds
|
0
ba
|
972
sqft
|
built
2015
12510 Judge St, Crosby, TX 77532
$-82
Cash flow
-3.1%
Cash-on-Cash Return
5.6%
Cap rate
1.0%
Rent to Value Ratio

Active
$525,000
2
bds
|
0
ba
|
1,961
sqft
|
built
2005
5005 Hidalgo St, Houston, TX 77056
$-2,231
Cash flow
-22.2%
Cash-on-Cash Return
1.2%
Cap rate
0.7%
Rent to Value Ratio

Active
$525,000
4
bds
|
0
ba
|
3,085
sqft
|
built
2011
10518 Kicking Horse Pass, Cypress, TX 77433
$-1,151
Cash flow
-11.4%
Cash-on-Cash Return
3.6%
Cap rate
0.7%
Rent to Value Ratio
Active
$334,500
4
bds
|
0
ba
|
3,340
sqft
|
built
2005
19130 Yaupon Ranch Dr, Cypress, TX 77433
$-744
Cash flow
-11.6%
Cash-on-Cash Return
3.6%
Cap rate
0.7%
Rent to Value Ratio

Active
$425,000
3
bds
|
0
ba
|
1,647
sqft
|
built
2022
2409 Webster St, Houston, TX 77003
$-983
Cash flow
-12.1%
Cash-on-Cash Return
3.5%
Cap rate
0.7%
Rent to Value Ratio
Active
$349,000
2
bds
|
0
ba
|
1,017
sqft
|
built
2001
2400 Mc Cue Rd, Houston, TX 77056
$-1,740
Cash flow
-26.0%
Cash-on-Cash Return
0.3%
Cap rate
0.6%
Rent to Value Ratio

Active
$285,000
3
bds
|
0
ba
|
1,689
sqft
|
built
1982
6411 Gleneagles Dr, Pasadena, TX 77505
$-401
Cash flow
-7.3%
Cash-on-Cash Return
4.6%
Cap rate
0.8%
Rent to Value Ratio
Active
$197,250
4
bds
|
0
ba
|
1,679
sqft
|
built
1964
2146 Minnesota St, Houston, TX 77034
$-193
Cash flow
-5.1%
Cash-on-Cash Return
5.1%
Cap rate
0.9%
Rent to Value Ratio

Active
$329,000
2
bds
|
0
ba
|
1,600
sqft
|
built
1937
4014 Hardy St, Houston, TX 77009
$-644
Cash flow
-10.2%
Cash-on-Cash Return
3.9%
Cap rate
0.7%
Rent to Value Ratio
Active
$268,000
4
bds
|
0
ba
|
2,292
sqft
|
built
2004
12251 Noco Dr, Tomball, TX 77375
$-600
Cash flow
-11.7%
Cash-on-Cash Return
3.6%
Cap rate
0.7%
Rent to Value Ratio

Active
$255,000
3
bds
|
0
ba
|
1,860
sqft
|
built
2003
3703 Ashford Villa Ln, Houston, TX 77082
$-548
Cash flow
-11.2%
Cash-on-Cash Return
3.7%
Cap rate
0.8%
Rent to Value Ratio
Active
$389,990
3
bds
|
0
ba
|
2,688
sqft
|
built
1983
11202 Crayford Ct, Houston, TX 77065
$-1,050
Cash flow
-14.0%
Cash-on-Cash Return
3.0%
Cap rate
0.6%
Rent to Value Ratio