Harris County Investment Properties for Sale
Browse homes for sale and investment properties in Harris County. Refine your search by price, property type, or more.
Best cash flowing properties in Harris County

Active
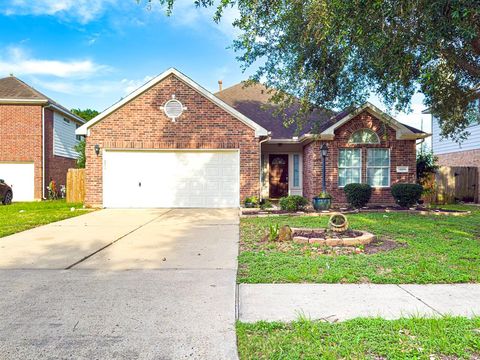
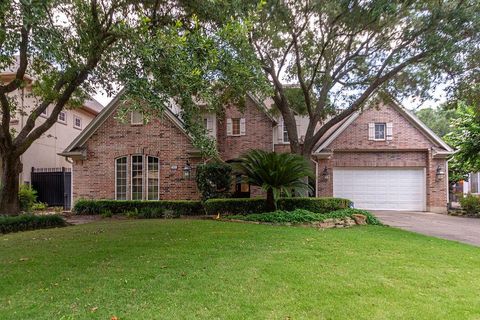
$565,000
4
bds
|
0
ba
|
3,121
sqft
|
built
2021
11903 Muir Groves Trl, Humble, TX 77346
$86
Cash flow
0.8%
Cash-on-Cash Return
6.4%
Cap rate
0.8%
Rent to Value Ratio

Active
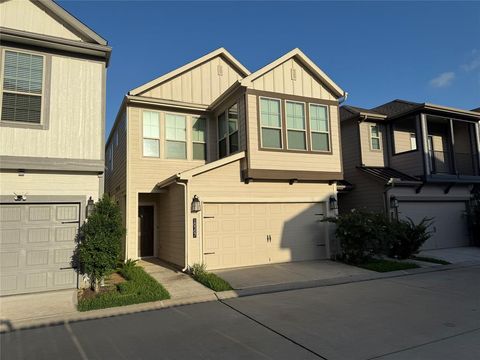
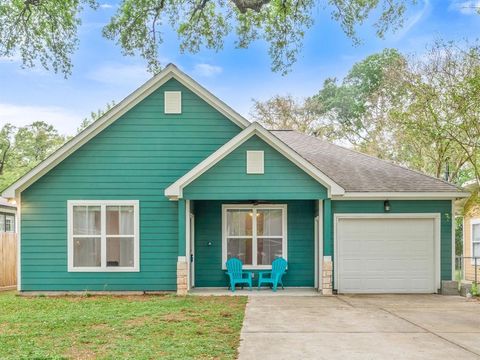
$575,000
4
bds
|
0
ba
|
2,429
sqft
|
built
2020
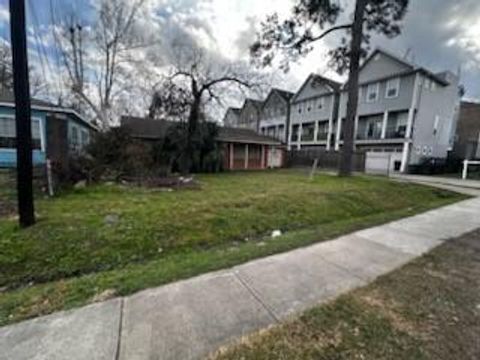
1815 Arbor St, Houston, TX 77004
$34
Cash flow
0.3%
Cash-on-Cash Return
6.3%
Cap rate
0.8%
Rent to Value Ratio
10,000 out of 15,653 properties for sale in Harris County
Limited Results Shown
Create a free account, or log in to reveal all property listings and enjoy the complete experience.

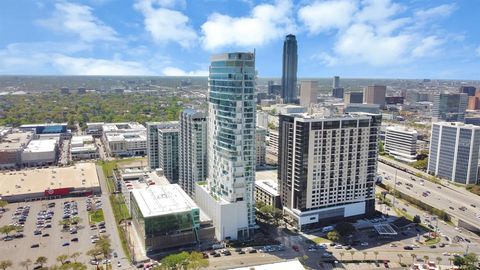
Active
$1,595,000
bds
|
0
ba
|
1,280
sqft
|
built
1959
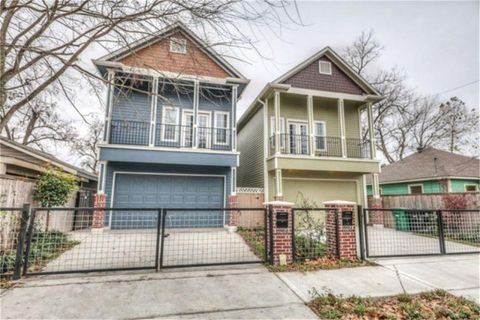
1914 Mc Duffie St, Houston, TX 77019
$-9,826
Cash flow
-32.1%
Cash-on-Cash Return
-1.1%
Cap rate
0.1%
Rent to Value Ratio
Active
$575,000
4
bds
|
0
ba
|
2,429
sqft
|
built
2020
1815 Arbor St, Houston, TX 77004
$34
Cash flow
0.3%
Cash-on-Cash Return
6.3%
Cap rate
0.8%
Rent to Value Ratio

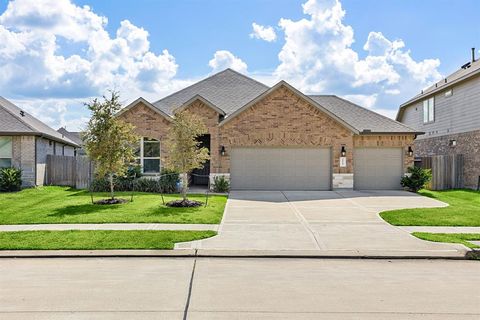
Active
$422,299
3
bds
|
0
ba
|
2,020
sqft
|
built
2021
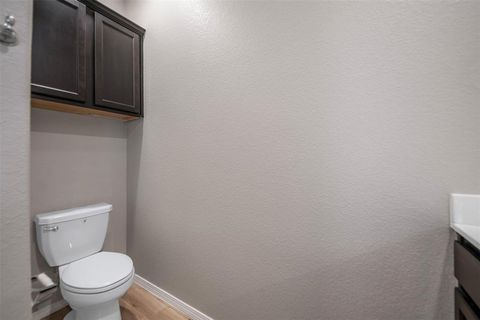
2711 Clinton Dr, Houston, TX 77020
$-166
Cash flow
-2.1%
Cash-on-Cash Return
5.8%
Cap rate
0.7%
Rent to Value Ratio
Active
$565,000
4
bds
|
0
ba
|
3,121
sqft
|
built
2021
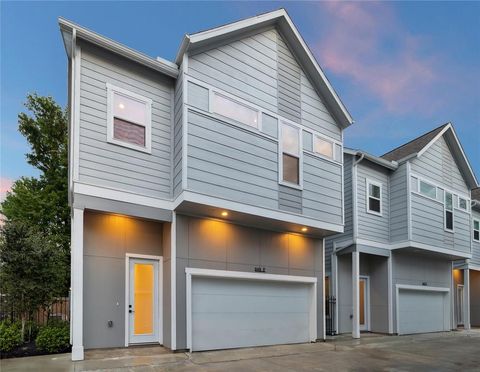
11903 Muir Groves Trl, Humble, TX 77346
$86
Cash flow
0.8%
Cash-on-Cash Return
6.4%
Cap rate
0.8%
Rent to Value Ratio

Active
$348,900
4
bds
|
0
ba
|
2,458
sqft
|
built
2019
17450 Tidewater Cypress Trl, Hockley, TX 77447
$-1,011
Cash flow
-15.1%
Cash-on-Cash Return
2.8%
Cap rate
0.7%
Rent to Value Ratio
Active
$299,000
3
bds
|
0
ba
|
1,927
sqft
|
built
2003
4906 Arbor Falls Ln, Houston, TX 77084
$-786
Cash flow
-13.7%
Cash-on-Cash Return
3.1%
Cap rate
0.7%
Rent to Value Ratio
Active
$370,000
3
bds
|
0
ba
|
1,501
sqft
|
built
2020
10307 Harmon Smith Dr, Houston, TX 77025
$-1,016
Cash flow
-14.3%
Cash-on-Cash Return
3.0%
Cap rate
0.7%
Rent to Value Ratio

Active
$879,000
4
bds
|
0
ba
|
4,091
sqft
|
built
2018
15411 Patten Forest Dr, Cypress, TX 77429
$-3,281
Cash flow
-19.5%
Cash-on-Cash Return
1.8%
Cap rate
0.5%
Rent to Value Ratio

Active
$314,900
4
bds
|
0
ba
|
2,080
sqft
|
built
2021
1634 William Scott St, Baytown, TX 77523
$-900
Cash flow
-14.9%
Cash-on-Cash Return
2.8%
Cap rate
0.8%
Rent to Value Ratio
Active
$395,000
5
bds
|
0
ba
|
2,286
sqft
|
built
2021
31515 Casa Linda Dr, Hockley, TX 77447
$-1,313
Cash flow
-17.3%
Cash-on-Cash Return
2.3%
Cap rate
0.6%
Rent to Value Ratio

Active
$279,900
4
bds
|
0
ba
|
1,958
sqft
|
built
2019
8434 Sunset Isles Dr, Baytown, TX 77521
$-697
Cash flow
-13.0%
Cash-on-Cash Return
3.3%
Cap rate
0.8%
Rent to Value Ratio
Active
$748,000
2
bds
|
0
ba
|
1,813
sqft
|
built
2018
4521 San Felipe St, Houston, TX 77027
$-3,892
Cash flow
-27.1%
Cash-on-Cash Return
0.0%
Cap rate
0.7%
Rent to Value Ratio
Active
$861,250
5
bds
|
0
ba
|
3,445
sqft
|
built
1999
3011 Bonnebridge Way Blvd, Houston, TX 77082
$-2,626
Cash flow
-15.9%
Cash-on-Cash Return
2.6%
Cap rate
0.6%
Rent to Value Ratio
Active
$349,500
2
bds
|
0
ba
|
1,228
sqft
|
built
2017
304 Epps St, Tomball, TX 77375
$-1,040
Cash flow
-15.5%
Cash-on-Cash Return
2.7%
Cap rate
0.5%
Rent to Value Ratio

Active
$679,000
6
bds
|
0
ba
|
4,155
sqft
|
built
2019
4206 Great Bear Pl, Houston, TX 77084
$-1,891
Cash flow
-14.5%
Cash-on-Cash Return
2.9%
Cap rate
0.6%
Rent to Value Ratio
Active
$635,000
4
bds
|
0
ba
|
3,134
sqft
|
built
2020
13603 Sandford Meadow Ln, Cypress, TX 77429
$-2,301
Cash flow
-18.9%
Cash-on-Cash Return
1.9%
Cap rate
0.6%
Rent to Value Ratio

Active
$285,000
4
bds
|
0
ba
|
2,129
sqft
|
built
2020
3835 Giorgio Pastel Pl, Katy, TX 77493
$-802
Cash flow
-14.7%
Cash-on-Cash Return
2.9%
Cap rate
0.8%
Rent to Value Ratio
Active
$1,799,900
3
bds
|
0
ba
|
2,733
sqft
|
built
2018
4521 San Felipe St, Houston, TX 77027
$-7,650
Cash flow
-22.2%
Cash-on-Cash Return
1.2%
Cap rate
0.5%
Rent to Value Ratio

Active
$224,900
3
bds
|
0
ba
|
1,344
sqft
|
built
2019
18841 Elegance Ave, Spring, TX 77379
$-339
Cash flow
-7.9%
Cash-on-Cash Return
4.5%
Cap rate
0.9%
Rent to Value Ratio
Active
$750,000
5
bds
|
0
ba
|
5,213
sqft
|
built
1999
16506 Emilia Ct, Spring, TX 77379
$-2,424
Cash flow
-16.9%
Cash-on-Cash Return
2.4%
Cap rate
0.5%
Rent to Value Ratio

Active
$320,000
4
bds
|
0
ba
|
2,510
sqft
|
built
2021
1314 Green Highland Dr, Spring, TX 77373
$-764
Cash flow
-12.5%
Cash-on-Cash Return
3.4%
Cap rate
0.8%
Rent to Value Ratio
Active
$490,000
5
bds
|
0
ba
|
3,626
sqft
|
built
1976
8210 Bo Jack Dr, Houston, TX 77040
$-1,262
Cash flow
-13.4%
Cash-on-Cash Return
3.2%
Cap rate
0.6%
Rent to Value Ratio

Active
$799,999
bds
|
0
ba
|
6,428
sqft
|
built
1950
5609 Leeland St, Houston, TX 77023
$-3,985
Cash flow
-26.0%
Cash-on-Cash Return
0.3%
Cap rate
0.2%
Rent to Value Ratio

Active
$500,000
4
bds
|
0
ba
|
4,032
sqft
|
built
1946
4831 Gulf Fwy, Houston, TX 77023
$-2,477
Cash flow
-25.8%
Cash-on-Cash Return
0.3%
Cap rate
0.2%
Rent to Value Ratio
Active
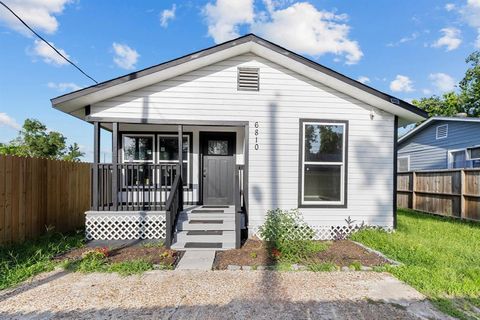
$189,990
3
bds
|
0
ba
|
816
sqft
|
built
1954
6810 Cohn St, Houston, TX 77091
$-366
Cash flow
-10.1%
Cash-on-Cash Return
4.0%
Cap rate
0.6%
Rent to Value Ratio
Active
$416,000
3
bds
|
0
ba
|
2,174
sqft
|
built
2019
9917 Brickhouse Dr, Houston, TX 77080
$-1,237
Cash flow
-15.5%
Cash-on-Cash Return
2.7%
Cap rate
0.7%
Rent to Value Ratio

Active
$379,000
2
bds
|
0
ba
|
1,760
sqft
|
built
1973
5803 Lynbrook Dr, Houston, TX 77057
$-986
Cash flow
-13.6%
Cash-on-Cash Return
3.1%
Cap rate
0.6%
Rent to Value Ratio

Active
$120,000
3
bds
|
0
ba
|
1,332
sqft
|
built
1978
8405 Wilcrest Dr, Houston, TX 77072
$-102
Cash flow
-4.4%
Cash-on-Cash Return
5.2%
Cap rate
1.1%
Rent to Value Ratio

Active
$430,000
2
bds
|
0
ba
|
3,356
sqft
|
built
1980
12955 Woodforest Blvd, Houston, TX 77015
$-3,588
Cash flow
-43.5%
Cash-on-Cash Return
-3.7%
Cap rate
0.2%
Rent to Value Ratio
Active
$799,000
2
bds
|
0
ba
|
1,000
sqft
|
built
1956
1240 W 26th St, Houston, TX 77008
$-3,593
Cash flow
-23.5%
Cash-on-Cash Return
0.9%
Cap rate
0.3%
Rent to Value Ratio
Active
$499,995
3
bds
|
0
ba
|
2,508
sqft
|
built
2014
1128 E 24th St, Houston, TX 77009
$-1,561
Cash flow
-16.3%
Cash-on-Cash Return
2.5%
Cap rate
0.6%
Rent to Value Ratio

Active
$249,199
6
bds
|
0
ba
|
3,351
sqft
|
built
1979
12343 Haroldson Forest Dr, Houston, TX 77044
$-113
Cash flow
-2.4%
Cash-on-Cash Return
5.7%
Cap rate
1.1%
Rent to Value Ratio

Active
$165,000
2
bds
|
0
ba
|
1,014
sqft
|
built
1977
5711 Sugar Hill Dr, Houston, TX 77057
$-436
Cash flow
-13.8%
Cash-on-Cash Return
3.1%
Cap rate
1.0%
Rent to Value Ratio
Active
$274,900
4
bds
|
0
ba
|
1,906
sqft
|
built
2021
23947 Falling Daylight Dr, Hockley, TX 77447
$-558
Cash flow
-10.6%
Cash-on-Cash Return
3.8%
Cap rate
0.8%
Rent to Value Ratio

Active
$110,000
1
bds
|
0
ba
|
1,008
sqft
|
built
1978
6401 Deihl Rd, Houston, TX 77092
$-264
Cash flow
-12.5%
Cash-on-Cash Return
3.4%
Cap rate
1.1%
Rent to Value Ratio

Active
$349,000
3
bds
|
0
ba
|
2,144
sqft
|
built
2017
17023 Canosa Dr, Cypress, TX 77433
$-990
Cash flow
-14.8%
Cash-on-Cash Return
2.9%
Cap rate
0.8%
Rent to Value Ratio
Active
$325,000
3
bds
|
0
ba
|
1,490
sqft
|
built
2023
853 Mansfield St, Houston, TX 77091
$-3
Cash flow
0.0%
Cash-on-Cash Return
6.3%
Cap rate
0.8%
Rent to Value Ratio

Active
$349,900
2
bds
|
0
ba
|
1,502
sqft
|
built
2017
7722 Jacquelyn Oaks Rd, Houston, TX 77055
$-175
Cash flow
-2.6%
Cash-on-Cash Return
5.7%
Cap rate
0.7%
Rent to Value Ratio
Active
$475,000
5
bds
|
0
ba
|
3,829
sqft
|
built
1975
5523 Theall Rd, Houston, TX 77066
$-1,006
Cash flow
-11.0%
Cash-on-Cash Return
3.7%
Cap rate
0.7%
Rent to Value Ratio
Active
$335,000
3
bds
|
0
ba
|
1,860
sqft
|
built
1960
3014 Inland Rd, Huffman, TX 77336
$-236
Cash flow
-3.7%
Cash-on-Cash Return
5.4%
Cap rate
0.7%
Rent to Value Ratio