Harris County Investment Properties for Sale
Browse homes for sale and investment properties in Harris County. Refine your search by price, property type, or more.
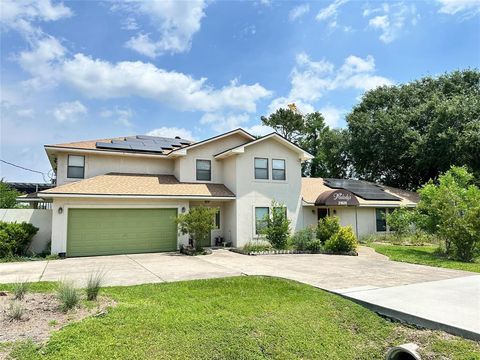
Best cash flowing properties in Harris County
Active
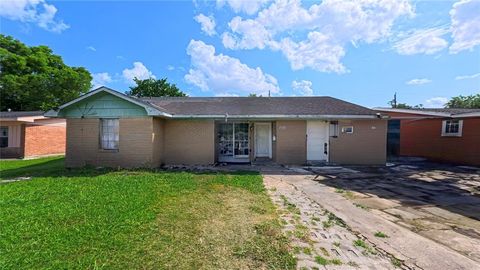
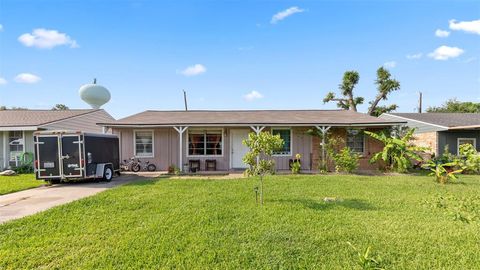
$119,000
3
bds
|
0
ba
|
1,171
sqft
|
built
1950
2847 Almeda Plaza Dr, Houston, TX 77045
$203
Cash flow
8.9%
Cash-on-Cash Return
8.3%
Cap rate
1.3%
Rent to Value Ratio

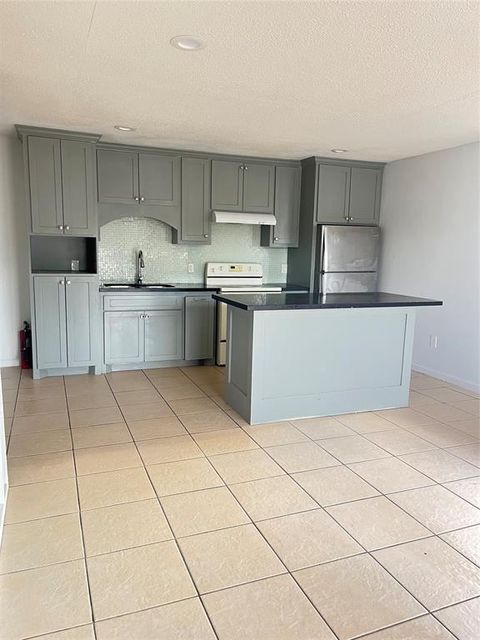
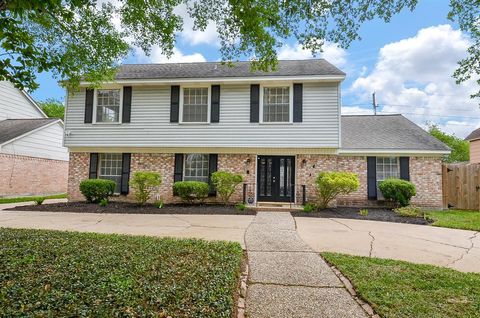
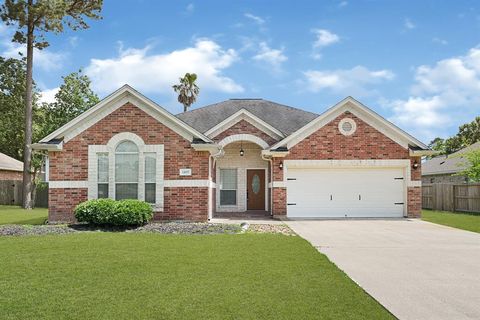
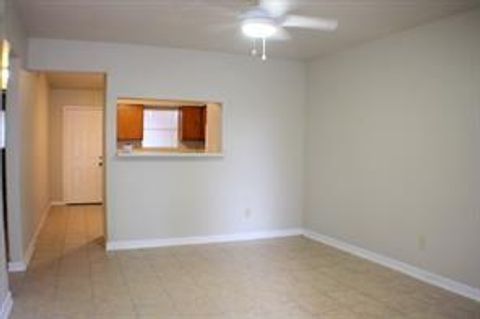
Active
$239,990
3
bds
|
0
ba
|
1,774
sqft
|
built
2005
22815 Sherioaks Ln, Spring, TX 77389
$14
Cash flow
0.3%
Cash-on-Cash Return
6.3%
Cap rate
1.1%
Rent to Value Ratio
10,000 out of 15,630 properties for sale in Harris County
Limited Results Shown
Create a free account, or log in to reveal all property listings and enjoy the complete experience.
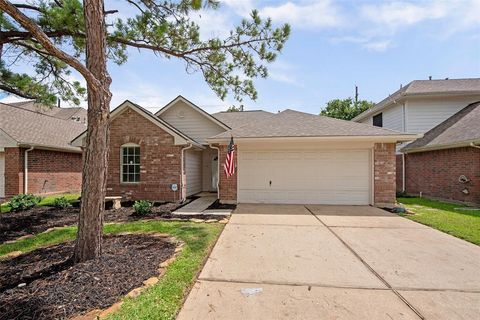
Active
$219,000
3
bds
|
0
ba
|
1,973
sqft
|
built
1979
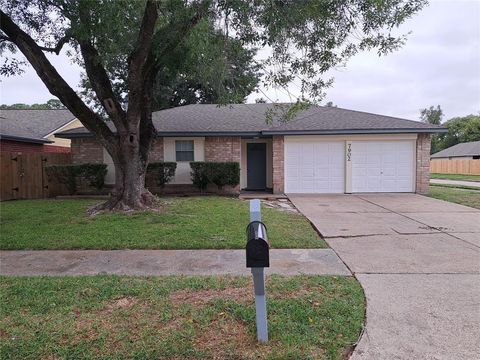
7902 Birchbark Dr, Humble, TX 77338
$-372
Cash flow
-8.9%
Cash-on-Cash Return
4.2%
Cap rate
0.8%
Rent to Value Ratio

Active
$3,300,000
4
bds
|
0
ba
|
3,026
sqft
|
built
1998
16010 Warren Ranch Rd, Hockley, TX 77447
$-14,654
Cash flow
-23.2%
Cash-on-Cash Return
0.9%
Cap rate
0.1%
Rent to Value Ratio
Active
$479,000
4
bds
|
0
ba
|
2,188
sqft
|
built
2003
17810 Pine St, Crosby, TX 77532
$-1,344
Cash flow
-14.6%
Cash-on-Cash Return
2.9%
Cap rate
0.5%
Rent to Value Ratio

Active
$380,000
4
bds
|
0
ba
|
2,428
sqft
|
built
2013
6146 Moran Crest Dr, Spring, TX 77388
$-847
Cash flow
-11.6%
Cash-on-Cash Return
3.6%
Cap rate
0.7%
Rent to Value Ratio
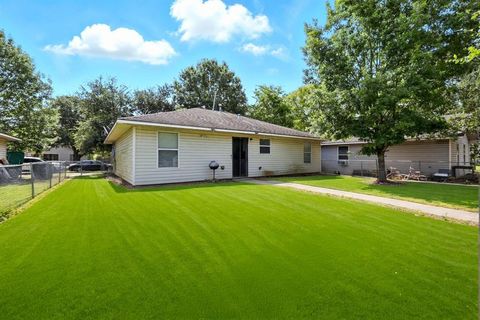
Active
$245,000
4
bds
|
0
ba
|
2,135
sqft
|
built
1965
11707 N Nottingham Cir, Houston, TX 77071
$-400
Cash flow
-8.5%
Cash-on-Cash Return
4.3%
Cap rate
0.8%
Rent to Value Ratio

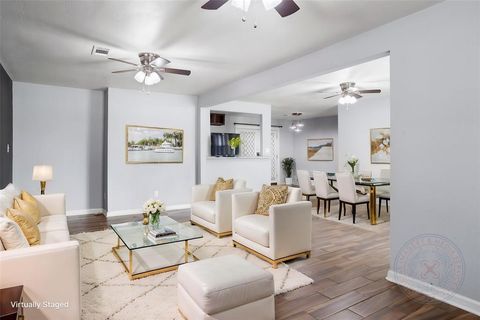
Active
$295,000
3
bds
|
0
ba
|
1,480
sqft
|
built
1977
1912 Trixie Ln, Houston, TX 77042
$-534
Cash flow
-9.4%
Cash-on-Cash Return
4.1%
Cap rate
0.7%
Rent to Value Ratio
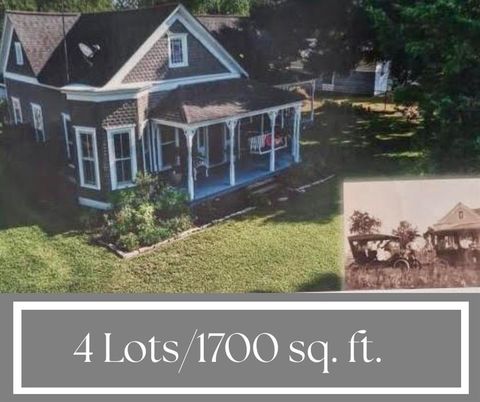
Active
$350,000
3
bds
|
0
ba
|
1,699
sqft
|
built
1936
31306 Waller Tomball Rd, Waller, TX 77484
$-380
Cash flow
-5.7%
Cash-on-Cash Return
5.0%
Cap rate
0.7%
Rent to Value Ratio
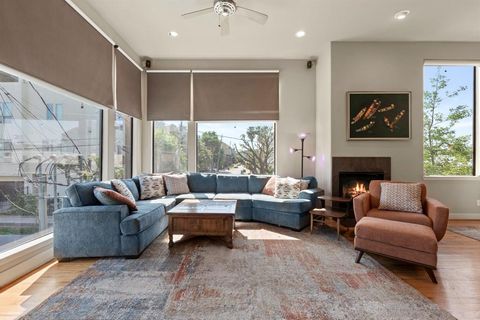
Active
$499,900
3
bds
|
0
ba
|
2,103
sqft
|
built
2004
5122 Lillian St, Houston, TX 77007
$-471
Cash flow
-4.9%
Cash-on-Cash Return
5.1%
Cap rate
0.6%
Rent to Value Ratio
Active
$119,000
3
bds
|
0
ba
|
1,171
sqft
|
built
1950
2847 Almeda Plaza Dr, Houston, TX 77045
$203
Cash flow
8.9%
Cash-on-Cash Return
8.3%
Cap rate
1.3%
Rent to Value Ratio

Active
$219,000
3
bds
|
0
ba
|
1,512
sqft
|
built
1978
8114 Audubon Forest Dr, Humble, TX 77396
$-312
Cash flow
-7.4%
Cash-on-Cash Return
4.6%
Cap rate
0.8%
Rent to Value Ratio
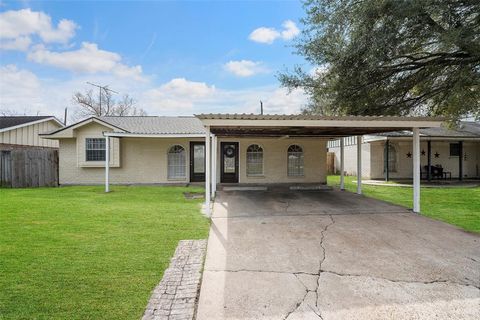
Active
$230,000
3
bds
|
0
ba
|
1,247
sqft
|
built
1957
1311 Gary Ave, Pasadena, TX 77502
$-442
Cash flow
-10.0%
Cash-on-Cash Return
4.0%
Cap rate
0.7%
Rent to Value Ratio
Active
$210,000
4
bds
|
0
ba
|
1,318
sqft
|
built
2007
2005 Worms St, Houston, TX 77020
$-257
Cash flow
-6.4%
Cash-on-Cash Return
4.8%
Cap rate
0.8%
Rent to Value Ratio
Active
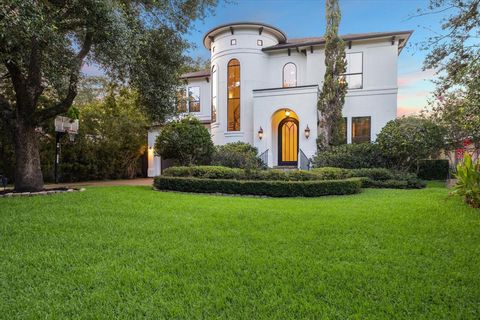
$1,749,000
4
bds
|
0
ba
|
4,675
sqft
|
built
2005
3614 Glen Haven Blvd, Houston, TX 77025
$-5,198
Cash flow
-15.5%
Cash-on-Cash Return
2.7%
Cap rate
0.3%
Rent to Value Ratio

Active
$249,900
4
bds
|
0
ba
|
1,708
sqft
|
built
1966
1853 El Mar Ln, Seabrook, TX 77586
$-332
Cash flow
-6.9%
Cash-on-Cash Return
4.7%
Cap rate
0.8%
Rent to Value Ratio
Active
$290,000
1
bds
|
0
ba
|
1,707
sqft
|
built
1979
5526 Stonewall St, Houston, TX 77020
$-616
Cash flow
-11.1%
Cash-on-Cash Return
3.7%
Cap rate
0.6%
Rent to Value Ratio
Active
$280,000
3
bds
|
0
ba
|
1,280
sqft
|
built
1999
16315 Redbud Berry Ln, Cypress, TX 77433
$-506
Cash flow
-9.4%
Cash-on-Cash Return
4.1%
Cap rate
0.8%
Rent to Value Ratio
Active
$235,000
4
bds
|
0
ba
|
1,379
sqft
|
built
1965
522 Hollyvale Dr, Houston, TX 77060
$-413
Cash flow
-9.2%
Cash-on-Cash Return
4.2%
Cap rate
0.7%
Rent to Value Ratio
Active
$205,000
4
bds
|
0
ba
|
1,470
sqft
|
built
1958
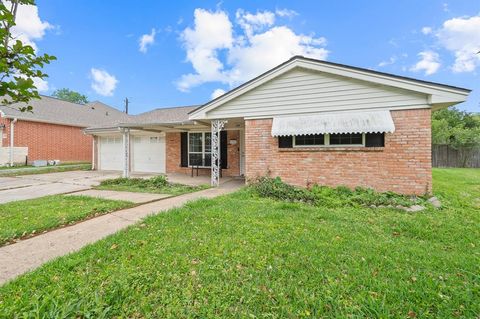
3814 Ripplebrook Dr, Houston, TX 77045
$-191
Cash flow
-4.9%
Cash-on-Cash Return
5.1%
Cap rate
0.8%
Rent to Value Ratio

Active
$589,900
4
bds
|
0
ba
|
3,480
sqft
|
built
2013
19803 Carsenwood Ln, Cypress, TX 77433
$-480
Cash flow
-4.2%
Cash-on-Cash Return
5.3%
Cap rate
0.7%
Rent to Value Ratio
Active
$309,900
3
bds
|
0
ba
|
1,612
sqft
|
built
1953
1826 East Ave, Katy, TX 77493
$-820
Cash flow
-13.8%
Cash-on-Cash Return
3.1%
Cap rate
0.6%
Rent to Value Ratio
Active
$410,000
4
bds
|
0
ba
|
2,939
sqft
|
built
1973
2019 Briarlee Dr, Houston, TX 77077
$-716
Cash flow
-9.1%
Cash-on-Cash Return
4.2%
Cap rate
0.8%
Rent to Value Ratio
Active
$598,891
4
bds
|
0
ba
|
4,661
sqft
|
built
2005
14302 Mindy Park Ln, Houston, TX 77069
$-1,997
Cash flow
-17.4%
Cash-on-Cash Return
2.3%
Cap rate
0.5%
Rent to Value Ratio

Active
$270,000
3
bds
|
0
ba
|
1,408
sqft
|
built
1984
810 Avenue D, South Houston, TX 77587
$-444
Cash flow
-8.6%
Cash-on-Cash Return
4.3%
Cap rate
0.5%
Rent to Value Ratio
Active
$239,990
3
bds
|
0
ba
|
1,774
sqft
|
built
2005
22815 Sherioaks Ln, Spring, TX 77389
$14
Cash flow
0.3%
Cash-on-Cash Return
6.3%
Cap rate
1.1%
Rent to Value Ratio
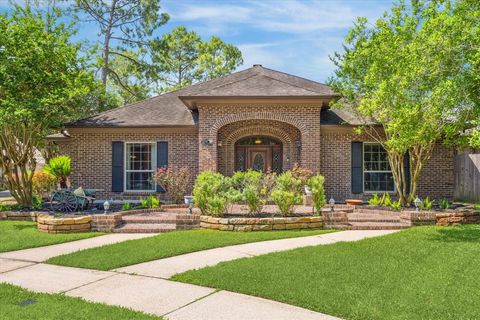
Active
$285,000
3
bds
|
0
ba
|
2,274
sqft
|
built
2006
1207 S Diamondhead Blvd, Crosby, TX 77532
$-574
Cash flow
-10.5%
Cash-on-Cash Return
3.8%
Cap rate
0.8%
Rent to Value Ratio
Active
$665,000
4
bds
|
0
ba
|
4,401
sqft
|
built
1986
15706 Pinewood Cove Dr, Houston, TX 77062
$-2,002
Cash flow
-15.7%
Cash-on-Cash Return
2.7%
Cap rate
0.6%
Rent to Value Ratio
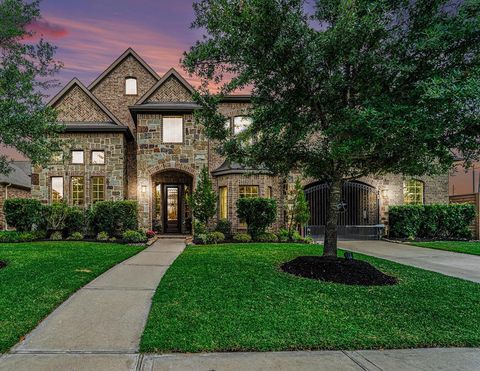
Active
$830,000
5
bds
|
0
ba
|
5,003
sqft
|
built
2013
21806 W Firemist Ct, Cypress, TX 77433
$-2,767
Cash flow
-17.4%
Cash-on-Cash Return
2.3%
Cap rate
0.5%
Rent to Value Ratio
Active
$322,000
4
bds
|
0
ba
|
2,697
sqft
|
built
2003
5310 Flagridge Ln, Houston, TX 77066
$-782
Cash flow
-12.7%
Cash-on-Cash Return
3.4%
Cap rate
0.8%
Rent to Value Ratio
Active
$425,000
5
bds
|
0
ba
|
3,848
sqft
|
built
2003
16410 Bluff Springs Dr, Houston, TX 77095
$-971
Cash flow
-11.9%
Cash-on-Cash Return
3.5%
Cap rate
0.8%
Rent to Value Ratio
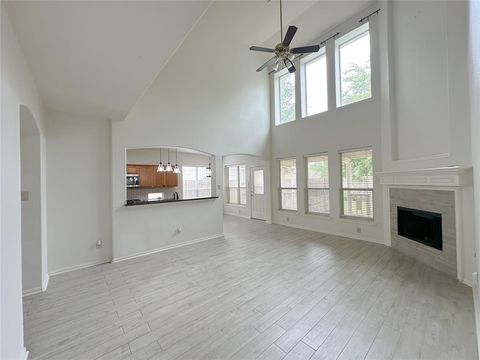
Active
$289,900
3
bds
|
0
ba
|
1,974
sqft
|
built
1978
18037 Bal Harbour Dr, Houston, TX 77058
$-655
Cash flow
-11.8%
Cash-on-Cash Return
3.6%
Cap rate
0.9%
Rent to Value Ratio

Active
$362,000
4
bds
|
0
ba
|
3,778
sqft
|
built
1968
18611 Cape Charles Ln, Houston, TX 77058
$-474
Cash flow
-6.8%
Cash-on-Cash Return
4.7%
Cap rate
0.9%
Rent to Value Ratio
Active
$279,000
2
bds
|
0
ba
|
1,614
sqft
|
built
2012
18720 Serenity Loch Dr, Spring, TX 77379
$-824
Cash flow
-15.4%
Cash-on-Cash Return
2.7%
Cap rate
0.7%
Rent to Value Ratio

Active
$429,000
4
bds
|
0
ba
|
3,474
sqft
|
built
1982
18302 Lazy Moss Ln, Spring, TX 77379
$-781
Cash flow
-9.5%
Cash-on-Cash Return
4.1%
Cap rate
0.7%
Rent to Value Ratio

Active
$290,000
3
bds
|
0
ba
|
2,030
sqft
|
built
1977
20006 18th Fairway Dr, Humble, TX 77346
$-506
Cash flow
-9.1%
Cash-on-Cash Return
4.2%
Cap rate
0.7%
Rent to Value Ratio
Active
$374,000
2
bds
|
0
ba
|
2,327
sqft
|
built
2009
2918 Royal Oaks Grn, Houston, TX 77082
$-1,136
Cash flow
-15.8%
Cash-on-Cash Return
2.6%
Cap rate
0.7%
Rent to Value Ratio
Active
$549,000
5
bds
|
0
ba
|
4,242
sqft
|
built
2003
21626 Gentry Rd, Cypress, TX 77429
$-1,137
Cash flow
-10.8%
Cash-on-Cash Return
3.8%
Cap rate
0.7%
Rent to Value Ratio

Active
$270,000
4
bds
|
0
ba
|
1,865
sqft
|
built
1984
10928 Collingswood Dr, La Porte, TX 77571
$-497
Cash flow
-9.6%
Cash-on-Cash Return
4.1%
Cap rate
0.7%
Rent to Value Ratio
Active
$505,000
2
bds
|
0
ba
|
3,468
sqft
|
built
1984
9018 Grannis St, Houston, TX 77075
$-2,653
Cash flow
-27.4%
Cash-on-Cash Return
0.0%
Cap rate
0.3%
Rent to Value Ratio

Active
$299,900
4
bds
|
0
ba
|
2,368
sqft
|
built
1992
6118 Deep South Dr, Katy, TX 77449
$-551
Cash flow
-9.6%
Cash-on-Cash Return
4.1%
Cap rate
0.7%
Rent to Value Ratio
Active
$495,000
4
bds
|
0
ba
|
2,100
sqft
|
built
1955
4837 Briarbend Dr, Houston, TX 77035
$-1,507
Cash flow
-15.9%
Cash-on-Cash Return
2.6%
Cap rate
0.5%
Rent to Value Ratio