Harris County Investment Properties for Sale
Browse homes for sale and investment properties in Harris County. Refine your search by price, property type, or more.
Best cash flowing properties in Harris County
Active
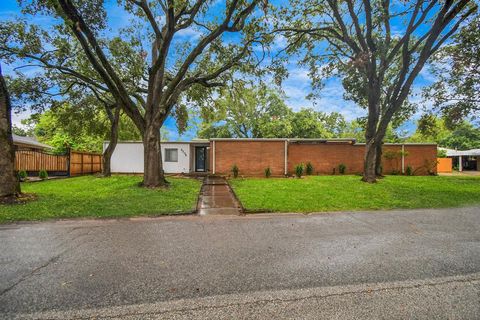
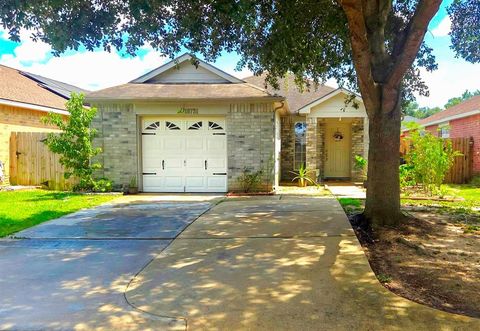
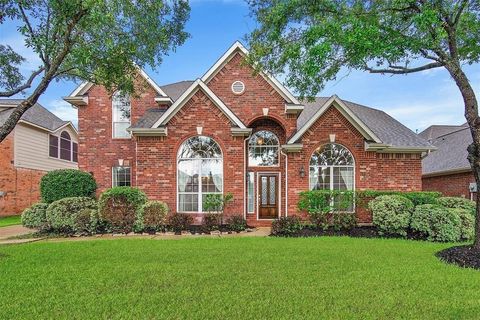
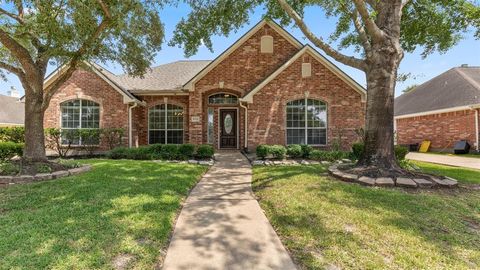
$339,000
4
bds
|
0
ba
|
2,639
sqft
|
built
1957
2305 Redwinn Dr, Pasadena, TX 77502
$438
Cash flow
6.7%
Cash-on-Cash Return
7.8%
Cap rate
0.9%
Rent to Value Ratio
Active
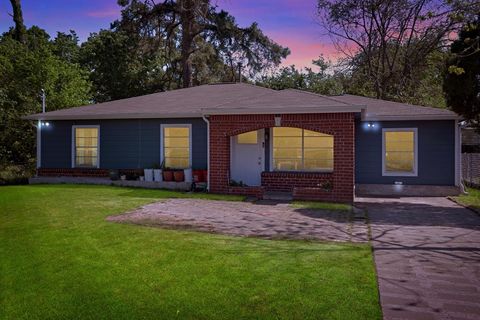
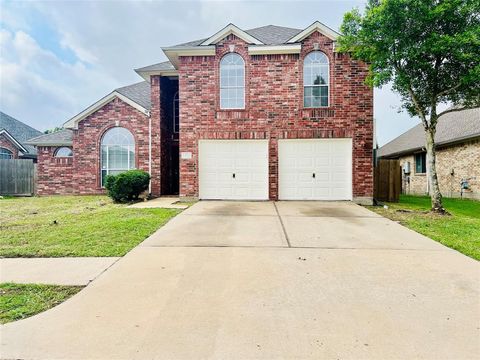
$189,950
4
bds
|
0
ba
|
1,303
sqft
|
built
1948
4506 Boicewood St, Houston, TX 77016
$-74
Cash flow
-2.0%
Cash-on-Cash Return
5.8%
Cap rate
0.9%
Rent to Value Ratio
10,000 out of 15,630 properties for sale in Harris County
Limited Results Shown
Create a free account, or log in to reveal all property listings and enjoy the complete experience.

Active
$249,950
3
bds
|
0
ba
|
2,445
sqft
|
built
1977
23423 Earlmist Dr, Spring, TX 77373
$-461
Cash flow
-9.6%
Cash-on-Cash Return
4.1%
Cap rate
0.8%
Rent to Value Ratio

Active
$814,500
4
bds
|
0
ba
|
2,520
sqft
|
built
1992
20710 Peters Rd, Crosby, TX 77532
$-2,604
Cash flow
-16.7%
Cash-on-Cash Return
2.4%
Cap rate
0.4%
Rent to Value Ratio
Active
$1,595,000
4
bds
|
0
ba
|
4,090
sqft
|
built
1998
5206 Stamper Way, Houston, TX 77056
$-5,262
Cash flow
-17.2%
Cash-on-Cash Return
2.3%
Cap rate
0.5%
Rent to Value Ratio

Active
$470,000
4
bds
|
0
ba
|
2,886
sqft
|
built
1979
16130 Hexham Dr, Spring, TX 77379
$-1,218
Cash flow
-13.5%
Cash-on-Cash Return
3.2%
Cap rate
0.6%
Rent to Value Ratio
Active
$894,000
4
bds
|
0
ba
|
3,508
sqft
|
built
2015
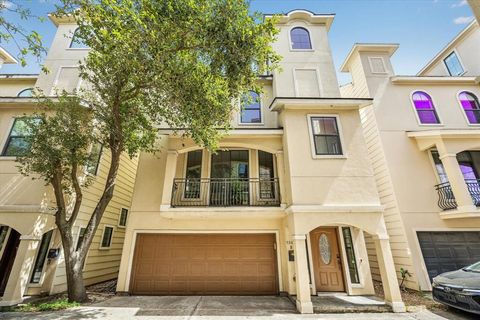
403 W Pierce St, Houston, TX 77019
$-1,091
Cash flow
-6.4%
Cash-on-Cash Return
4.8%
Cap rate
0.8%
Rent to Value Ratio
Active
$219,900
3
bds
|
0
ba
|
1,254
sqft
|
built
1999
3502 Burlington St, Houston, TX 77006
$-810
Cash flow
-19.2%
Cash-on-Cash Return
1.8%
Cap rate
0.9%
Rent to Value Ratio
Active
$242,000
4
bds
|
0
ba
|
1,544
sqft
|
built
2007
18731 Driftwood Springs Dr, Katy, TX 77449
$-459
Cash flow
-9.9%
Cash-on-Cash Return
4.0%
Cap rate
0.7%
Rent to Value Ratio
Active
$690,000
3
bds
|
0
ba
|
2,337
sqft
|
built
2000
136 Oak Place Dr, Houston, TX 77006
$-1,748
Cash flow
-13.2%
Cash-on-Cash Return
3.2%
Cap rate
0.5%
Rent to Value Ratio

Active
$875,000
5
bds
|
0
ba
|
4,840
sqft
|
built
1990
16022 Stewarts Grove Dr, Spring, TX 77379
$-3,028
Cash flow
-18.1%
Cash-on-Cash Return
2.1%
Cap rate
0.4%
Rent to Value Ratio
Active
$490,000
5
bds
|
0
ba
|
4,311
sqft
|
built
2006
15907 Chart House Ct, Houston, TX 77044
$-1,223
Cash flow
-13.0%
Cash-on-Cash Return
3.3%
Cap rate
0.7%
Rent to Value Ratio
Active
$279,900
2
bds
|
0
ba
|
1,252
sqft
|
built
1992
2111 Welch St, Houston, TX 77019
$-1,153
Cash flow
-21.5%
Cash-on-Cash Return
1.3%
Cap rate
0.8%
Rent to Value Ratio

Active
$319,000
2
bds
|
0
ba
|
1,252
sqft
|
built
1992
2111 Welch St, Houston, TX 77019
$-1,176
Cash flow
-19.2%
Cash-on-Cash Return
1.8%
Cap rate
0.8%
Rent to Value Ratio

Active
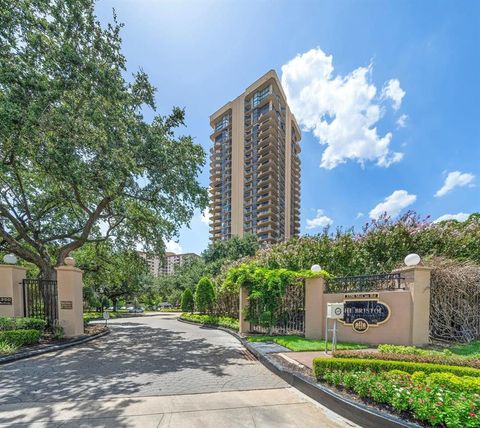
$209,900
1
bds
|
0
ba
|
787
sqft
|
built
2000
3505 Sage Rd, Houston, TX 77056
$-691
Cash flow
-17.2%
Cash-on-Cash Return
2.3%
Cap rate
0.9%
Rent to Value Ratio
Active
$490,000
3
bds
|
0
ba
|
2,711
sqft
|
built
2005
9269 Buffalo Speedway, Houston, TX 77025
$-1,249
Cash flow
-13.3%
Cash-on-Cash Return
3.2%
Cap rate
0.7%
Rent to Value Ratio

Active
$219,000
1
bds
|
0
ba
|
995
sqft
|
built
1992
2111 Welch St, Houston, TX 77019
$-945
Cash flow
-22.5%
Cash-on-Cash Return
1.1%
Cap rate
0.8%
Rent to Value Ratio

Active
$995,000
5
bds
|
0
ba
|
5,124
sqft
|
built
2000
2520 Robinhood St, Houston, TX 77005
$-6,214
Cash flow
-32.6%
Cash-on-Cash Return
-1.2%
Cap rate
0.7%
Rent to Value Ratio
Active
$569,000
2
bds
|
0
ba
|
2,548
sqft
|
built
2001
1315 Avon Way, Humble, TX 77339
$-1,983
Cash flow
-18.2%
Cash-on-Cash Return
2.1%
Cap rate
0.5%
Rent to Value Ratio
Active
$1,200,000
3
bds
|
0
ba
|
3,311
sqft
|
built
2005
6515 Pickens St, Houston, TX 77007
$-3,864
Cash flow
-16.8%
Cash-on-Cash Return
2.4%
Cap rate
0.5%
Rent to Value Ratio
Active
$453,000
4
bds
|
0
ba
|
3,314
sqft
|
built
2005
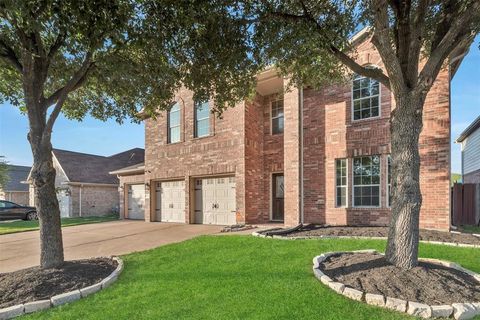
11510 Misty Arch Ln, Cypress, TX 77433
$-1,160
Cash flow
-13.4%
Cash-on-Cash Return
3.2%
Cap rate
0.7%
Rent to Value Ratio
Active
$259,000
1
bds
|
0
ba
|
1,224
sqft
|
built
1995
201 Main St, Houston, TX 77002
$-1,156
Cash flow
-23.3%
Cash-on-Cash Return
0.9%
Cap rate
0.8%
Rent to Value Ratio
Active
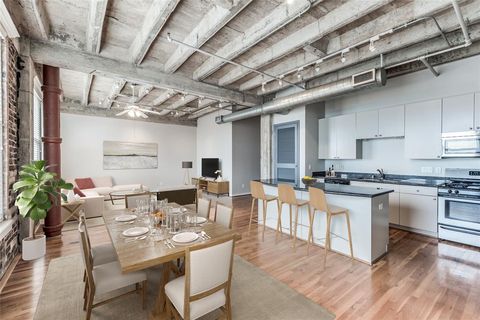
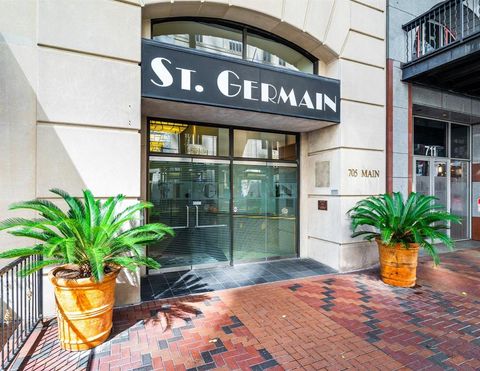
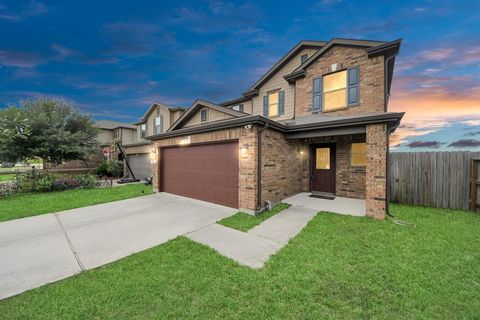
$339,995
2
bds
|
0
ba
|
1,465
sqft
|
built
1921
705 Main St, Houston, TX 77002
$-1,111
Cash flow
-17.0%
Cash-on-Cash Return
2.3%
Cap rate
0.8%
Rent to Value Ratio
Active
$339,000
4
bds
|
0
ba
|
2,639
sqft
|
built
1957
2305 Redwinn Dr, Pasadena, TX 77502
$438
Cash flow
6.7%
Cash-on-Cash Return
7.8%
Cap rate
0.9%
Rent to Value Ratio
Active
$365,000
4
bds
|
0
ba
|
2,694
sqft
|
built
2003
13715 Branford Greens Dr, Houston, TX 77083
$-971
Cash flow
-13.9%
Cash-on-Cash Return
3.1%
Cap rate
0.7%
Rent to Value Ratio
Active
$420,000
2
bds
|
0
ba
|
1,378
sqft
|
built
2004
2000 Bagby St, Houston, TX 77002
$-1,672
Cash flow
-20.8%
Cash-on-Cash Return
1.5%
Cap rate
0.7%
Rent to Value Ratio

Active
$417,000
4
bds
|
0
ba
|
2,952
sqft
|
built
2004
3006 E Park At Fairdale, Houston, TX 77057
$-1,090
Cash flow
-13.6%
Cash-on-Cash Return
3.1%
Cap rate
0.7%
Rent to Value Ratio

Active
$185,000
1
bds
|
0
ba
|
799
sqft
|
built
2005
1711 Old Spanish Trl, Houston, TX 77054
$-751
Cash flow
-21.2%
Cash-on-Cash Return
1.4%
Cap rate
0.9%
Rent to Value Ratio
Active
$209,000
1
bds
|
0
ba
|
981
sqft
|
built
2005
1711 Old Spanish Trl, Houston, TX 77054
$-879
Cash flow
-21.9%
Cash-on-Cash Return
1.2%
Cap rate
0.9%
Rent to Value Ratio
Active
$459,900
3
bds
|
0
ba
|
2,290
sqft
|
built
2007
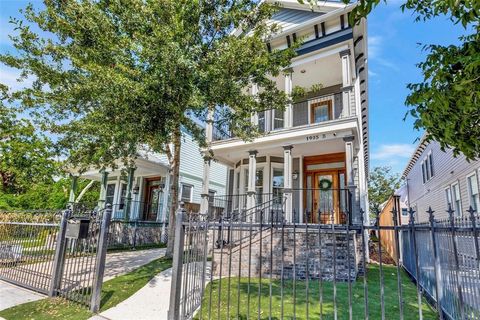
1518 Bingham St, Houston, TX 77007
$-982
Cash flow
-11.1%
Cash-on-Cash Return
3.7%
Cap rate
0.7%
Rent to Value Ratio
Active
$295,000
3
bds
|
0
ba
|
1,964
sqft
|
built
1983
9806 Paddock Park Dr, Houston, TX 77065
$-587
Cash flow
-10.4%
Cash-on-Cash Return
3.9%
Cap rate
0.7%
Rent to Value Ratio
Active
$465,000
3
bds
|
0
ba
|
2,354
sqft
|
built
2007
5308 Larkin St, Houston, TX 77007
$-969
Cash flow
-10.9%
Cash-on-Cash Return
3.8%
Cap rate
0.7%
Rent to Value Ratio
Active
$249,900
2
bds
|
0
ba
|
1,233
sqft
|
built
2005
1711 Old Spanish Trl, Houston, TX 77054
$-912
Cash flow
-19.0%
Cash-on-Cash Return
1.9%
Cap rate
0.8%
Rent to Value Ratio
Active
$404,999
4
bds
|
0
ba
|
3,710
sqft
|
built
2006
22406 Miramar Crest Dr, Tomball, TX 77375
$-850
Cash flow
-11.0%
Cash-on-Cash Return
3.7%
Cap rate
0.8%
Rent to Value Ratio
Active
$189,950
4
bds
|
0
ba
|
1,303
sqft
|
built
1948
4506 Boicewood St, Houston, TX 77016
$-74
Cash flow
-2.0%
Cash-on-Cash Return
5.8%
Cap rate
0.9%
Rent to Value Ratio
Active
$1,000,000
3
bds
|
0
ba
|
3,424
sqft
|
built
2006
1905 W 14th St, Houston, TX 77008
$-2,192
Cash flow
-11.4%
Cash-on-Cash Return
3.6%
Cap rate
0.6%
Rent to Value Ratio
Active
$409,000
4
bds
|
0
ba
|
2,736
sqft
|
built
2003
9138 Shango Ln, Houston, TX 77095
$-1,069
Cash flow
-13.6%
Cash-on-Cash Return
3.1%
Cap rate
0.6%
Rent to Value Ratio

Active
$325,000
4
bds
|
0
ba
|
2,513
sqft
|
built
2013
6822 Oaken Gate Way, Humble, TX 77338
$-718
Cash flow
-11.5%
Cash-on-Cash Return
3.6%
Cap rate
0.7%
Rent to Value Ratio

Active
$129,900
2
bds
|
0
ba
|
1,640
sqft
|
built
1983
17657 Red Oak Dr, Houston, TX 77090
$-220
Cash flow
-8.8%
Cash-on-Cash Return
4.2%
Cap rate
1.3%
Rent to Value Ratio
Active
$239,000
2
bds
|
0
ba
|
1,955
sqft
|
built
1983
3350 Mc Cue Rd, Houston, TX 77056
$-2,288
Cash flow
-49.9%
Cash-on-Cash Return
-5.2%
Cap rate
1.0%
Rent to Value Ratio

Active
$1,325,000
4
bds
|
0
ba
|
5,377
sqft
|
built
2014
42 New Oak Trl, Humble, TX 77346
$-4,130
Cash flow
-16.3%
Cash-on-Cash Return
2.5%
Cap rate
0.6%
Rent to Value Ratio
Active
$274,990
3
bds
|
0
ba
|
2,338
sqft
|
built
2015
2702 Urban Glen Ct, Houston, TX 77038
$-563
Cash flow
-10.7%
Cash-on-Cash Return
3.8%
Cap rate
0.8%
Rent to Value Ratio