Weber County Investment Properties for Sale
Browse homes for sale and investment properties in Weber County. Refine your search by price, property type, or more.
Best cash flowing properties in Weber County

Active
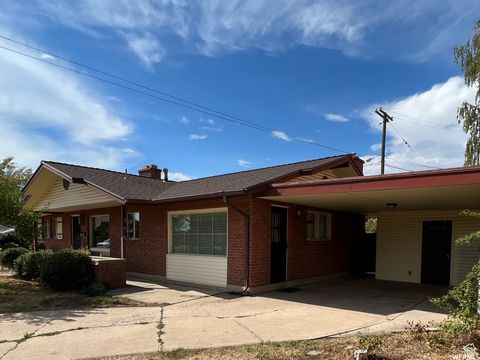
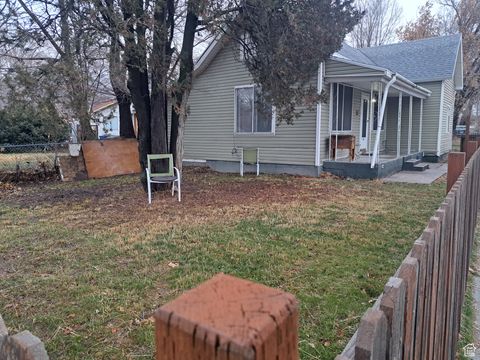
$224,800
2
bds
|
1
ba
|
672
sqft
|
built
1914
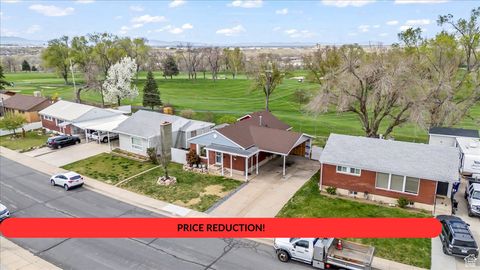
3215 Pingree Ave, Ogden, UT 84401
$-226
Cash flow
-5.2%
Cash-on-Cash Return
4.5%
Cap rate
0.6%
Rent to Value Ratio
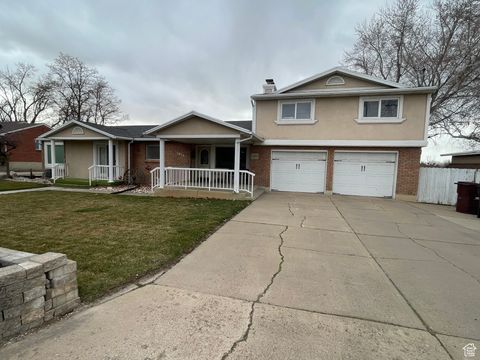
Active
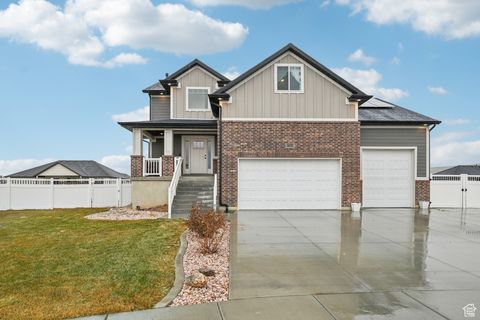
$424,800
4
bds
|
3
ba
|
2,825
sqft
|
built
1957
2266 W 5100 S, Roy, UT 84067
$-291
Cash flow
-3.6%
Cash-on-Cash Return
4.9%
Cap rate
0.7%
Rent to Value Ratio
541 out of 659 properties for sale in Weber County
Limited Results Shown
Create a free account, or log in to reveal all property listings and enjoy the complete experience.
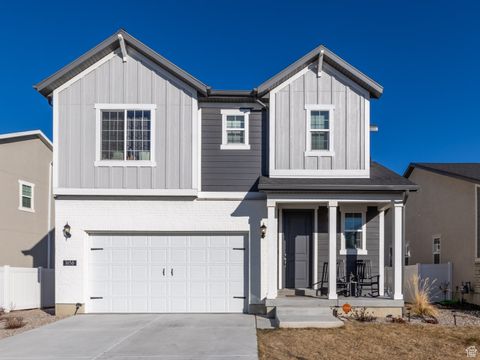
Active
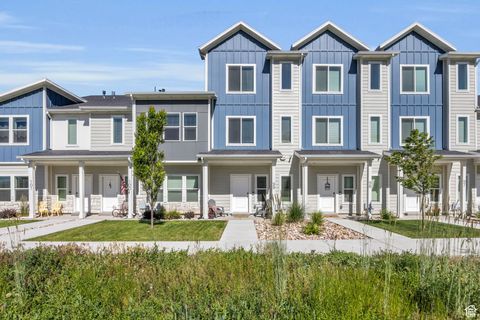
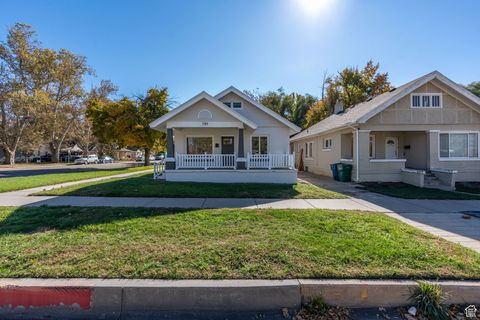
$326,900
2
bds
|
3
ba
|
1,726
sqft
|
built
2021
1816 N 300 E, North Ogden, UT 84414
$-716
Cash flow
-11.4%
Cash-on-Cash Return
3.1%
Cap rate
0.6%
Rent to Value Ratio
Active
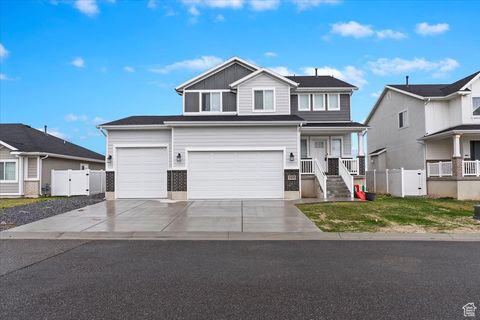
$525,000
4
bds
|
3
ba
|
3,036
sqft
|
built
2021
2459 W Glover Ln, West Haven, UT 84401
$-1,214
Cash flow
-12.1%
Cash-on-Cash Return
2.9%
Cap rate
0.4%
Rent to Value Ratio
Active
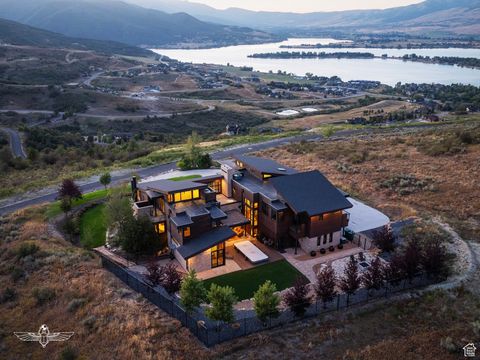
$3,995,000
5
bds
|
8
ba
|
9,790
sqft
|
built
2011
6639 Chaparral Rd, Huntsville, UT 84317
$-17,540
Cash flow
-22.9%
Cash-on-Cash Return
0.4%
Cap rate
0.1%
Rent to Value Ratio
Active
$409,900
4
bds
|
2
ba
|
2,050
sqft
|
built
1947
108 W 4300 S, Washington Terrace, UT 84405
$-873
Cash flow
-11.1%
Cash-on-Cash Return
3.1%
Cap rate
0.4%
Rent to Value Ratio
Active
$845,000
5
bds
|
3
ba
|
3,200
sqft
|
built
2001
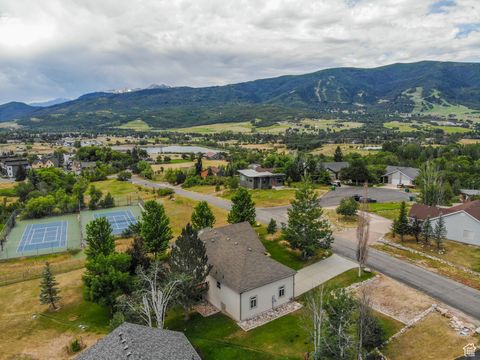
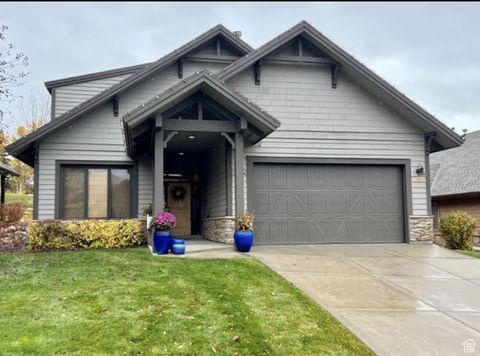
3674 N Willow Brooke Ln, Eden, UT 84310
$-1,390
Cash flow
-8.6%
Cash-on-Cash Return
3.7%
Cap rate
0.5%
Rent to Value Ratio
Active
$1,225,000
6
bds
|
4
ba
|
4,270
sqft
|
built
2005
161 E 3725 N, Ogden, UT 84414
$-3,771
Cash flow
-16.1%
Cash-on-Cash Return
2.0%
Cap rate
0.3%
Rent to Value Ratio
Active
$335,000
3
bds
|
1
ba
|
1,515
sqft
|
built
1908
661 E 2735 S, Ogden, UT 84403
$-376
Cash flow
-5.9%
Cash-on-Cash Return
4.3%
Cap rate
0.6%
Rent to Value Ratio
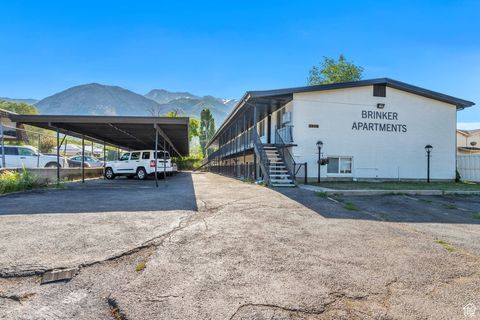
Active
$1,950,000
17
bds
|
10
ba
|
7,450
sqft
|
built
1966
3476 Brinker Ave, Ogden, UT 84403
$-8,676
Cash flow
-23.2%
Cash-on-Cash Return
0.3%
Cap rate
0.1%
Rent to Value Ratio
Active
$355,000
3
bds
|
3
ba
|
1,565
sqft
|
built
2020
270 E 1825 N, North Ogden, UT 84414
$-867
Cash flow
-12.7%
Cash-on-Cash Return
2.7%
Cap rate
0.5%
Rent to Value Ratio
Active
$474,900
4
bds
|
4
ba
|
2,126
sqft
|
built
1993
246 W 5000 S, Washington Terrace, UT 84405
$-654
Cash flow
-7.2%
Cash-on-Cash Return
4.0%
Cap rate
0.5%
Rent to Value Ratio
Active
$394,000
4
bds
|
2
ba
|
1,840
sqft
|
built
1918
590 7th St, Ogden, UT 84404
$-658
Cash flow
-8.7%
Cash-on-Cash Return
3.7%
Cap rate
0.5%
Rent to Value Ratio
Active
$722,000
5
bds
|
4
ba
|
3,770
sqft
|
built
1999
1164 E 2650 N, North Ogden, UT 84414
$-1,650
Cash flow
-11.9%
Cash-on-Cash Return
2.9%
Cap rate
0.4%
Rent to Value Ratio
Active
$1,699,000
4
bds
|
5
ba
|
4,774
sqft
|
built
2007
946 Meadowlark Ln, Huntsville, UT 84317
$-6,714
Cash flow
-20.6%
Cash-on-Cash Return
0.9%
Cap rate
0.2%
Rent to Value Ratio
Active
$259,900
2
bds
|
2
ba
|
1,198
sqft
|
built
1970
1333 Lorl Ln, Ogden, UT 84404
$-499
Cash flow
-10.0%
Cash-on-Cash Return
3.4%
Cap rate
0.6%
Rent to Value Ratio
Active
$219,900
2
bds
|
2
ba
|
936
sqft
|
built
1982
1325 Lincoln Ave, Ogden, UT 84404
$-754
Cash flow
-17.9%
Cash-on-Cash Return
1.6%
Cap rate
0.4%
Rent to Value Ratio
Active
$1,590,000
4
bds
|
4
ba
|
3,116
sqft
|
built
2015
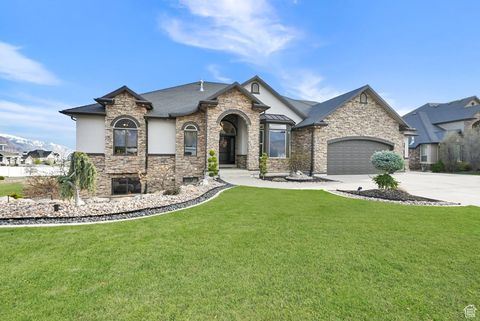
5161 E Moose Hollow Dr, Eden, UT 84310
$-6,516
Cash flow
-21.4%
Cash-on-Cash Return
0.8%
Cap rate
0.2%
Rent to Value Ratio
Active
$620,000
6
bds
|
5
ba
|
4,695
sqft
|
built
1978
822 W 4050 N, Pleasant View, UT 84414
$-887
Cash flow
-7.5%
Cash-on-Cash Return
4.0%
Cap rate
0.6%
Rent to Value Ratio
Active
$599,900
4
bds
|
3
ba
|
2,604
sqft
|
built
2020
2340 W 3225 S, West Haven, UT 84401
$-1,364
Cash flow
-11.9%
Cash-on-Cash Return
3.0%
Cap rate
0.4%
Rent to Value Ratio
Active
$685,000
4
bds
|
3
ba
|
3,453
sqft
|
built
2021
456 E 3675 N, North Ogden, UT 84414
$-582
Cash flow
-4.4%
Cash-on-Cash Return
4.7%
Cap rate
0.6%
Rent to Value Ratio
Active
$1,054,000
4
bds
|
3
ba
|
3,074
sqft
|
built
2006
3435 Big Piney Dr, Eden, UT 84310
$-2,593
Cash flow
-12.8%
Cash-on-Cash Return
2.7%
Cap rate
0.4%
Rent to Value Ratio
Active
$1,348,000
12
bds
|
8
ba
|
7,000
sqft
|
built
2021
302 40th St, South Ogden, UT 84405
$-4,621
Cash flow
-17.9%
Cash-on-Cash Return
1.6%
Cap rate
0.2%
Rent to Value Ratio
Active
$859,900
4
bds
|
4
ba
|
3,028
sqft
|
built
1957
5859 S 3500 W, Roy, UT 84067
$-2,207
Cash flow
-13.4%
Cash-on-Cash Return
2.6%
Cap rate
0.4%
Rent to Value Ratio
Active
$569,000
4
bds
|
3
ba
|
2,963
sqft
|
built
2022
1656 S Prevedel Dr, West Haven, UT 84401
$-1,363
Cash flow
-12.5%
Cash-on-Cash Return
2.8%
Cap rate
0.4%
Rent to Value Ratio
Active
$649,900
4
bds
|
4
ba
|
4,257
sqft
|
built
1986
181 W Lomond View Dr, North Ogden, UT 84414
$-1,654
Cash flow
-13.3%
Cash-on-Cash Return
2.6%
Cap rate
0.4%
Rent to Value Ratio
Active
$453,000
4
bds
|
3
ba
|
3,032
sqft
|
built
2003
4547 S 1250 W, Riverdale, UT 84405
$-1,142
Cash flow
-13.2%
Cash-on-Cash Return
2.7%
Cap rate
0.5%
Rent to Value Ratio
Active
$449,000
5
bds
|
3
ba
|
2,880
sqft
|
built
1912
2424 Jackson Ave, Ogden, UT 84401
$-969
Cash flow
-11.3%
Cash-on-Cash Return
3.1%
Cap rate
0.4%
Rent to Value Ratio
Active
$900,000
7
bds
|
5
ba
|
5,695
sqft
|
built
1996
145 W Lomond View Dr, North Ogden, UT 84414
$-913
Cash flow
-5.3%
Cash-on-Cash Return
4.5%
Cap rate
0.6%
Rent to Value Ratio
Active
$449,900
4
bds
|
2
ba
|
1,650
sqft
|
built
1986
1797 N 700 E, Ogden, UT 84414
$-970
Cash flow
-11.2%
Cash-on-Cash Return
3.1%
Cap rate
0.4%
Rent to Value Ratio
Active
$310,000
3
bds
|
1
ba
|
1,056
sqft
|
built
1890
904 Grant Ave, Ogden, UT 84404
$-439
Cash flow
-7.4%
Cash-on-Cash Return
4.0%
Cap rate
0.5%
Rent to Value Ratio
Active
$665,000
4
bds
|
3
ba
|
3,231
sqft
|
built
2021
3091 N 2450 W, Farr West, UT 84404
$-963
Cash flow
-7.6%
Cash-on-Cash Return
3.9%
Cap rate
0.5%
Rent to Value Ratio

Active
$450,000
3
bds
|
3
ba
|
2,008
sqft
|
built
2024
4016 S Burch Creek Way, South Ogden, UT 84405
$-602
Cash flow
-7.0%
Cash-on-Cash Return
4.1%
Cap rate
0.6%
Rent to Value Ratio

Active
$460,000
3
bds
|
3
ba
|
2,008
sqft
|
built
2024
4004 S Burch Creek Way, South Ogden, UT 84405
$-580
Cash flow
-6.6%
Cash-on-Cash Return
4.2%
Cap rate
0.6%
Rent to Value Ratio
Active
$420,000
5
bds
|
3
ba
|
2,974
sqft
|
built
1935
789 27th St, Ogden, UT 84403
$-484
Cash flow
-6.0%
Cash-on-Cash Return
4.3%
Cap rate
0.6%
Rent to Value Ratio
Active
$965,000
7
bds
|
3
ba
|
3,908
sqft
|
built
1978
712 S 6150 W, Ogden, UT 84404
$-2,029
Cash flow
-11.0%
Cash-on-Cash Return
3.2%
Cap rate
0.4%
Rent to Value Ratio
Active
$1,099,900
3
bds
|
4
ba
|
5,788
sqft
|
built
2012
1356 E 3250 N, North Ogden, UT 84414
$-1,394
Cash flow
-6.6%
Cash-on-Cash Return
4.2%
Cap rate
0.6%
Rent to Value Ratio
Active
$799,000
7
bds
|
5
ba
|
6,190
sqft
|
built
1978
3780 W 5850 S, Roy, UT 84067
$-2,043
Cash flow
-13.3%
Cash-on-Cash Return
2.6%
Cap rate
0.4%
Rent to Value Ratio
Active
$1,649,000
4
bds
|
5
ba
|
3,343
sqft
|
built
2018
3453 N 5250 E, Eden, UT 84310
$-5,312
Cash flow
-16.8%
Cash-on-Cash Return
1.8%
Cap rate
0.3%
Rent to Value Ratio
Active
$520,000
5
bds
|
2
ba
|
2,850
sqft
|
built
1950
3409 Jackson Ave, Ogden, UT 84403
$-778
Cash flow
-7.8%
Cash-on-Cash Return
3.9%
Cap rate
0.5%
Rent to Value Ratio