Weber County Investment Properties for Sale
Browse homes for sale and investment properties in Weber County. Refine your search by price, property type, or more.
Best cash flowing properties in Weber County
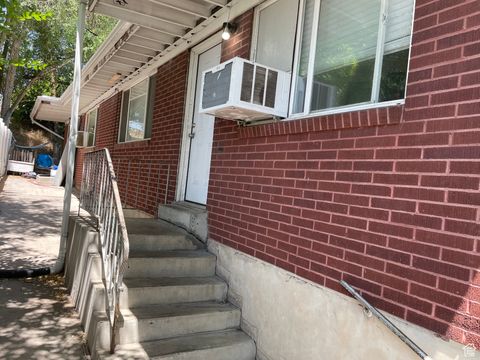
Active
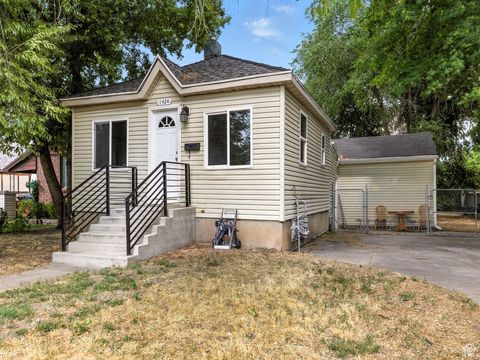
$319,000
4
bds
|
2
ba
|
1,346
sqft
|
built
1937
1424 Jefferson Ave, Ogden, UT 84404
$-312
Cash flow
-5.1%
Cash-on-Cash Return
4.5%
Cap rate
0.6%
Rent to Value Ratio
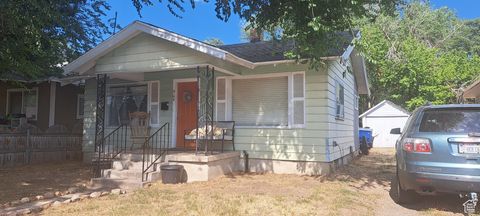
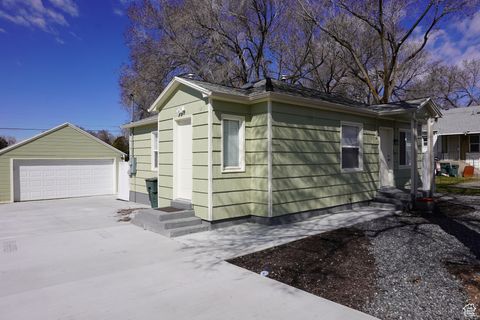
Active
$300,000
3
bds
|
1
ba
|
1,051
sqft
|
built
1927
968 N Jefferson Ave, Ogden, UT 84404
$-341
Cash flow
-5.9%
Cash-on-Cash Return
4.3%
Cap rate
0.6%
Rent to Value Ratio
604 out of 743 properties for sale in Weber County
Limited Results Shown
Create a free account, or log in to reveal all property listings and enjoy the complete experience.
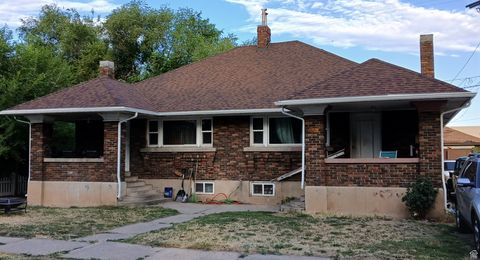
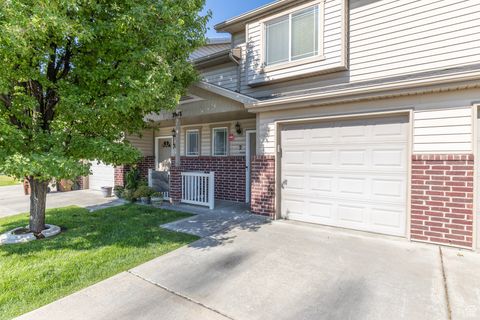
Active
$325,000
2
bds
|
1
ba
|
1,064
sqft
|
built
1944
2553 E 6550 S, Uintah, UT 84405
$-350
Cash flow
-5.6%
Cash-on-Cash Return
4.4%
Cap rate
0.6%
Rent to Value Ratio
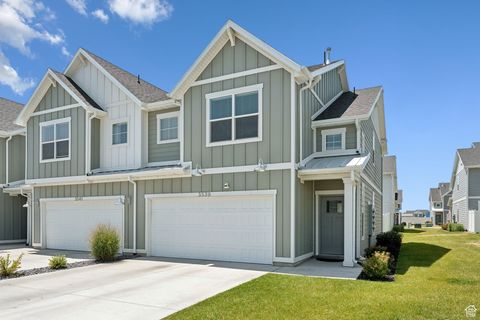
Active
$397,900
3
bds
|
2
ba
|
1,400
sqft
|
built
1933
3567 Adams Ave, Ogden, UT 84403
$-1,105
Cash flow
-14.5%
Cash-on-Cash Return
2.3%
Cap rate
0.4%
Rent to Value Ratio
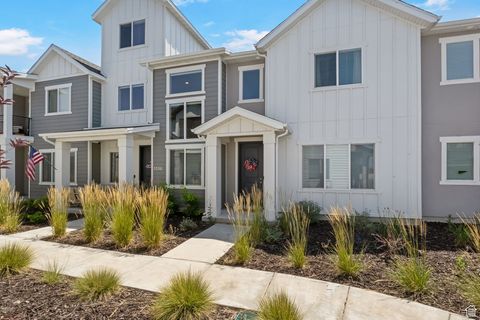
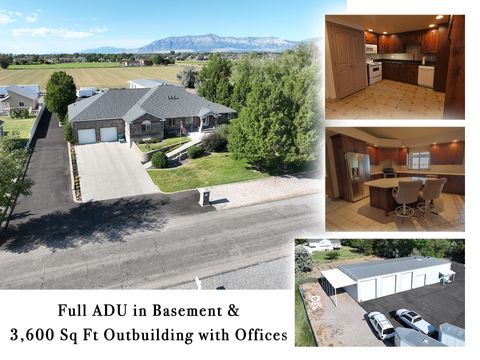
Active
$648,000
5
bds
|
3
ba
|
3,212
sqft
|
built
1986
1505 Navajo Dr, Ogden, UT 84403
$-1,276
Cash flow
-10.3%
Cash-on-Cash Return
3.3%
Cap rate
0.5%
Rent to Value Ratio
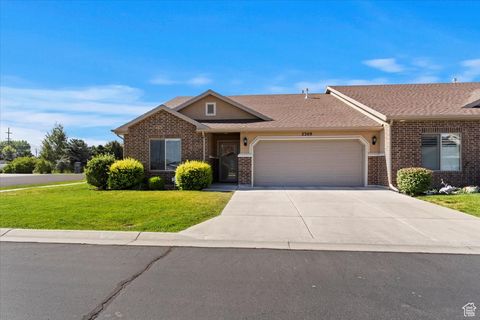
Active
$715,000
4
bds
|
3
ba
|
5,374
sqft
|
built
1984
1681 W 4450 S, Roy, UT 84067
$-886
Cash flow
-6.5%
Cash-on-Cash Return
4.2%
Cap rate
0.6%
Rent to Value Ratio
Active
$1,050,000
6
bds
|
4
ba
|
4,681
sqft
|
built
2013
645 E 3800 N, North Ogden, UT 84414
$-2,926
Cash flow
-14.5%
Cash-on-Cash Return
2.3%
Cap rate
0.3%
Rent to Value Ratio
Active
$869,900
5
bds
|
4
ba
|
3,876
sqft
|
built
2022
411 E 3700 N, North Ogden, UT 84414
$-2,620
Cash flow
-15.7%
Cash-on-Cash Return
2.1%
Cap rate
0.3%
Rent to Value Ratio
Active
$1,499,000
6
bds
|
4
ba
|
5,138
sqft
|
built
2004
3700 N Foothill Ln, Eden, UT 84310
$-4,275
Cash flow
-14.9%
Cash-on-Cash Return
2.3%
Cap rate
0.3%
Rent to Value Ratio
Active
$560,000
5
bds
|
3
ba
|
2,430
sqft
|
built
1975
1955 Eastwood Blvd, South Ogden, UT 84403
$-1,181
Cash flow
-11.0%
Cash-on-Cash Return
3.1%
Cap rate
0.4%
Rent to Value Ratio
Active
$399,900
4
bds
|
3
ba
|
2,012
sqft
|
built
2017
2146 W 5600 S, Roy, UT 84067
$-946
Cash flow
-12.3%
Cash-on-Cash Return
2.8%
Cap rate
0.5%
Rent to Value Ratio
Active
$394,900
4
bds
|
2
ba
|
2,028
sqft
|
built
1956
4042 Porter Ave, South Ogden, UT 84403
$-908
Cash flow
-12.0%
Cash-on-Cash Return
2.9%
Cap rate
0.4%
Rent to Value Ratio
Active
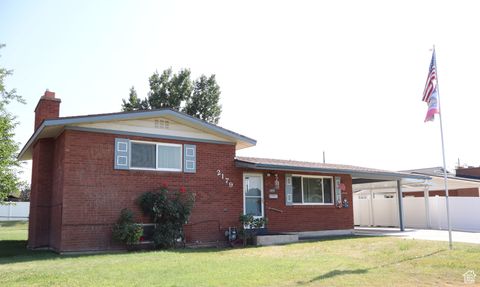
$389,999
3
bds
|
2
ba
|
1,978
sqft
|
built
1962
2179 W 4975 S, Roy, UT 84067
$-801
Cash flow
-10.7%
Cash-on-Cash Return
3.2%
Cap rate
0.5%
Rent to Value Ratio
Active
$2,599,999
4
bds
|
4
ba
|
5,600
sqft
|
built
2021
6260 E Hawks Ln, Huntsville, UT 84317
$-10,805
Cash flow
-21.7%
Cash-on-Cash Return
0.7%
Cap rate
0.1%
Rent to Value Ratio
Active
$619,000
7
bds
|
3
ba
|
2,610
sqft
|
built
1976
738 Grant Ave, Ogden, UT 84404
$-1,814
Cash flow
-15.3%
Cash-on-Cash Return
2.2%
Cap rate
0.3%
Rent to Value Ratio
Active
$375,000
4
bds
|
2
ba
|
1,485
sqft
|
built
1935
769 W 24th St, Ogden, UT 84401
$-712
Cash flow
-9.9%
Cash-on-Cash Return
3.4%
Cap rate
0.5%
Rent to Value Ratio
Active
$589,000
4
bds
|
3
ba
|
2,928
sqft
|
built
2007
273 E 2050 N, North Ogden, UT 84414
$-1,107
Cash flow
-9.8%
Cash-on-Cash Return
3.4%
Cap rate
0.5%
Rent to Value Ratio
Active
$739,000
6
bds
|
3
ba
|
3,794
sqft
|
built
2015
747 W 2775 N, Pleasant View, UT 84414
$-1,592
Cash flow
-11.2%
Cash-on-Cash Return
3.1%
Cap rate
0.4%
Rent to Value Ratio
Active
$644,900
2
bds
|
2
ba
|
1,371
sqft
|
built
2004
6486 E Highway 39, Huntsville, UT 84317
$-2,731
Cash flow
-22.1%
Cash-on-Cash Return
0.6%
Cap rate
0.3%
Rent to Value Ratio
Active
$435,000
4
bds
|
2
ba
|
2,200
sqft
|
built
1962
2011 W 5900 S, Roy, UT 84067
$-601
Cash flow
-7.2%
Cash-on-Cash Return
4.0%
Cap rate
0.6%
Rent to Value Ratio
Active
$454,000
3
bds
|
3
ba
|
1,928
sqft
|
built
1999
694 E 2900 N, North Ogden, UT 84414
$-961
Cash flow
-11.0%
Cash-on-Cash Return
3.1%
Cap rate
0.5%
Rent to Value Ratio
Active
$2,500,000
5
bds
|
5
ba
|
6,390
sqft
|
built
2019
4168 N 3750 E, Eden, UT 84310
$-7,772
Cash flow
-16.2%
Cash-on-Cash Return
1.9%
Cap rate
0.3%
Rent to Value Ratio
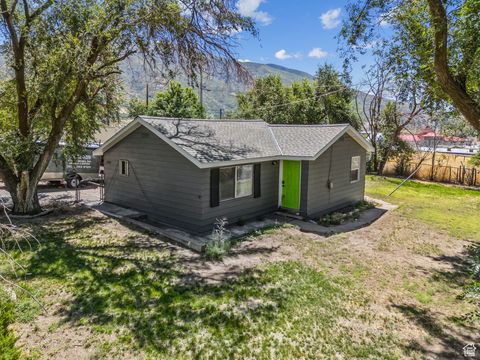
Active
$369,000
3
bds
|
2
ba
|
1,920
sqft
|
built
1960
1228 N Jefferson Ave, Ogden, UT 84404
$-373
Cash flow
-5.3%
Cash-on-Cash Return
4.5%
Cap rate
0.6%
Rent to Value Ratio

Active
$463,000
6
bds
|
3
ba
|
2,104
sqft
|
built
1955
1082 Sherwood Dr, Ogden, UT 84404
$-710
Cash flow
-8.0%
Cash-on-Cash Return
3.8%
Cap rate
0.5%
Rent to Value Ratio
Active
$1,199,000
4
bds
|
4
ba
|
5,306
sqft
|
built
1999
1606 Lakeview Way, Ogden, UT 84403
$-2,769
Cash flow
-12.0%
Cash-on-Cash Return
2.9%
Cap rate
0.4%
Rent to Value Ratio

Active
$480,000
4
bds
|
2
ba
|
1,800
sqft
|
built
1963
724 30th St, Ogden, UT 84403
$-1,237
Cash flow
-13.4%
Cash-on-Cash Return
2.6%
Cap rate
0.4%
Rent to Value Ratio
Active
$519,900
5
bds
|
3
ba
|
2,518
sqft
|
built
1987
1314 E 5250 S, South Ogden, UT 84403
$-1,140
Cash flow
-11.4%
Cash-on-Cash Return
3.0%
Cap rate
0.5%
Rent to Value Ratio
Active
$2,599,000
5
bds
|
4
ba
|
6,265
sqft
|
built
2023
3669 N Foothill Ln, Eden, UT 84310
$-10,373
Cash flow
-20.8%
Cash-on-Cash Return
0.9%
Cap rate
0.2%
Rent to Value Ratio
Active
$544,000
3
bds
|
2
ba
|
1,685
sqft
|
built
1981
2869 S 2700 W, West Haven, UT 84401
$-1,501
Cash flow
-14.4%
Cash-on-Cash Return
2.4%
Cap rate
0.3%
Rent to Value Ratio
Active
$624,900
5
bds
|
3
ba
|
3,073
sqft
|
built
2006
5619 S 4525 W, Hooper, UT 84315
$-1,299
Cash flow
-10.8%
Cash-on-Cash Return
3.2%
Cap rate
0.4%
Rent to Value Ratio
Active
$500,000
6
bds
|
2
ba
|
3,332
sqft
|
built
1924
3121 Ogden Ave, Ogden, UT 84401
$-1,366
Cash flow
-14.3%
Cash-on-Cash Return
2.4%
Cap rate
0.4%
Rent to Value Ratio
Active
$400,000
3
bds
|
3
ba
|
1,608
sqft
|
built
2022
3539 S 4300 W, West Haven, UT 84401
$-850
Cash flow
-11.1%
Cash-on-Cash Return
3.1%
Cap rate
0.5%
Rent to Value Ratio
Active
$389,900
3
bds
|
3
ba
|
1,630
sqft
|
built
2022
3338 W 3745 S, West Haven, UT 84401
$-871
Cash flow
-11.7%
Cash-on-Cash Return
3.0%
Cap rate
0.5%
Rent to Value Ratio
Active
$417,000
2
bds
|
2
ba
|
1,589
sqft
|
built
2017
2309 W 2475 S, West Haven, UT 84401
$-1,087
Cash flow
-13.6%
Cash-on-Cash Return
2.5%
Cap rate
0.4%
Rent to Value Ratio
Active
$480,000
4
bds
|
2
ba
|
1,800
sqft
|
built
1963
718 30th St, Ogden, UT 84403
$-1,306
Cash flow
-14.2%
Cash-on-Cash Return
2.4%
Cap rate
0.4%
Rent to Value Ratio
Active
$349,900
2
bds
|
1
ba
|
855
sqft
|
built
1951
2123 Fowler Ave, Ogden, UT 84401
$-696
Cash flow
-10.4%
Cash-on-Cash Return
3.3%
Cap rate
0.5%
Rent to Value Ratio
Active
$299,000
3
bds
|
2
ba
|
1,133
sqft
|
built
2005
3963 S 2900 W, West Haven, UT 84401
$-667
Cash flow
-11.6%
Cash-on-Cash Return
3.0%
Cap rate
0.5%
Rent to Value Ratio
Active
$1,245,000
6
bds
|
5
ba
|
5,436
sqft
|
built
2002
5160 W 5725 S, Hooper, UT 84315
$-4,340
Cash flow
-18.2%
Cash-on-Cash Return
1.5%
Cap rate
0.2%
Rent to Value Ratio
Active
$449,900
4
bds
|
3
ba
|
3,092
sqft
|
built
1997
1219 W 4500 S, Riverdale, UT 84405
$-641
Cash flow
-7.4%
Cash-on-Cash Return
4.0%
Cap rate
0.6%
Rent to Value Ratio
Active
$675,000
4
bds
|
4
ba
|
3,633
sqft
|
built
1949
2537 Taylor Ave, Ogden, UT 84401
$-1,255
Cash flow
-9.7%
Cash-on-Cash Return
3.4%
Cap rate
0.5%
Rent to Value Ratio