Lee County Investment Properties for Sale
Browse homes for sale and investment properties in Lee County. Refine your search by price, property type, or more.
Best cash flowing properties in Lee County
Active
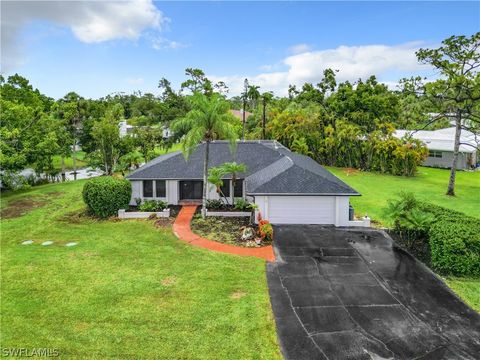
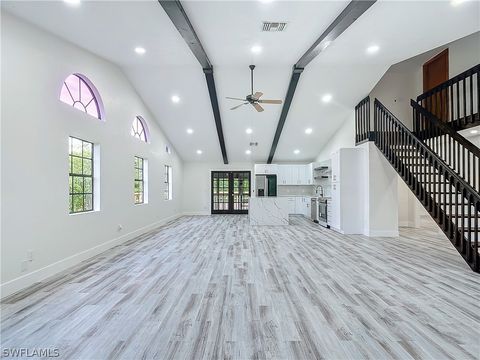
$545,000
4
bds
|
3
ba
|
2,167
sqft
|
built
1986
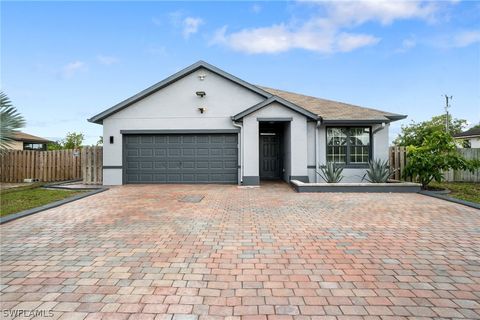
13350 Marquette Blvd, Fort Myers, FL 33905
$1,810
Cash flow
17.3%
Cash-on-Cash Return
10.1%
Cap rate
1.3%
Rent to Value Ratio
Active
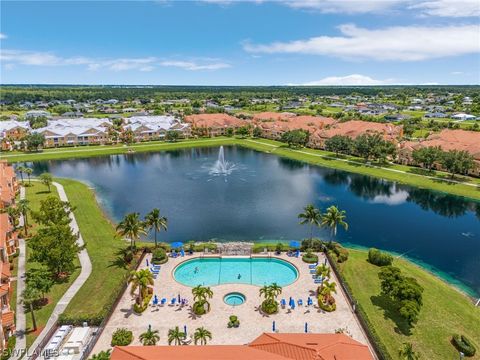
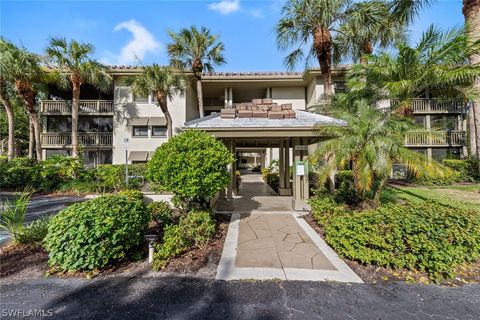
$823,000
4
bds
|
2
ba
|
2,246
sqft
|
built
2017
28111 Edenderry Ct, Bonita Springs, FL 34135
$519
Cash flow
3.3%
Cash-on-Cash Return
6.9%
Cap rate
1.1%
Rent to Value Ratio
5,830 out of 6,960 properties for sale in Lee County
Limited Results Shown
Create a free account, or log in to reveal all property listings and enjoy the complete experience.
Active
$634,750
3
bds
|
2
ba
|
1,975
sqft
|
built
1987
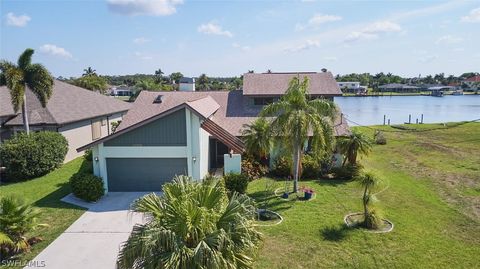
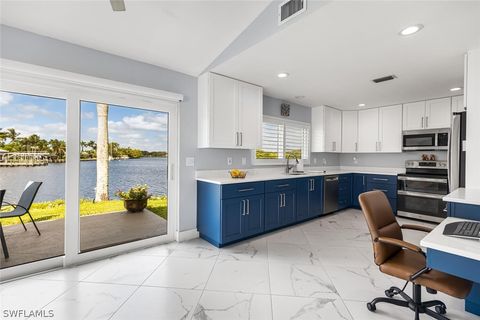
4809 SW 13th Ave, Cape Coral, FL 33914
$-1,703
Cash flow
-14.0%
Cash-on-Cash Return
2.9%
Cap rate
0.6%
Rent to Value Ratio
Active
$359,000
3
bds
|
2
ba
|
1,671
sqft
|
built
2019
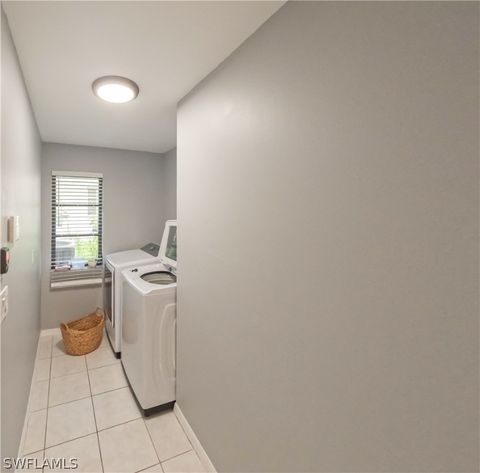
602 SW 25th St, Cape Coral, FL 33914
$-412
Cash flow
-6.0%
Cash-on-Cash Return
4.8%
Cap rate
0.7%
Rent to Value Ratio
Active
$599,900
3
bds
|
3
ba
|
2,129
sqft
|
built
1976
3679 Woodstork Ct, Fort Myers, FL 33908
$-108
Cash flow
-0.9%
Cash-on-Cash Return
5.9%
Cap rate
0.7%
Rent to Value Ratio
Active
$359,900
3
bds
|
2
ba
|
1,726
sqft
|
built
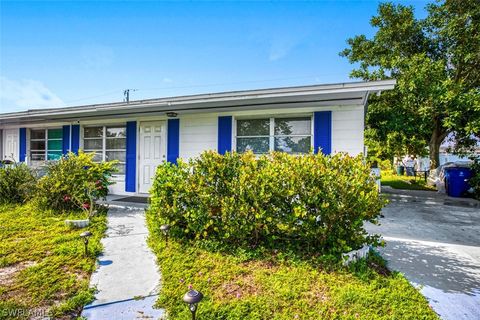
1988
16970 Carolyn Ln, North Fort Myers, FL 33917
$337
Cash flow
4.9%
Cash-on-Cash Return
7.3%
Cap rate
0.9%
Rent to Value Ratio
Active
$155,000
1
bds
|
1
ba
|
1,147
sqft
|
built
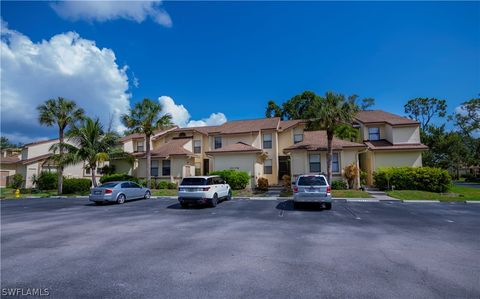
2006
1865 Concordia Lake Cir, Cape Coral, FL 33909
$-217
Cash flow
-7.3%
Cash-on-Cash Return
4.5%
Cap rate
1.1%
Rent to Value Ratio
Active
$335,000
2
bds
|
2
ba
|
839
sqft
|
built
1986
3651 Wild Pines Dr, Bonita Springs, FL 34134
$-825
Cash flow
-12.8%
Cash-on-Cash Return
3.2%
Cap rate
0.7%
Rent to Value Ratio
Active
$145,000
2
bds
|
2
ba
|
1,069
sqft
|
built
1981
1051 Palm Ave, North Fort Myers, FL 33903
$357
Cash flow
12.8%
Cash-on-Cash Return
9.1%
Cap rate
1.1%
Rent to Value Ratio
Active
$199,000
2
bds
|
2
ba
|
1,011
sqft
|
built
2001
14931 Park Lake Dr, Fort Myers, FL 33919
$-641
Cash flow
-16.8%
Cash-on-Cash Return
2.3%
Cap rate
0.9%
Rent to Value Ratio
Active
$359,000
2
bds
|
2
ba
|
1,393
sqft
|
built
1991
4251 Lake Forest Dr, Bonita Springs, FL 34134
$-1,469
Cash flow
-21.3%
Cash-on-Cash Return
1.2%
Cap rate
0.8%
Rent to Value Ratio
Active
$419,000
2
bds
|
2
ba
|
1,553
sqft
|
built
1999
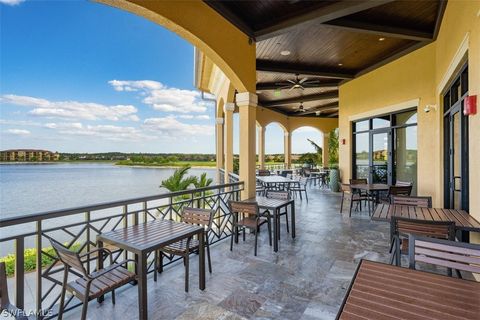
17844 Hibiscus Cove Ct, Punta Gorda, FL 33955
$-329
Cash flow
-4.1%
Cash-on-Cash Return
5.2%
Cap rate
0.7%
Rent to Value Ratio
Active
$415,000
3
bds
|
2
ba
|
1,926
sqft
|
built
2017
2730 Vareo Ct, Cape Coral, FL 33991
$-620
Cash flow
-7.8%
Cash-on-Cash Return
4.4%
Cap rate
0.7%
Rent to Value Ratio

Active
$6,500,000
6
bds
|
7
ba
|
8,000
sqft
|
built
1972
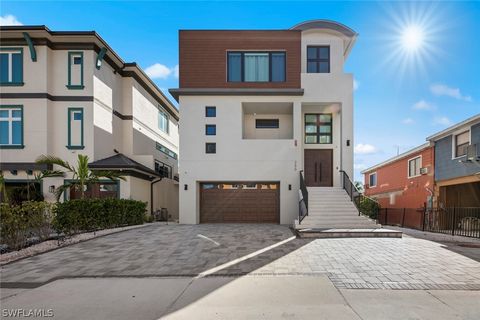
3788 Harold Ave, Fort Myers, FL 33901
$-30,332
Cash flow
-24.3%
Cash-on-Cash Return
0.5%
Cap rate
0.1%
Rent to Value Ratio
Active
$289,000
3
bds
|
2
ba
|
1,846
sqft
|
built
1977
219 SE 46th Ter, Cape Coral, FL 33904
$-332
Cash flow
-6.0%
Cash-on-Cash Return
4.8%
Cap rate
0.8%
Rent to Value Ratio
Active
$612,000
3
bds
|
2
ba
|
2,659
sqft
|
built
1986
15854 Gleneagle Ct, Fort Myers, FL 33908
$-872
Cash flow
-7.4%
Cash-on-Cash Return
4.4%
Cap rate
0.6%
Rent to Value Ratio
Active
$259,999
3
bds
|
3
ba
|
1,611
sqft
|
built
2006
3350 Dandolo Cir, Cape Coral, FL 33909
$-641
Cash flow
-12.9%
Cash-on-Cash Return
3.2%
Cap rate
0.8%
Rent to Value Ratio
Active
$449,900
3
bds
|
2
ba
|
1,686
sqft
|
built
2000
1613 Orchid Blvd, Cape Coral, FL 33904
$-1,405
Cash flow
-16.3%
Cash-on-Cash Return
2.4%
Cap rate
0.7%
Rent to Value Ratio
Active
$156,900
2
bds
|
1
ba
|
888
sqft
|
built
1971
4608 SE 6th Ave, Cape Coral, FL 33904
$189
Cash flow
6.3%
Cash-on-Cash Return
7.6%
Cap rate
1.0%
Rent to Value Ratio
Active
$209,000
2
bds
|
1
ba
|
873
sqft
|
built
2005
4122 Residence Dr, Fort Myers, FL 33901
$-716
Cash flow
-17.9%
Cash-on-Cash Return
2.0%
Cap rate
0.8%
Rent to Value Ratio
Active
$275,000
3
bds
|
2
ba
|
1,330
sqft
|
built
1973
326 SE 47th St, Cape Coral, FL 33904
$-338
Cash flow
-6.4%
Cash-on-Cash Return
4.7%
Cap rate
0.7%
Rent to Value Ratio

Active
$33,880,000
6
bds
|
8
ba
|
11,068
sqft
|
built
2009
6111 Sanibel Captiva Rd, Sanibel, FL 33957
$-173,736
Cash flow
-26.8%
Cash-on-Cash Return
0.0%
Cap rate
0.0%
Rent to Value Ratio
Active
$270,000
2
bds
|
2
ba
|
1,373
sqft
|
built
2005
2615 Somerville Loop, Cape Coral, FL 33991
$-444
Cash flow
-8.6%
Cash-on-Cash Return
4.2%
Cap rate
0.8%
Rent to Value Ratio
Active
$290,000
3
bds
|
2
ba
|
1,773
sqft
|
built
1994
15270 Cricket Ln, Fort Myers, FL 33919
$-23
Cash flow
-0.4%
Cash-on-Cash Return
6.1%
Cap rate
0.9%
Rent to Value Ratio
Active
$450,000
4
bds
|
2
ba
|
2,320
sqft
|
built
2001
8853 Cypress Preserve Pl, Fort Myers, FL 33912
$-440
Cash flow
-5.1%
Cash-on-Cash Return
5.0%
Cap rate
0.7%
Rent to Value Ratio
Active
$239,900
2
bds
|
3
ba
|
1,101
sqft
|
built
1981
18006 San Carlos Blvd, Fort Myers Beach, FL 33931
$317
Cash flow
6.9%
Cash-on-Cash Return
7.7%
Cap rate
1.0%
Rent to Value Ratio
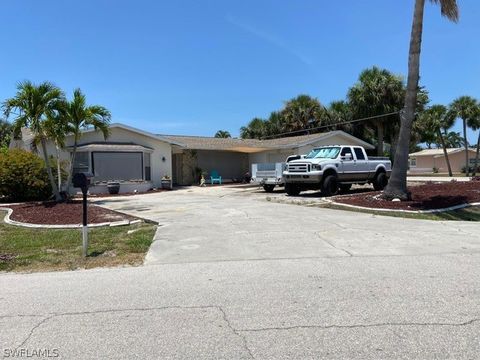
Active
$790,000
5
bds
|
3
ba
|
1,878
sqft
|
built
1978
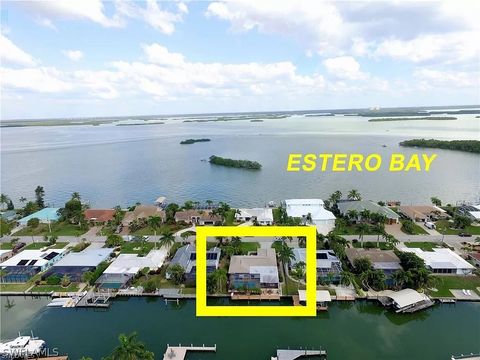
16 Bayview Blvd, Fort Myers Beach, FL 33931
$-1,101
Cash flow
-7.3%
Cash-on-Cash Return
4.5%
Cap rate
0.6%
Rent to Value Ratio
Active
$729,000
3
bds
|
2
ba
|
2,198
sqft
|
built
1987
2215 SE 10th Ln, Cape Coral, FL 33990
$-1,352
Cash flow
-9.7%
Cash-on-Cash Return
3.9%
Cap rate
0.5%
Rent to Value Ratio
Active
$5,900,000
3
bds
|
2
ba
|
2,305
sqft
|
built
1973
592 Lighthouse Way, Sanibel, FL 33957
$-26,491
Cash flow
-23.4%
Cash-on-Cash Return
0.8%
Cap rate
0.1%
Rent to Value Ratio
Active
$450,000
4
bds
|
2
ba
|
1,828
sqft
|
built
2021
2749 NE 7th Pl, Cape Coral, FL 33909
$-480
Cash flow
-5.6%
Cash-on-Cash Return
4.9%
Cap rate
0.7%
Rent to Value Ratio
Active
$174,900
2
bds
|
2
ba
|
884
sqft
|
built
1964
1116 Westminster St W, Lehigh Acres, FL 33936
$-4
Cash flow
-0.1%
Cash-on-Cash Return
6.1%
Cap rate
0.8%
Rent to Value Ratio
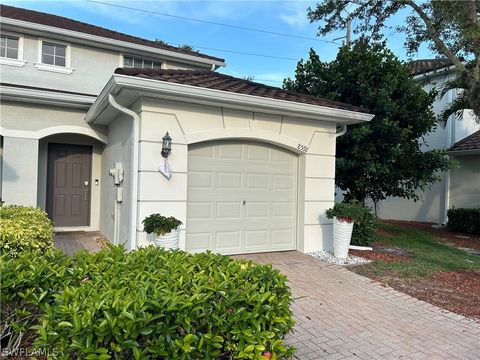
Active
$224,900
2
bds
|
2
ba
|
909
sqft
|
built
1987
15178 Parkside Dr, Fort Myers, FL 33908
$-517
Cash flow
-12.0%
Cash-on-Cash Return
3.4%
Cap rate
0.8%
Rent to Value Ratio
Active
$775,000
2
bds
|
2
ba
|
1,545
sqft
|
built
1989
14900 Wise Way, Fort Myers, FL 33905
$-1,766
Cash flow
-11.9%
Cash-on-Cash Return
3.4%
Cap rate
0.5%
Rent to Value Ratio
Active
$3,950,000
3
bds
|
4
ba
|
3,157
sqft
|
built
2020
250 Crescent St, Fort Myers Beach, FL 33931
$-16,779
Cash flow
-22.2%
Cash-on-Cash Return
1.0%
Cap rate
0.2%
Rent to Value Ratio
Active
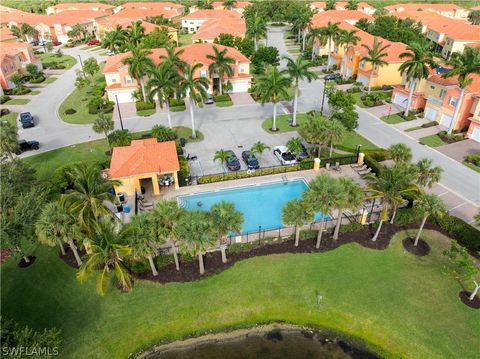
$210,000
3
bds
|
3
ba
|
1,819
sqft
|
built
2006
16141 Via Solera Cir, Fort Myers, FL 33908
$-222
Cash flow
-5.5%
Cash-on-Cash Return
4.9%
Cap rate
1.1%
Rent to Value Ratio
Active
$277,000
2
bds
|
3
ba
|
1,191
sqft
|
built
2006
8591 Athena Ct, Lehigh Acres, FL 33971
$-861
Cash flow
-16.2%
Cash-on-Cash Return
2.4%
Cap rate
0.6%
Rent to Value Ratio
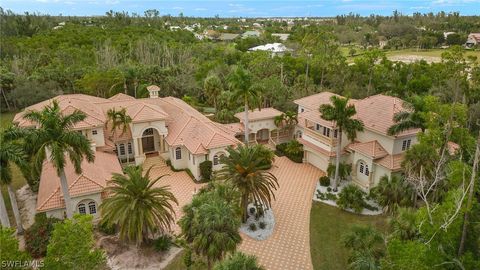
Active
$5,699,000
6
bds
|
6
ba
|
11,190
sqft
|
built
2002
15401 Old Wedgewood Ct, Fort Myers, FL 33908
$-26,311
Cash flow
-24.1%
Cash-on-Cash Return
0.6%
Cap rate
0.1%
Rent to Value Ratio
Active
$629,000
3
bds
|
2
ba
|
2,266
sqft
|
built
1973
5304 Bayshore Ave, Cape Coral, FL 33904
$-2,004
Cash flow
-16.6%
Cash-on-Cash Return
2.3%
Cap rate
0.6%
Rent to Value Ratio

Active
$639,900
3
bds
|
3
ba
|
2,065
sqft
|
built
2005
3333 Sunset Key Cir, Punta Gorda, FL 33955
$-1,076
Cash flow
-8.8%
Cash-on-Cash Return
4.1%
Cap rate
0.7%
Rent to Value Ratio
Active
$309,000
4
bds
|
2
ba
|
1,690
sqft
|
built
2008
466 Redwing St, Lehigh Acres, FL 33974
$-390
Cash flow
-6.6%
Cash-on-Cash Return
4.6%
Cap rate
0.6%
Rent to Value Ratio