Norfolk County Investment Properties for Sale
Browse homes for sale and investment properties in Norfolk County. Refine your search by price, property type, or more.
Best cash flowing properties in Norfolk County
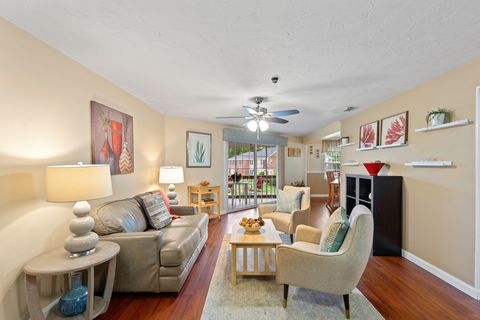
Active
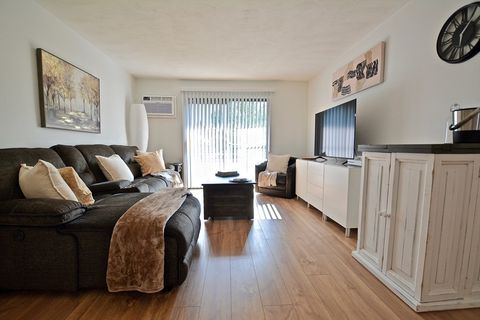
$249,900
1
bds
|
1
ba
|
660
sqft
|
built
1978
151 Bittersweet Ln, Randolph, MA 02368
$-212
Cash flow
-4.4%
Cash-on-Cash Return
4.7%
Cap rate
0.9%
Rent to Value Ratio
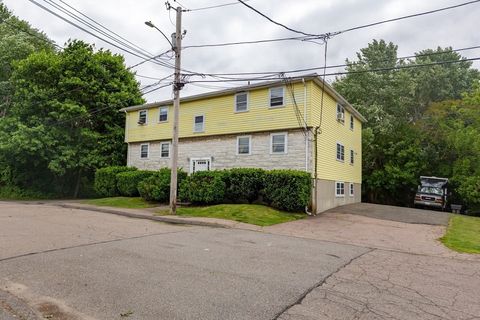
Active
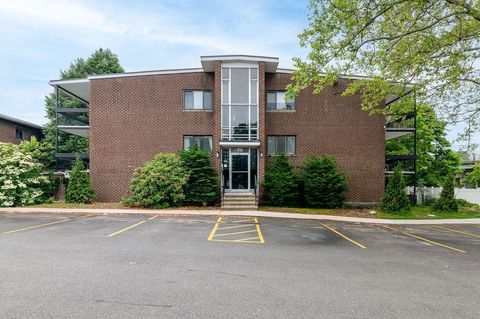
$299,000
1
bds
|
1
ba
|
732
sqft
|
built
1969
150 Elm St, Braintree, MA 02184
$-324
Cash flow
-5.7%
Cash-on-Cash Return
4.4%
Cap rate
0.8%
Rent to Value Ratio
369 out of 571 properties for sale in Norfolk County
Limited Results Shown
Create a free account, or log in to reveal all property listings and enjoy the complete experience.
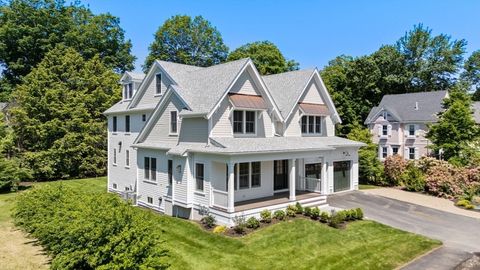
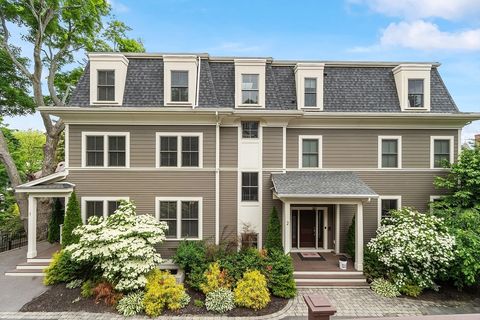
Active
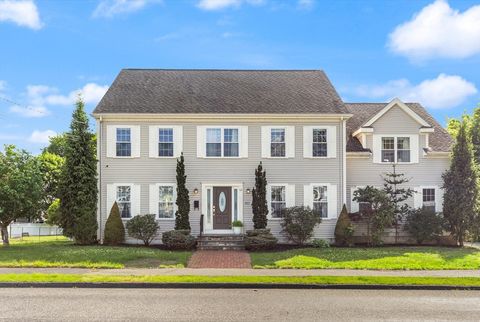
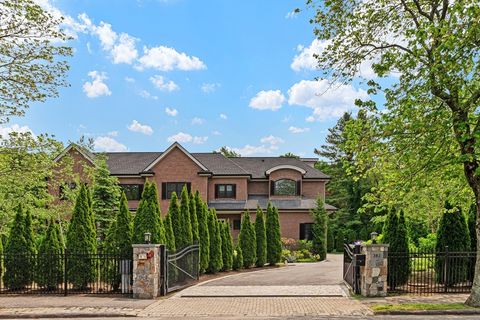
$2,350,000
6
bds
|
5
ba
|
3,698
sqft
|
built
2005
263 Hunnewell St, Needham, MA 02494
$-7,058
Cash flow
-15.7%
Cash-on-Cash Return
2.1%
Cap rate
0.3%
Rent to Value Ratio
Active
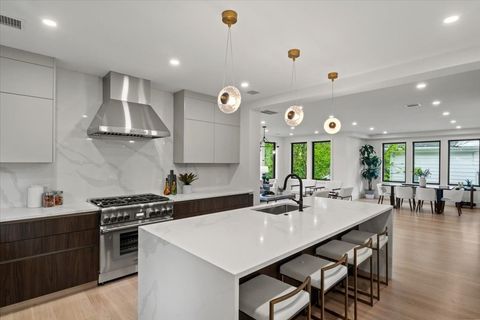
$6,100,000
8
bds
|
8
ba
|
6,000
sqft
|
built
1895
116 Thorndike St, Brookline, MA 02446
$-8,358,267
Cash flow
-7148.9%
Cash-on-Cash Return
-1638.6%
Cap rate
0.1%
Rent to Value Ratio
Active
$1,249,000
3
bds
|
3
ba
|
1,554
sqft
|
built
1908
104 Kings Cove Beach Rd, Weymouth, MA 02191
$-3,445
Cash flow
-14.4%
Cash-on-Cash Return
2.4%
Cap rate
0.4%
Rent to Value Ratio
Active
$499,900
4
bds
|
1
ba
|
1,212
sqft
|
built
1948
111 Ralph Mann Dr, Stoughton, MA 02072
$-560
Cash flow
-5.8%
Cash-on-Cash Return
4.3%
Cap rate
0.6%
Rent to Value Ratio
Active
$779,900
3
bds
|
3
ba
|
2,294
sqft
|
built
1997
6 Fleuette Dr, Bellingham, MA 02019
$-1,579
Cash flow
-10.6%
Cash-on-Cash Return
3.2%
Cap rate
0.5%
Rent to Value Ratio
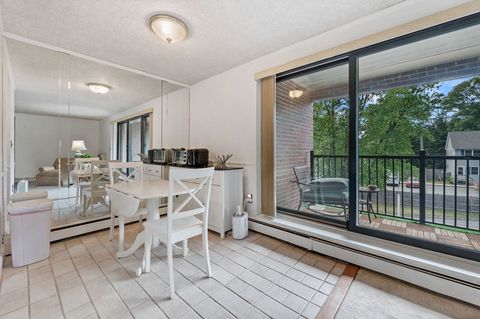
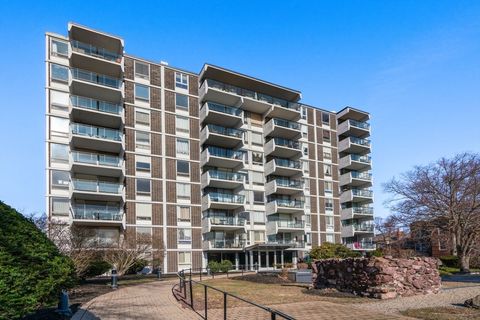
Active
$659,000
1
bds
|
2
ba
|
938
sqft
|
built
1975
60 Longwood Ave, Brookline, MA 02446
$-2,419
Cash flow
-19.2%
Cash-on-Cash Return
1.3%
Cap rate
0.5%
Rent to Value Ratio
Active
$5,275,000
5
bds
|
6
ba
|
7,056
sqft
|
built
2022
62 Bay St, Quincy, MA 02171
$-22,311
Cash flow
-22.1%
Cash-on-Cash Return
0.6%
Cap rate
0.2%
Rent to Value Ratio
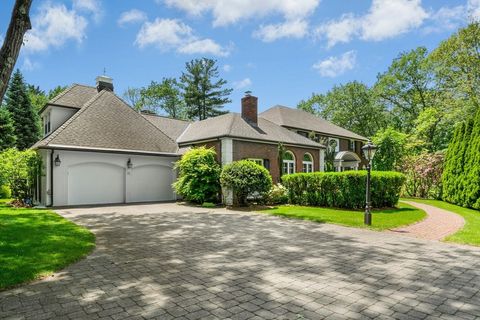
Active
$4,395,000
5
bds
|
6
ba
|
8,100
sqft
|
built
1913
90 Burr Dr, Needham, MA 02492
$-19,879
Cash flow
-23.6%
Cash-on-Cash Return
0.3%
Cap rate
0.1%
Rent to Value Ratio
Active
$2,195,000
6
bds
|
5
ba
|
4,410
sqft
|
built
2020
1473 Great Plain Ave, Needham, MA 02492
$-5,272
Cash flow
-12.5%
Cash-on-Cash Return
2.8%
Cap rate
0.5%
Rent to Value Ratio
Active
$2,699,000
4
bds
|
6
ba
|
4,600
sqft
|
built
2021
935 E Squantum St, Quincy, MA 02171
$-8,039
Cash flow
-15.5%
Cash-on-Cash Return
2.1%
Cap rate
0.4%
Rent to Value Ratio
Active
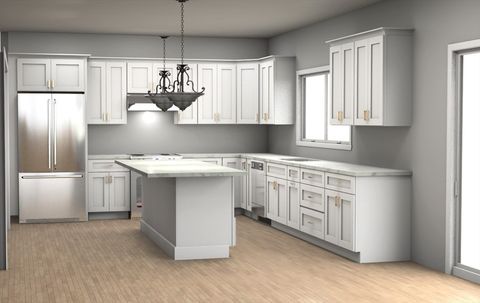
$1,375,000
3
bds
|
2
ba
|
1,199
sqft
|
built
1877
39 Park Ave, Wellesley, MA 02481
$-4,061
Cash flow
-15.4%
Cash-on-Cash Return
2.1%
Cap rate
0.4%
Rent to Value Ratio
Active
$2,475,000
6
bds
|
5
ba
|
6,752
sqft
|
built
1997
828 South St, Needham, MA 02492
$-9,192
Cash flow
-19.4%
Cash-on-Cash Return
1.2%
Cap rate
0.3%
Rent to Value Ratio
Active
$1,895,750
5
bds
|
4
ba
|
5,006
sqft
|
built
1949
247 Forest Ave, Cohasset, MA 02025
$-2,381
Cash flow
-6.6%
Cash-on-Cash Return
4.2%
Cap rate
0.6%
Rent to Value Ratio
Active
$2,300,000
3
bds
|
3
ba
|
3,183
sqft
|
built
1925
50 Surfside Ln, Quincy, MA 02171
$-8,368
Cash flow
-19.0%
Cash-on-Cash Return
1.3%
Cap rate
0.3%
Rent to Value Ratio
Active
$1,190,000
6
bds
|
3
ba
|
2,606
sqft
|
built
1939
15 California Ave, Milton, MA 02186
$-3,318
Cash flow
-14.5%
Cash-on-Cash Return
2.3%
Cap rate
0.4%
Rent to Value Ratio
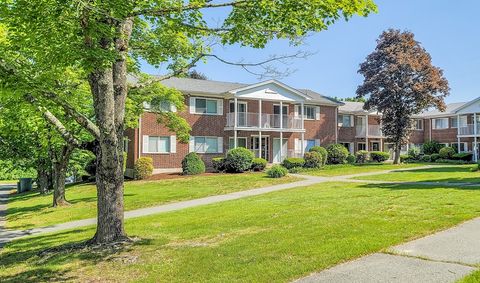
Active
$479,900
2
bds
|
2
ba
|
1,371
sqft
|
built
1988
36 N Stone Mill Dr, Dedham, MA 02026
$-1,711
Cash flow
-18.6%
Cash-on-Cash Return
1.4%
Cap rate
0.7%
Rent to Value Ratio
Active
$698,999
3
bds
|
2
ba
|
1,829
sqft
|
built
1880
295 Rock Island Rd, Quincy, MA 02169
$-1,527
Cash flow
-11.4%
Cash-on-Cash Return
3.1%
Cap rate
0.5%
Rent to Value Ratio
Active
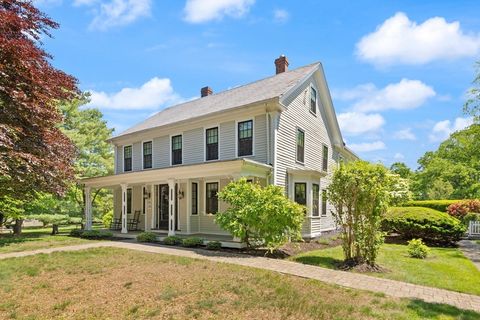
$1,199,000
3
bds
|
3
ba
|
2,986
sqft
|
built
1740
55 Dwight St, Dedham, MA 02026
$-5,315
Cash flow
-23.1%
Cash-on-Cash Return
0.4%
Cap rate
0.2%
Rent to Value Ratio
Active
$6,100,000
5
bds
|
6
ba
|
6,841
sqft
|
built
2017
382 Lee St, Brookline, MA 02445
$-27,646
Cash flow
-23.6%
Cash-on-Cash Return
0.2%
Cap rate
0.1%
Rent to Value Ratio
Active
$2,395,000
5
bds
|
5
ba
|
5,500
sqft
|
built
2016
50 Sterling Rd, Needham, MA 02492
$-7,439
Cash flow
-16.2%
Cash-on-Cash Return
2.0%
Cap rate
0.3%
Rent to Value Ratio
Active
$360,000
2
bds
|
1
ba
|
954
sqft
|
built
1975
269 Lake St, Weymouth, MA 02189
$-794
Cash flow
-11.5%
Cash-on-Cash Return
3.0%
Cap rate
0.7%
Rent to Value Ratio
Active
$989,900
4
bds
|
3
ba
|
2,579
sqft
|
built
2025
485 Main St, Millis, MA 02054
$-2,771
Cash flow
-14.6%
Cash-on-Cash Return
2.3%
Cap rate
0.3%
Rent to Value Ratio
Active
$1,495,000
4
bds
|
4
ba
|
3,315
sqft
|
built
1790
240 Canton St, Westwood, MA 02090
$-4,535
Cash flow
-15.8%
Cash-on-Cash Return
2.0%
Cap rate
0.4%
Rent to Value Ratio
Active
$850,000
4
bds
|
2
ba
|
1,867
sqft
|
built
1927
33 Samoset Ave, Quincy, MA 02169
$-2,220
Cash flow
-13.6%
Cash-on-Cash Return
2.5%
Cap rate
0.4%
Rent to Value Ratio
Active
$669,000
3
bds
|
1
ba
|
1,458
sqft
|
built
1930
414 Cedar St, Dedham, MA 02026
$-1,096
Cash flow
-8.5%
Cash-on-Cash Return
3.7%
Cap rate
0.6%
Rent to Value Ratio
Active
$699,900
3
bds
|
3
ba
|
1,962
sqft
|
built
2019
70 Endicott St, Norwood, MA 02062
$-1,674
Cash flow
-12.5%
Cash-on-Cash Return
2.8%
Cap rate
0.6%
Rent to Value Ratio
Active
$2,000,000
3
bds
|
1
ba
|
1,414
sqft
|
built
1875
661 North St, Randolph, MA 02368
$-7,620
Cash flow
-19.9%
Cash-on-Cash Return
1.1%
Cap rate
0.2%
Rent to Value Ratio
Active
$3,475,000
5
bds
|
6
ba
|
6,300
sqft
|
built
2025
233 Warren St, Needham, MA 02492
$-16,093
Cash flow
-24.2%
Cash-on-Cash Return
0.1%
Cap rate
0.1%
Rent to Value Ratio
Active
$3,889,000
4
bds
|
6
ba
|
5,349
sqft
|
built
1972
11 Scotch Pine Cir, Wellesley, MA 02481
$-13,041
Cash flow
-17.5%
Cash-on-Cash Return
1.7%
Cap rate
0.3%
Rent to Value Ratio
Active
$304,900
1
bds
|
1
ba
|
731
sqft
|
built
1972
41 Bayberry Dr, Sharon, MA 02067
$-899
Cash flow
-15.4%
Cash-on-Cash Return
2.1%
Cap rate
0.7%
Rent to Value Ratio
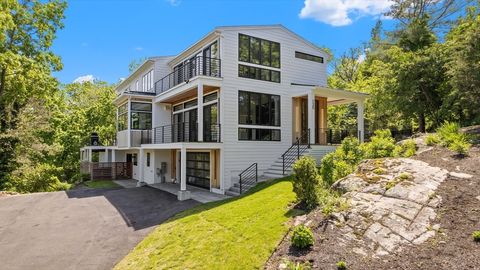
Active
$3,250,000
5
bds
|
5
ba
|
4,600
sqft
|
built
2023
135 Beach St, Cohasset, MA 02025
$-9,680
Cash flow
-15.5%
Cash-on-Cash Return
2.1%
Cap rate
0.4%
Rent to Value Ratio
Active
$18,000,000
6
bds
|
8
ba
|
9,411
sqft
|
built
1915
63 Goddard Ave, Brookline, MA 02445
$-88,803
Cash flow
-25.7%
Cash-on-Cash Return
-0.2%
Cap rate
0.1%
Rent to Value Ratio
Active
$3,779,000
6
bds
|
6
ba
|
5,000
sqft
|
built
2018
33 Winthrop Rd, Brookline, MA 02445
$-14,133
Cash flow
-19.5%
Cash-on-Cash Return
1.2%
Cap rate
0.3%
Rent to Value Ratio
Active
$639,000
1
bds
|
1
ba
|
665
sqft
|
built
1968
60 Babcock St, Brookline, MA 02446
$-2,128
Cash flow
-17.4%
Cash-on-Cash Return
1.7%
Cap rate
0.5%
Rent to Value Ratio
Active
$399,000
2
bds
|
2
ba
|
1,250
sqft
|
built
1973
111 Ethyl Way, Stoughton, MA 02072
$-830
Cash flow
-10.9%
Cash-on-Cash Return
3.2%
Cap rate
0.7%
Rent to Value Ratio
Active
$2,150,000
10
bds
|
6
ba
|
5,232
sqft
|
built
1980
51 Stoughton St, Quincy, MA 02169
$-9,519
Cash flow
-23.1%
Cash-on-Cash Return
0.4%
Cap rate
0.1%
Rent to Value Ratio
Active
$789,000
3
bds
|
3
ba
|
2,804
sqft
|
built
1995
283 Palisades Cir, Stoughton, MA 02072
$-1,443
Cash flow
-9.5%
Cash-on-Cash Return
3.5%
Cap rate
0.6%
Rent to Value Ratio
Active
$699,000
3
bds
|
2
ba
|
1,416
sqft
|
built
1900
143 Arlington St, Quincy, MA 02170
$-1,668
Cash flow
-12.5%
Cash-on-Cash Return
2.8%
Cap rate
0.5%
Rent to Value Ratio