Suffolk County Investment Properties for Sale
Browse homes for sale and investment properties in Suffolk County. Refine your search by price, property type, or more.
Best cash flowing properties in Suffolk County
Active
$606,853
2
bds
|
1
ba
|
1,020
sqft
|
built
2008
150 Dorchester Ave, Boston, MA 02127
$-362
Cash flow
-3.1%
Cash-on-Cash Return
5.0%
Cap rate
0.6%
Rent to Value Ratio
Active
$337,850
2
bds
|
1
ba
|
652
sqft
|
built
1970
770 Cummins Hwy, Boston, MA 02126
$-402
Cash flow
-6.2%
Cash-on-Cash Return
4.3%
Cap rate
0.7%
Rent to Value Ratio
612 out of 1,045 properties for sale in Suffolk County
Limited Results Shown
Create a free account, or log in to reveal all property listings and enjoy the complete experience.
Active
$995,000
2
bds
|
1
ba
|
784
sqft
|
built
1900
300 Commercial St, Boston, MA 02109
$-2,884
Cash flow
-15.1%
Cash-on-Cash Return
2.2%
Cap rate
0.5%
Rent to Value Ratio
Active
$1,399,000
2
bds
|
2
ba
|
1,035
sqft
|
built
1924
180 Commonwealth Ave, Boston, MA 02116
$-4,506
Cash flow
-16.8%
Cash-on-Cash Return
1.8%
Cap rate
0.4%
Rent to Value Ratio
Active
$1,049,000
2
bds
|
2
ba
|
1,117
sqft
|
built
2000
73 Chelsea St, Boston, MA 02129
$-3,619
Cash flow
-18.0%
Cash-on-Cash Return
1.5%
Cap rate
0.4%
Rent to Value Ratio
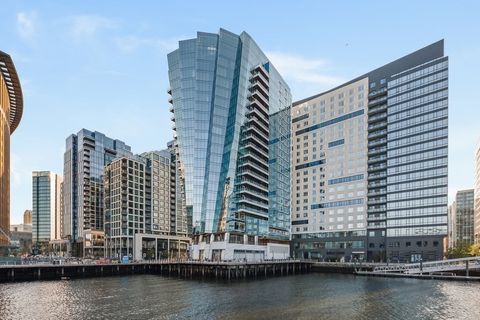
Active
$1,850,000
1
bds
|
1
ba
|
895
sqft
|
built
2022
150 Seaport Blvd, Boston, MA 02210
$-6,953
Cash flow
-19.6%
Cash-on-Cash Return
1.2%
Cap rate
0.4%
Rent to Value Ratio
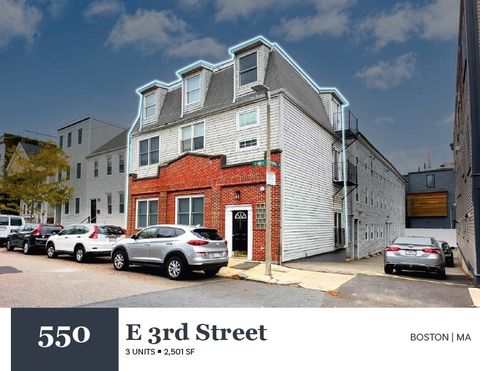
Active
$1,850,000
6
bds
|
3
ba
|
2,501
sqft
|
built
2000
550 E 3rd St, Boston, MA 02127
$-6,024
Cash flow
-17.0%
Cash-on-Cash Return
1.8%
Cap rate
0.3%
Rent to Value Ratio
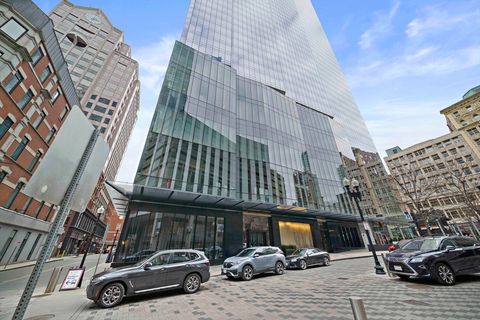
Active
$1,600,000
2
bds
|
2
ba
|
1,498
sqft
|
built
2016
1 Franklin St, Boston, MA 02110
$-5,036
Cash flow
-16.4%
Cash-on-Cash Return
1.9%
Cap rate
0.5%
Rent to Value Ratio
Active
$1,189,000
11
bds
|
3
ba
|
3,000
sqft
|
built
1890
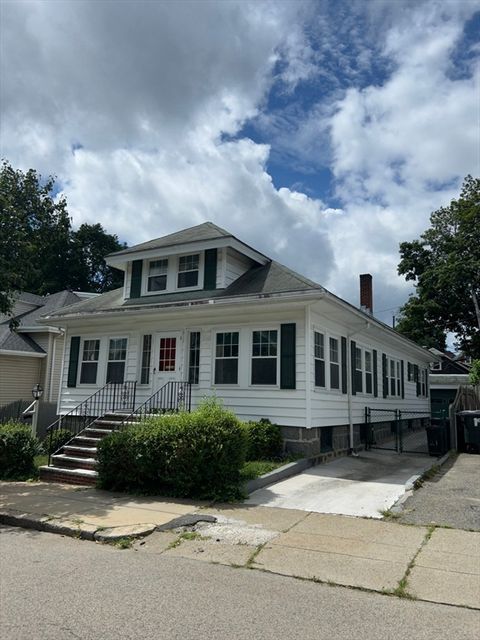
75 Ruthven St, Boston, MA 02121
$-4,789
Cash flow
-21.0%
Cash-on-Cash Return
0.8%
Cap rate
0.3%
Rent to Value Ratio
Active
$775,000
3
bds
|
1
ba
|
1,892
sqft
|
built
1910
21 Bexley Rd, Boston, MA 02131
$-1,787
Cash flow
-12.0%
Cash-on-Cash Return
2.9%
Cap rate
0.5%
Rent to Value Ratio
Active
$725,000
2
bds
|
3
ba
|
1,800
sqft
|
built
1968
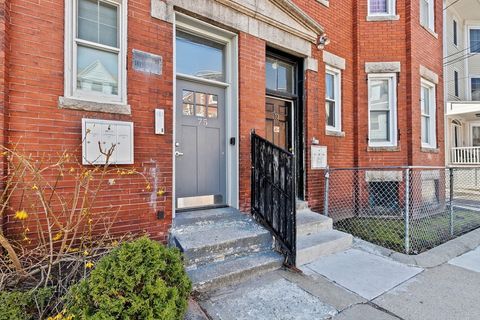
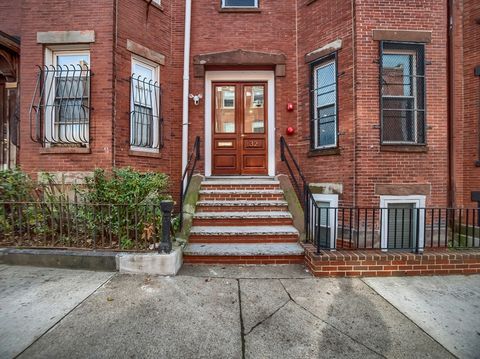
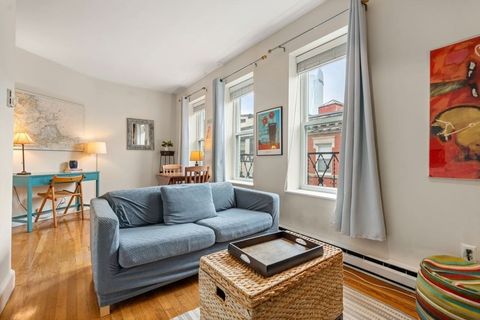
32 Williams St, Boston, MA 02119
$-909
Cash flow
-6.5%
Cash-on-Cash Return
4.2%
Cap rate
0.6%
Rent to Value Ratio
Active
$519,000
1
bds
|
1
ba
|
500
sqft
|
built
1920
121 Salem St, Boston, MA 02113
$-1,487
Cash flow
-14.9%
Cash-on-Cash Return
2.2%
Cap rate
0.5%
Rent to Value Ratio
Active
$1,498,000
2
bds
|
2
ba
|
910
sqft
|
built
2020
100 Shawmut Ave, Boston, MA 02118
$-5,006
Cash flow
-17.4%
Cash-on-Cash Return
1.7%
Cap rate
0.4%
Rent to Value Ratio
Active
$499,900
1
bds
|
1
ba
|
483
sqft
|
built
1910
19 Salutation St, Boston, MA 02109
$-1,176
Cash flow
-12.3%
Cash-on-Cash Return
2.9%
Cap rate
0.6%
Rent to Value Ratio
Active
$699,000
2
bds
|
2
ba
|
1,235
sqft
|
built
1905
183 L St, Boston, MA 02127
$-1,811
Cash flow
-13.5%
Cash-on-Cash Return
2.6%
Cap rate
0.5%
Rent to Value Ratio
Active
$410,000
1
bds
|
1
ba
|
568
sqft
|
built
1930
38 Ransom Rd, Boston, MA 02135
$-1,105
Cash flow
-14.1%
Cash-on-Cash Return
2.4%
Cap rate
0.6%
Rent to Value Ratio
Active
$599,000
2
bds
|
2
ba
|
1,087
sqft
|
built
1910
69 Falcon St, Boston, MA 02128
$-1,153
Cash flow
-10.0%
Cash-on-Cash Return
3.4%
Cap rate
0.6%
Rent to Value Ratio
Active
$950,000
1
bds
|
1
ba
|
800
sqft
|
built
1940
37 Beacon St, Boston, MA 02108
$-3,191
Cash flow
-17.5%
Cash-on-Cash Return
1.6%
Cap rate
0.3%
Rent to Value Ratio
Active
$699,000
3
bds
|
2
ba
|
1,874
sqft
|
built
1955
1800 River St, Boston, MA 02136
$-1,200
Cash flow
-9.0%
Cash-on-Cash Return
3.6%
Cap rate
0.6%
Rent to Value Ratio
Active
$1,199,000
2
bds
|
2
ba
|
1,169
sqft
|
built
1989
170 Tremont St, Boston, MA 02111
$-4,593
Cash flow
-20.0%
Cash-on-Cash Return
1.1%
Cap rate
0.5%
Rent to Value Ratio
Active
$719,900
2
bds
|
1
ba
|
848
sqft
|
built
1905
12 I St, Boston, MA 02127
$-1,809
Cash flow
-13.1%
Cash-on-Cash Return
2.7%
Cap rate
0.5%
Rent to Value Ratio
Active
$695,000
1
bds
|
1
ba
|
823
sqft
|
built
1987
357 Commercial St, Boston, MA 02109
$-1,817
Cash flow
-13.6%
Cash-on-Cash Return
2.5%
Cap rate
0.5%
Rent to Value Ratio
Active
$699,000
1
bds
|
1
ba
|
830
sqft
|
built
1900
90 Wareham St, Boston, MA 02118
$-1,885
Cash flow
-14.1%
Cash-on-Cash Return
2.4%
Cap rate
0.6%
Rent to Value Ratio
Active
$1,200,000
1
bds
|
1
ba
|
700
sqft
|
built
2018
133 Seaport Blvd, Boston, MA 02210
$-4,590
Cash flow
-20.0%
Cash-on-Cash Return
1.1%
Cap rate
0.4%
Rent to Value Ratio
Active
$799,000
1
bds
|
1
ba
|
844
sqft
|
built
2002
139 E Berkeley St, Boston, MA 02118
$-2,600
Cash flow
-17.0%
Cash-on-Cash Return
1.8%
Cap rate
0.5%
Rent to Value Ratio
Active
$1,295,000
2
bds
|
1
ba
|
925
sqft
|
built
1925
180 Commonwealth Ave, Boston, MA 02116
$-4,255
Cash flow
-17.1%
Cash-on-Cash Return
1.7%
Cap rate
0.4%
Rent to Value Ratio
Active
$479,900
2
bds
|
1
ba
|
595
sqft
|
built
2017
15 Swift Ter, Boston, MA 02128
$-766
Cash flow
-8.3%
Cash-on-Cash Return
3.8%
Cap rate
0.5%
Rent to Value Ratio
Active
$1,595,000
5
bds
|
2
ba
|
1,590
sqft
|
built
1840
379 Shawmut Ave, Boston, MA 02118
$-3,693
Cash flow
-12.1%
Cash-on-Cash Return
2.9%
Cap rate
0.5%
Rent to Value Ratio
Active
$870,000
4
bds
|
4
ba
|
2,350
sqft
|
built
1900
136 Pauline St, Winthrop, MA 02152
$-1,579
Cash flow
-9.5%
Cash-on-Cash Return
3.5%
Cap rate
0.5%
Rent to Value Ratio
Active
$975,000
2
bds
|
2
ba
|
1,114
sqft
|
built
1890
9 Beckler Ave, Boston, MA 02127
$-2,789
Cash flow
-14.9%
Cash-on-Cash Return
2.2%
Cap rate
0.4%
Rent to Value Ratio
Active
$1,295,000
6
bds
|
3
ba
|
4,673
sqft
|
built
1890
118 White St, Boston, MA 02128
$-4,685
Cash flow
-18.9%
Cash-on-Cash Return
1.3%
Cap rate
0.3%
Rent to Value Ratio
Active
$798,000
2
bds
|
1
ba
|
683
sqft
|
built
1900
345 Commonwealth Ave, Boston, MA 02115
$-2,132
Cash flow
-13.9%
Cash-on-Cash Return
2.5%
Cap rate
0.4%
Rent to Value Ratio
Active
$2,395,000
2
bds
|
3
ba
|
1,650
sqft
|
built
1900
71 Rutland St, Boston, MA 02118
$-8,175
Cash flow
-17.8%
Cash-on-Cash Return
1.6%
Cap rate
0.3%
Rent to Value Ratio
Active
$309,900
2
bds
|
1
ba
|
604
sqft
|
built
1900
77 Pearl St, Chelsea, MA 02150
$-490
Cash flow
-8.2%
Cash-on-Cash Return
3.8%
Cap rate
0.7%
Rent to Value Ratio
Active
$450,000
1
bds
|
1
ba
|
628
sqft
|
built
1910
55 Mozart St, Boston, MA 02130
$-410
Cash flow
-4.8%
Cash-on-Cash Return
4.6%
Cap rate
0.6%
Rent to Value Ratio
Active
$1,250,000
1
bds
|
1
ba
|
873
sqft
|
built
2016
1 Franklin St, Boston, MA 02110
$-4,512
Cash flow
-18.8%
Cash-on-Cash Return
1.3%
Cap rate
0.4%
Rent to Value Ratio
Active
$714,900
4
bds
|
3
ba
|
1,704
sqft
|
built
1920
19 Northdale Rd, Boston, MA 02132
$-1,459
Cash flow
-10.6%
Cash-on-Cash Return
3.2%
Cap rate
0.5%
Rent to Value Ratio
Active
$850,000
2
bds
|
3
ba
|
1,143
sqft
|
built
2017
67 Sawyer Ave, Boston, MA 02125
$-1,918
Cash flow
-11.8%
Cash-on-Cash Return
3.0%
Cap rate
0.5%
Rent to Value Ratio
Active
$699,000
1
bds
|
1
ba
|
719
sqft
|
built
1830
314A Bunker Hill St, Boston, MA 02129
$-1,348
Cash flow
-10.1%
Cash-on-Cash Return
3.4%
Cap rate
0.5%
Rent to Value Ratio
Active
$860,000
2
bds
|
2
ba
|
940
sqft
|
built
2008
178 W 4th St, Boston, MA 02127
$-2,580
Cash flow
-15.7%
Cash-on-Cash Return
2.1%
Cap rate
0.5%
Rent to Value Ratio